| Param | Original file | Final file |
|---|---|---|
| Filename | modeM0/AS1A05_176T03_9000003028cztM0_level2.fits | modeM0/AS1A05_176T03_9000003028cztM0_level2_quad_clean.evt |
| Size (bytes) | 134,801,280 | 131,086,080 |
| Size | 128.6 MB | 125.0 MB |
| Events in quadrant A | 833,684 | 806,827 |
| Events in quadrant B | 793,650 | 801,889 |
| Events in quadrant C | 812,626 | 762,277 |
| Events in quadrant D | 623,152 | 580,383 |
| Mode M0 | |||
|---|---|---|---|
| Quadrant | BADHDUFLAG | Total packets | Discarded packets |
| A | 0 | 30697 | 0 |
| B | 0 | 34308 | 0 |
| C | 0 | 30352 | 0 |
| D | 0 | 61636 | 0 |
| Mode SS | |||
|---|---|---|---|
| Quadrant | BADHDUFLAG | Total packets | Discarded packets |
| A | 0 | 298 | 0 |
| B | 0 | 298 | 0 |
| C | 0 | 298 | 0 |
| D | 0 | 298 | 0 |
| Mode M9 | |||
|---|---|---|---|
| Quadrant | BADHDUFLAG | Total packets | Discarded packets |
| A | 0 | 20 | 0 |
| B | 0 | 20 | 0 |
| C | 0 | 20 | 0 |
| D | 0 | 20 | 0 |
| Quadrant | Total seconds | Saturated seconds | Saturation percentage |
|---|---|---|---|
| A | 14754 | 270 | 1.830012% |
| B | 14754 | 389 | 2.636573% |
| C | 14754 | 270 | 1.830012% |
| D | 14754 | 3344 | 22.665040% |
Noise dominated data is calculated using 1-second bins in cleaned event files. If a bin has >2000 counts, and if more than 50% of those come from <1% of pixels, then it is considered to be noise-dominated and hence unusable.
| Quadrant | # 1 sec bins | Bins with >0 counts | Bins with >2000 counts | High rate bins dominated by noise | Noise dominated (total time) | Noise dominated (detector-on time) | Marked lightcurve |
|---|---|---|---|---|---|---|---|
| A | 16654 | 14750 | 0 | 0 | 0.00% | 0.00% |  |
| B | 16654 | 14739 | 0 | 0 | 0.00% | 0.00% |  |
| C | 16654 | 14750 | 0 | 0 | 0.00% | 0.00% | 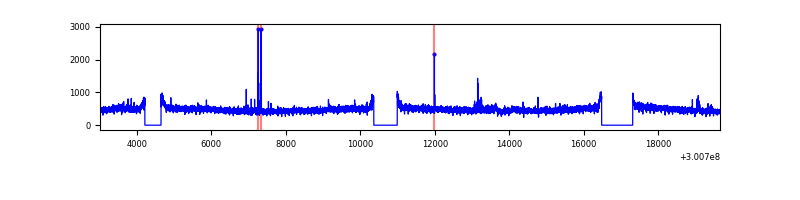 |
| D | 16653 | 14687 | 0 | 0 | 0.00% | 0.00% |  |
Top three noisy pixels from each quadrant. If the there are fewer than three noisy pixels in the level2.evt file, extra rows are filled as -1
| Pixel properties | Quadrant properties | ||||||
|---|---|---|---|---|---|---|---|
| Quadrant | DetID | PixID | Counts | Sigma | Mean | Median | Sigma |
| A | 0 | 29 | 817 | 10.95 | 216 | 202 | 56.2 |
| A | 7 | 110 | 661 | 8.17 | 216 | 202 | 56.2 |
| A | 0 | 30 | 649 | 7.96 | 216 | 202 | 56.2 |
| B | 2 | 9 | 578 | 8.55 | 210 | 200 | 44.2 |
| B | 3 | 17 | 573 | 8.44 | 210 | 200 | 44.2 |
| B | 14 | 254 | 531 | 7.49 | 210 | 200 | 44.2 |
| C | 3 | 158 | 581 | 6.72 | 214 | 199 | 56.8 |
| C | 12 | 241 | 568 | 6.49 | 214 | 199 | 56.8 |
| C | 7 | 111 | 568 | 6.49 | 214 | 199 | 56.8 |
| D | 3 | 14 | 456 | 6.14 | 178 | 162 | 47.9 |
| D | 7 | 5 | 448 | 5.97 | 178 | 162 | 47.9 |
| D | 6 | 67 | 443 | 5.87 | 178 | 162 | 47.9 |
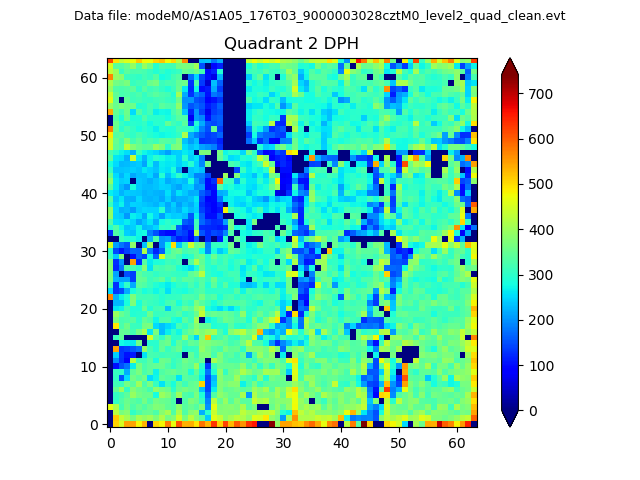
Histogram calculated using DETX and DETY for each event in the final _common_clean file
| Quadrant A |  |
 |
Quadrant B |
|---|---|---|---|
| Quadrant D | 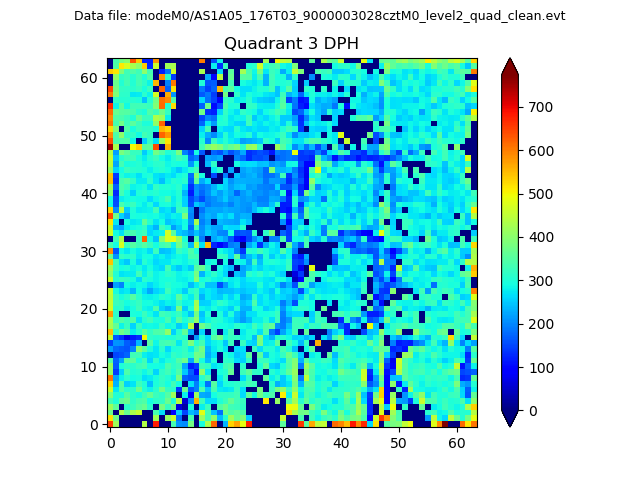 |
 |
Quadrant C |
| Plot type | Count rate plots | Images |
|---|---|---|
| Comparison with Poisson distribution Blue bars denote a histogram of data divided into 1 sec bins. Red curve is a Poisson curve with rate = median count rate of data. |
 |
 |
| Quadrant-wise count rates Data is divided into 100 sec bins |
 |
|
| Module-wise count rates for Quadrant A Data is divided into 100 sec bins |
 |
 |
| Module-wise count rates for Quadrant B Data is divided into 100 sec bins |
 |
 |
| Module-wise count rates for Quadrant C Data is divided into 100 sec bins |
 |
 |
| Module-wise count rates for Quadrant D Data is divided into 100 sec bins |
 |
 |
| Parameter | Plot |
|---|---|
| CZT HV Monitor |  |
| D_VDD | 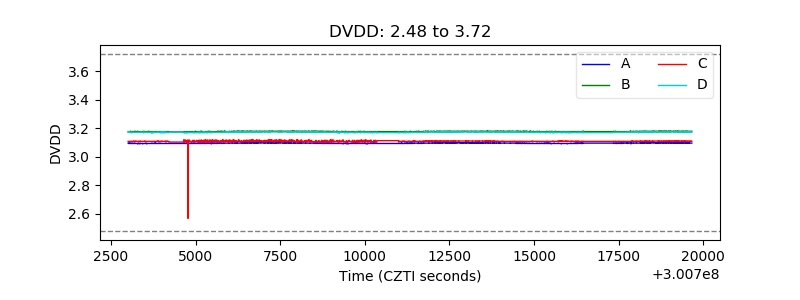 |
| Temperature 1 |  |
| Veto HV Monitor |  |
| Veto LLD |  |
| Alpha Counter |  |
| _CPM_Rate |  |
| CZT Counter |  |
| +2.5 Volts monitor |  |
| +5 Volts monitor |  |
| _ROLL_ROT | 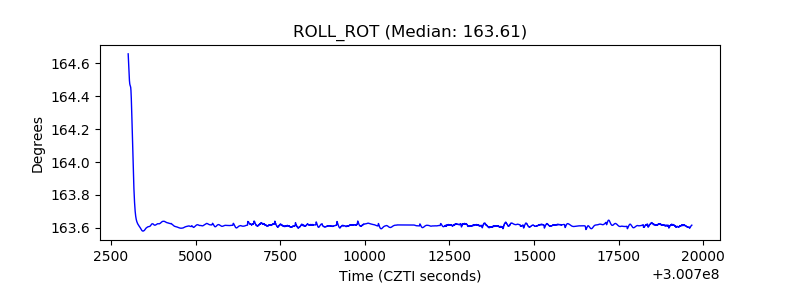 |
| _Roll_DEC |  |
| _Roll_RA |  |
| Veto Counter |  |