| Param | Original file | Final file |
|---|---|---|
| Filename | modeM0/AS1A05_176T03_9000003028_20491cztM0_level2.evt | modeM0/AS1A05_176T03_9000003028_20491cztM0_level2_quad_clean.evt |
| Size (bytes) | 155,799,360 | 31,072,320 |
| Size | 148.6 MB | 29.6 MB |
| Events in quadrant A | 759,991 | 214,617 |
| Events in quadrant B | 999,756 | 212,603 |
| Events in quadrant C | 789,164 | 205,291 |
| Events in quadrant D | 2,051,820 | 183,326 |
| Mode M0 | |||
|---|---|---|---|
| Quadrant | BADHDUFLAG | Total packets | Discarded packets |
| A | 0 | 3407 | 0 |
| B | 0 | 4110 | 0 |
| C | 0 | 3446 | 0 |
| D | 0 | 7265 | 0 |
| Mode SS | |||
|---|---|---|---|
| Quadrant | BADHDUFLAG | Total packets | Discarded packets |
| A | 0 | 34 | 0 |
| B | 0 | 34 | 0 |
| C | 0 | 34 | 0 |
| D | 0 | 34 | 0 |
| Quadrant | Total seconds | Saturated seconds | Saturation percentage |
|---|---|---|---|
| A | 1694 | 1 | 0.059032% |
| B | 1695 | 13 | 0.766962% |
| C | 1695 | 4 | 0.235988% |
| D | 1695 | 334 | 19.705015% |
Noise dominated data is calculated using 1-second bins in cleaned event files. If a bin has >2000 counts, and if more than 50% of those come from <1% of pixels, then it is considered to be noise-dominated and hence unusable.
| Quadrant | # 1 sec bins | Bins with >0 counts | Bins with >2000 counts | High rate bins dominated by noise | Noise dominated (total time) | Noise dominated (detector-on time) | Marked lightcurve |
|---|---|---|---|---|---|---|---|
| A | 1694 | 1694 | 0 | 0 | 0.00% | 0.00% |  |
| B | 1695 | 1695 | 7 | 7 | 0.41% | 0.41% |  |
| C | 1695 | 1695 | 0 | 0 | 0.00% | 0.00% |  |
| D | 1694 | 1694 | 352 | 352 | 20.78% | 20.78% |  |
Top three noisy pixels from each quadrant. If the there are fewer than three noisy pixels in the level2.evt file, extra rows are filled as -1
| Pixel properties | Quadrant properties | ||||||
|---|---|---|---|---|---|---|---|
| Quadrant | DetID | PixID | Counts | Sigma | Mean | Median | Sigma |
| A | 12 | 96 | 7083 | 164.71 | 194 | 190 | 41.9 |
| A | 5 | 203 | 4906 | 112.69 | 194 | 190 | 41.9 |
| A | 0 | 226 | 1707 | 36.25 | 194 | 190 | 41.9 |
| B | 0 | 197 | 99473 | 2602.22 | 191 | 186 | 38.2 |
| B | 0 | 189 | 80010 | 2092.11 | 191 | 186 | 38.2 |
| B | 0 | 190 | 45457 | 1186.51 | 191 | 186 | 38.2 |
| C | 3 | 233 | 33927 | 756.08 | 186 | 187 | 44.6 |
| C | 14 | 238 | 28317 | 630.37 | 186 | 187 | 44.6 |
| C | 13 | 61 | 1357 | 26.22 | 186 | 187 | 44.6 |
| D | 7 | 38 | 929905 | 20936.11 | 177 | 173 | 44.4 |
| D | 12 | 218 | 101487 | 2281.43 | 177 | 173 | 44.4 |
| D | 7 | 238 | 95846 | 2154.41 | 177 | 173 | 44.4 |
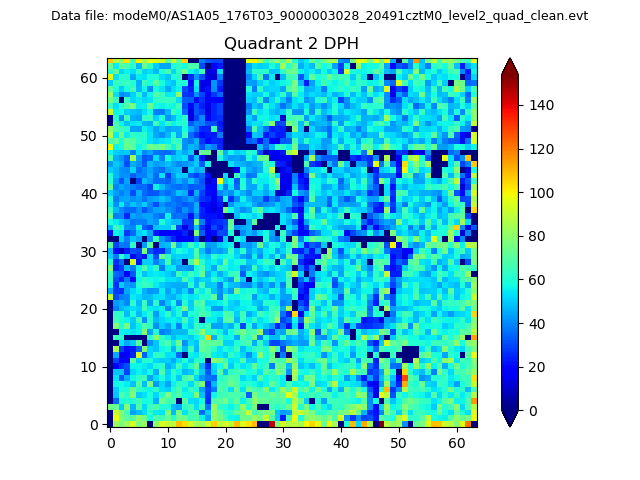
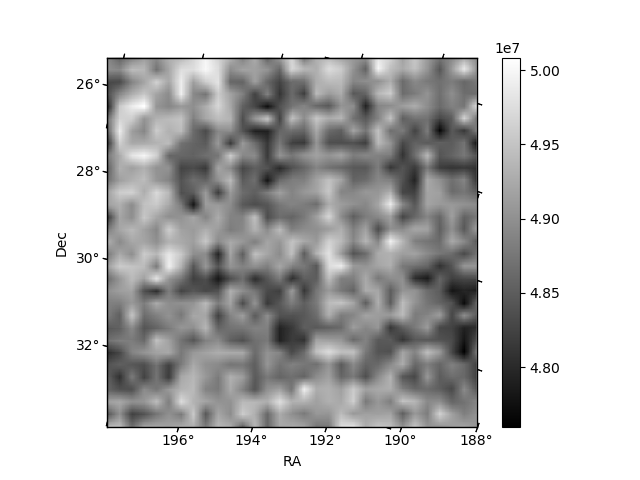
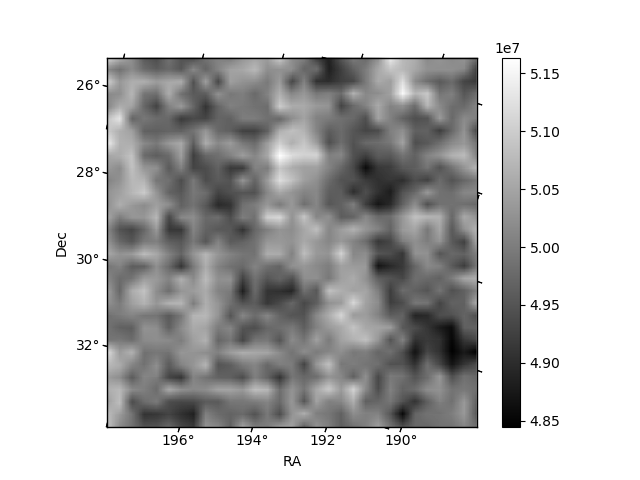
Histogram calculated using DETX and DETY for each event in the final _common_clean file
| Quadrant A | 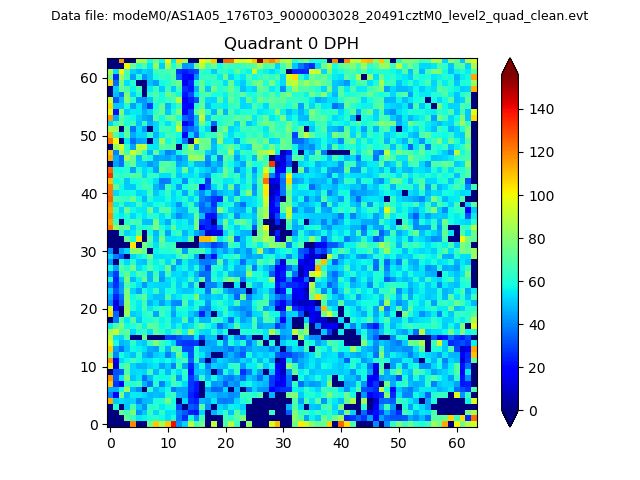 |
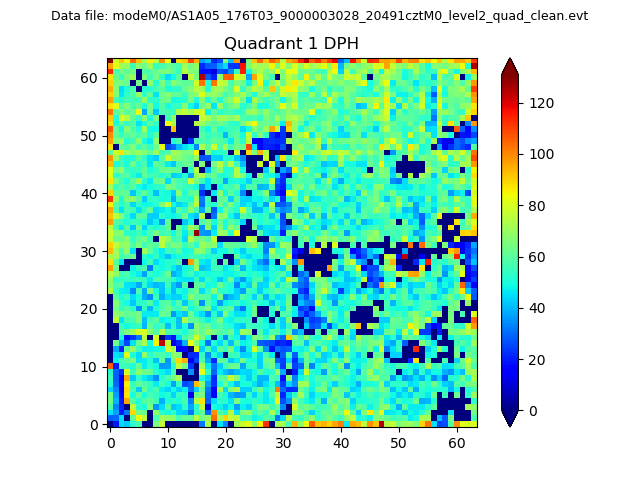 |
Quadrant B |
|---|---|---|---|
| Quadrant D | 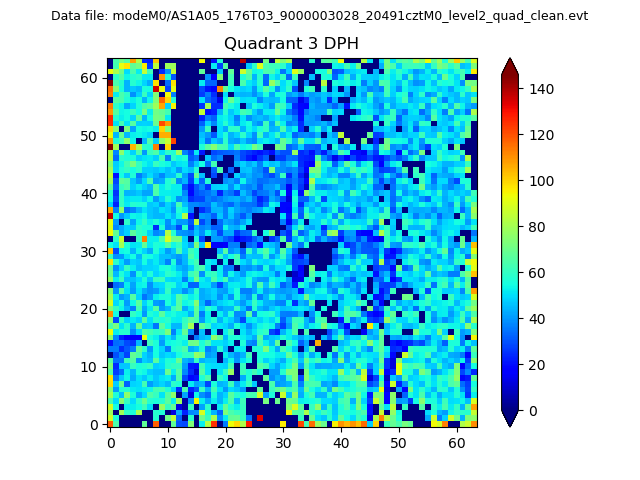 |
 |
Quadrant C |
| Plot type | Count rate plots | Images |
|---|---|---|
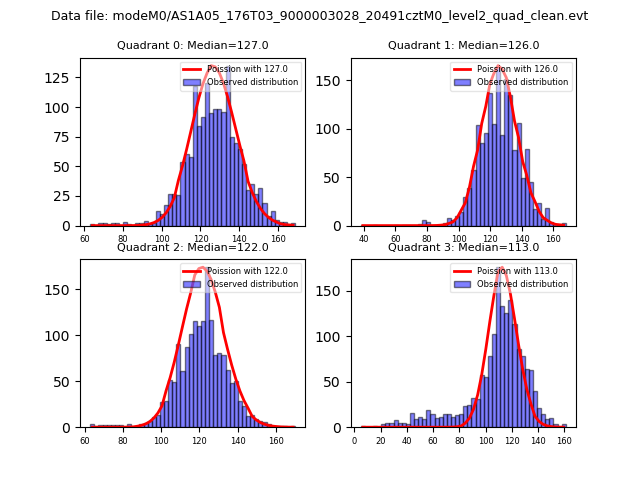
| Comparison with Poisson distribution Blue bars denote a histogram of data divided into 1 sec bins. Red curve is a Poisson curve with rate = median count rate of data. |
 |
 |
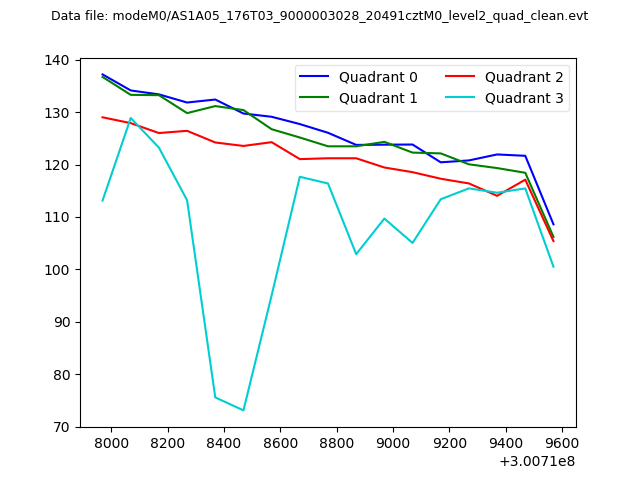
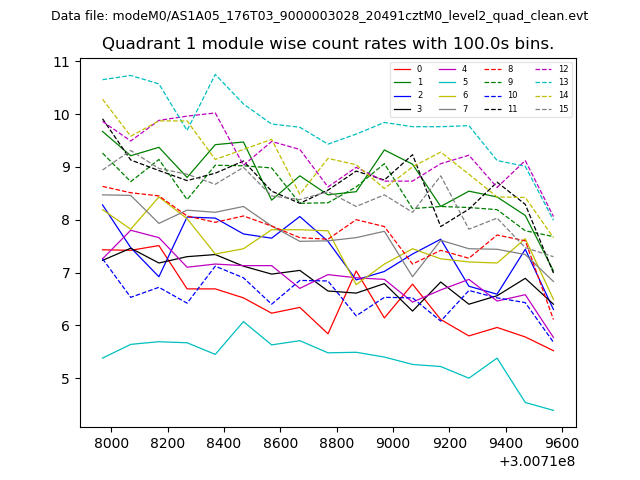
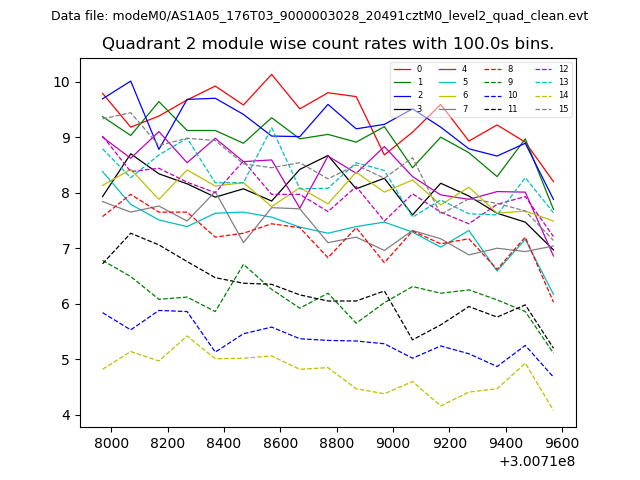
| Quadrant-wise count rates Data is divided into 100 sec bins |
 |
|
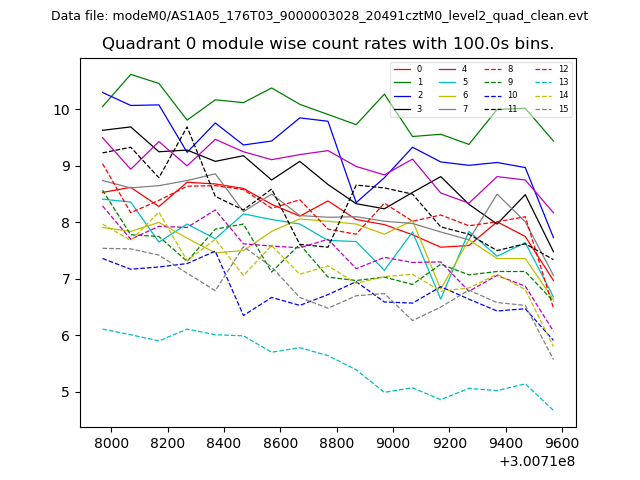
| Module-wise count rates for Quadrant A Data is divided into 100 sec bins |
 |
 |
| Module-wise count rates for Quadrant B Data is divided into 100 sec bins |
 |
 |
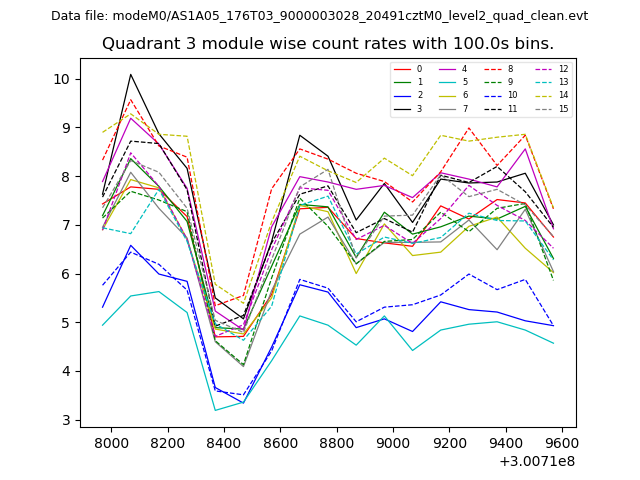
| Module-wise count rates for Quadrant C Data is divided into 100 sec bins |
 |
 |
| Module-wise count rates for Quadrant D Data is divided into 100 sec bins |
 |
 |
| Parameter | Plot |
|---|---|
| CZT HV Monitor |  |
| D_VDD | 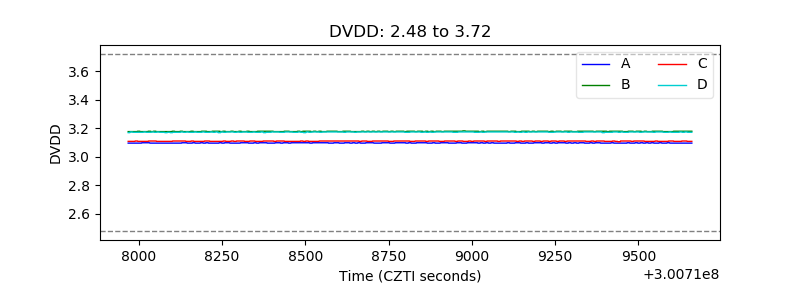 |
| Temperature 1 | 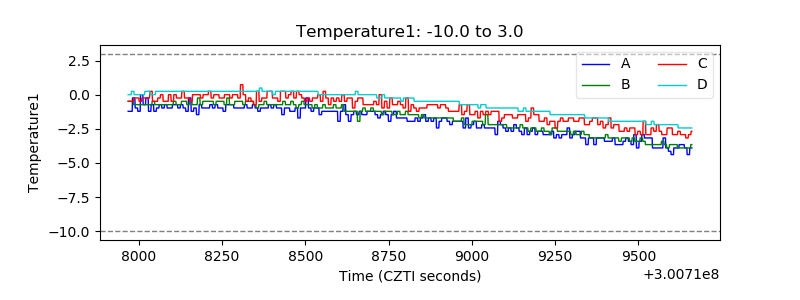 |
| Veto HV Monitor | 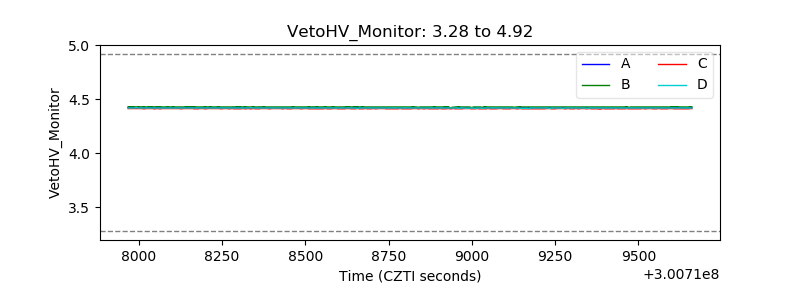 |
| Veto LLD | 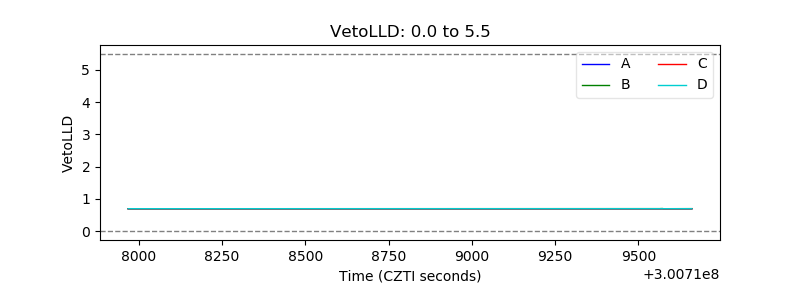 |
| Alpha Counter | 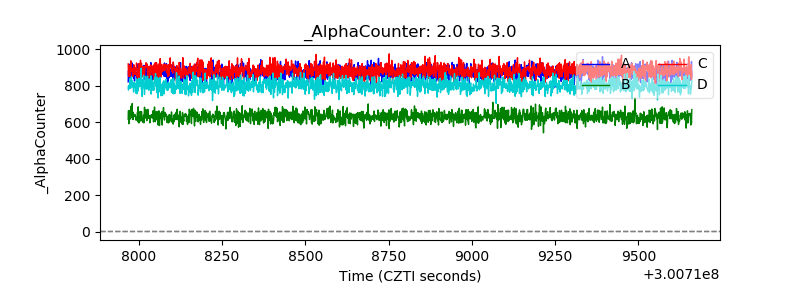 |
| _CPM_Rate | 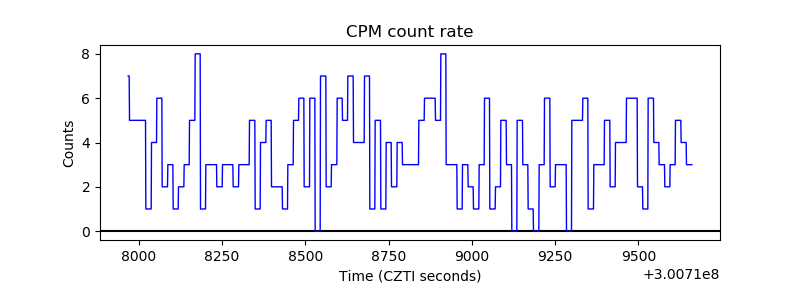 |
| CZT Counter | 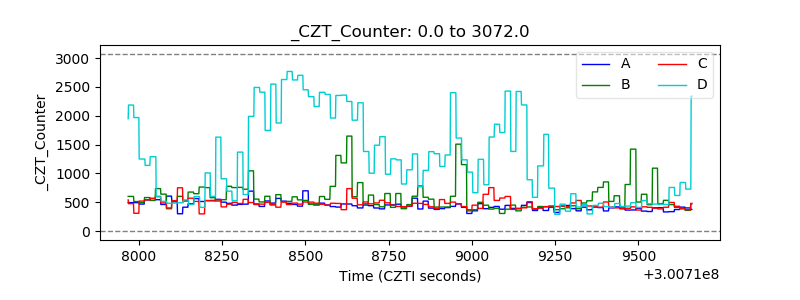 |
| +2.5 Volts monitor |  |
| +5 Volts monitor |  |
| _ROLL_ROT | 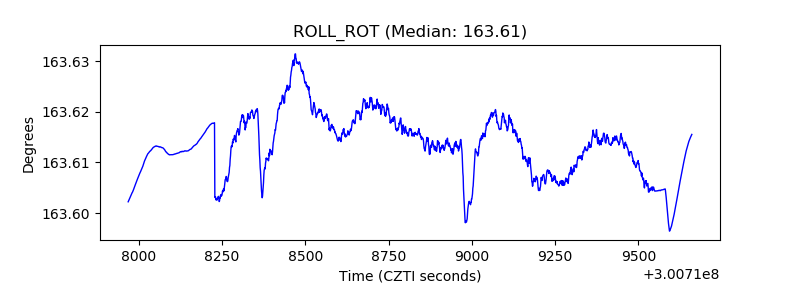 |
| _Roll_DEC | 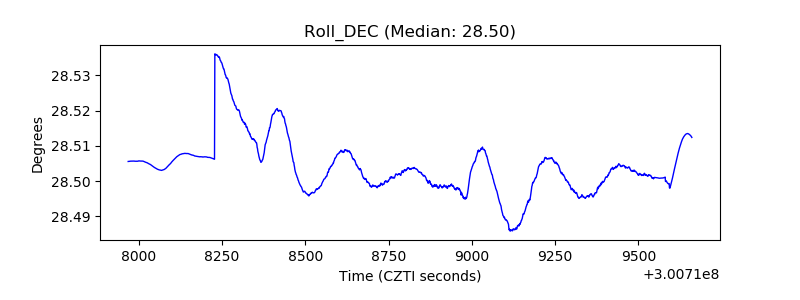 |
| _Roll_RA | 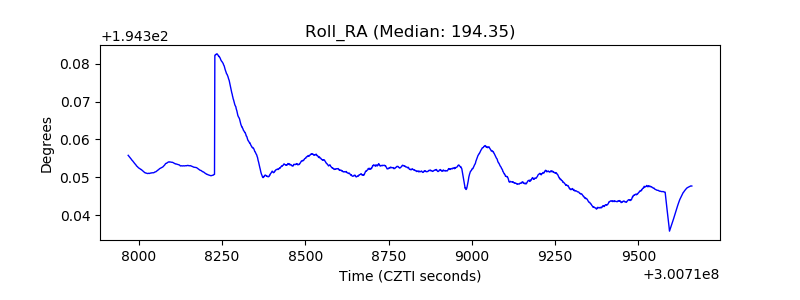 |
| Veto Counter | 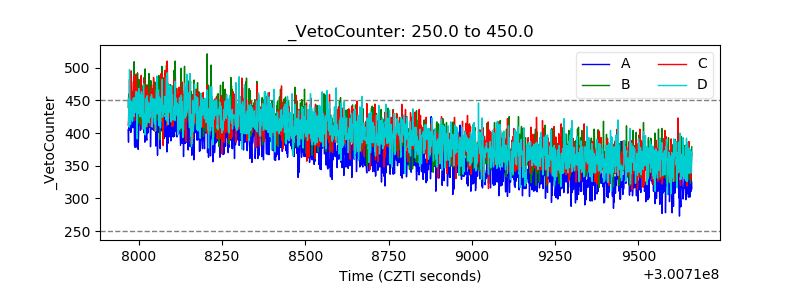 |