| Param | Original file | Final file |
|---|---|---|
| Filename | modeM0/AS1A05_115T03_9000003032_20512cztM0_level2.evt | modeM0/AS1A05_115T03_9000003032_20512cztM0_level2_quad_clean.evt |
| Size (bytes) | 394,004,160 | 55,765,440 |
| Size | 375.8 MB | 53.2 MB |
| Events in quadrant A | 2,460,833 | 344,652 |
| Events in quadrant B | 2,775,924 | 348,818 |
| Events in quadrant C | 2,479,286 | 327,988 |
| Events in quadrant D | 3,869,926 | 309,658 |
| Mode M9 | |||
|---|---|---|---|
| Quadrant | BADHDUFLAG | Total packets | Discarded packets |
| A | 0 | 12 | 0 |
| B | 0 | 12 | 0 |
| C | 0 | 12 | 0 |
| D | 0 | 12 | 0 |
| Mode M0 | |||
|---|---|---|---|
| Quadrant | BADHDUFLAG | Total packets | Discarded packets |
| A | 0 | 10560 | 1 |
| B | 0 | 11420 | 1 |
| C | 0 | 10518 | 1 |
| D | 0 | 14862 | 1 |
| Mode SS | |||
|---|---|---|---|
| Quadrant | BADHDUFLAG | Total packets | Discarded packets |
| A | 0 | 106 | 0 |
| B | 0 | 106 | 0 |
| C | 0 | 106 | 0 |
| D | 0 | 106 | 0 |
| Quadrant | Total seconds | Saturated seconds | Saturation percentage |
|---|---|---|---|
| A | 5085 | 18 | 0.353982% |
| B | 5085 | 65 | 1.278269% |
| C | 5085 | 45 | 0.884956% |
| D | 5085 | 375 | 7.374631% |
Noise dominated data is calculated using 1-second bins in cleaned event files. If a bin has >2000 counts, and if more than 50% of those come from <1% of pixels, then it is considered to be noise-dominated and hence unusable.
| Quadrant | # 1 sec bins | Bins with >0 counts | Bins with >2000 counts | High rate bins dominated by noise | Noise dominated (total time) | Noise dominated (detector-on time) | Marked lightcurve |
|---|---|---|---|---|---|---|---|
| A | 6335 | 5087 | 0 | 0 | 0.00% | 0.00% | 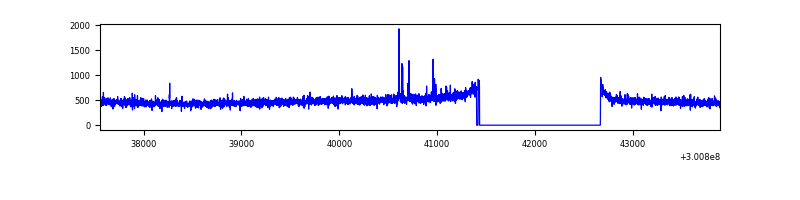 |
| B | 6335 | 5086 | 14 | 14 | 0.22% | 0.28% | 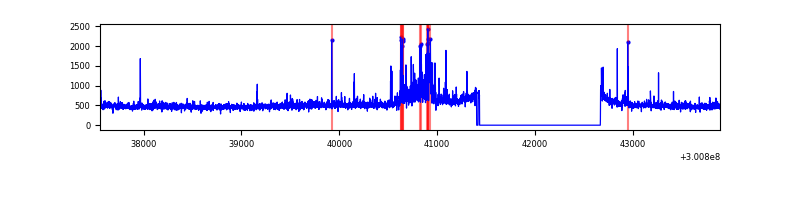 |
| C | 6335 | 5086 | 0 | 0 | 0.00% | 0.00% | 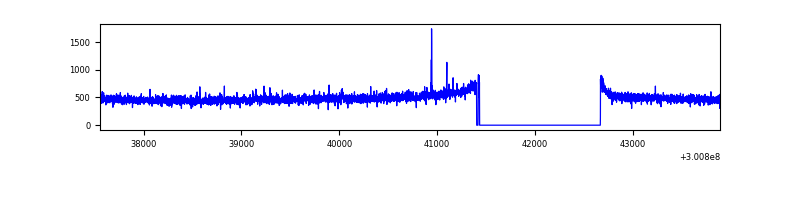 |
| D | 6335 | 5086 | 362 | 362 | 5.71% | 7.12% | 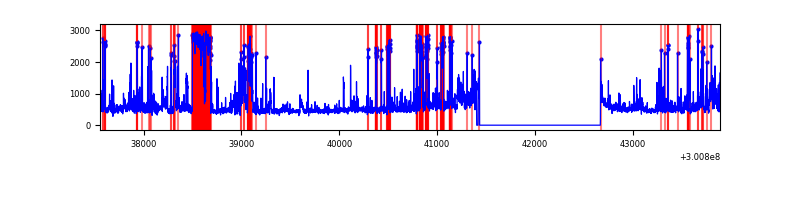 |
Top three noisy pixels from each quadrant. If the there are fewer than three noisy pixels in the level2.evt file, extra rows are filled as -1
| Pixel properties | Quadrant properties | ||||||
|---|---|---|---|---|---|---|---|
| Quadrant | DetID | PixID | Counts | Sigma | Mean | Median | Sigma |
| A | 5 | 16 | 24344 | 183.64 | 632 | 620 | 129.2 |
| A | 0 | 226 | 5602 | 38.56 | 632 | 620 | 129.2 |
| A | 3 | 137 | 4871 | 32.91 | 632 | 620 | 129.2 |
| B | 7 | 220 | 114065 | 939.08 | 636 | 620 | 120.8 |
| B | 0 | 189 | 49126 | 401.52 | 636 | 620 | 120.8 |
| B | 0 | 197 | 32616 | 264.85 | 636 | 620 | 120.8 |
| C | 14 | 238 | 96716 | 677.99 | 604 | 609 | 141.8 |
| C | 3 | 233 | 10321 | 68.51 | 604 | 609 | 141.8 |
| C | 7 | 220 | 8766 | 57.54 | 604 | 609 | 141.8 |
| D | 15 | 0 | 405835 | 2790.62 | 587 | 569 | 145.2 |
| D | 2 | 16 | 374094 | 2572.05 | 587 | 569 | 145.2 |
| D | 1 | 52 | 345338 | 2374.04 | 587 | 569 | 145.2 |
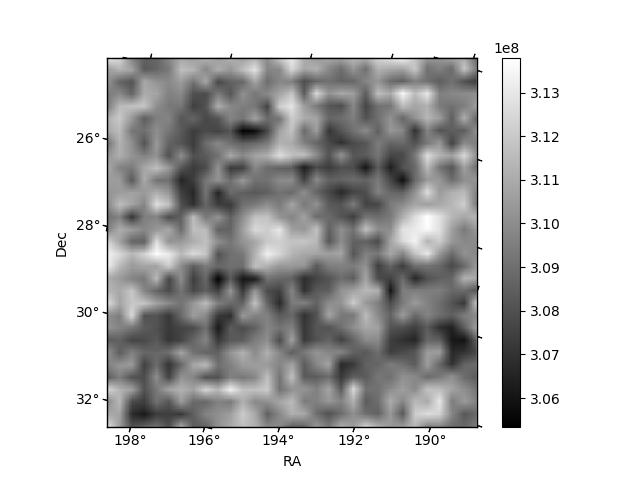
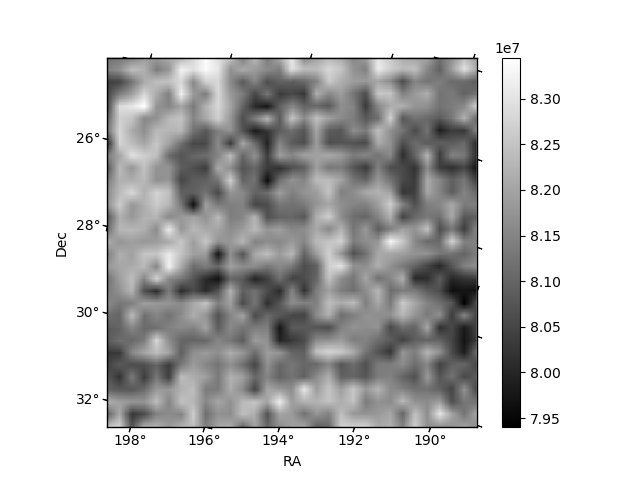
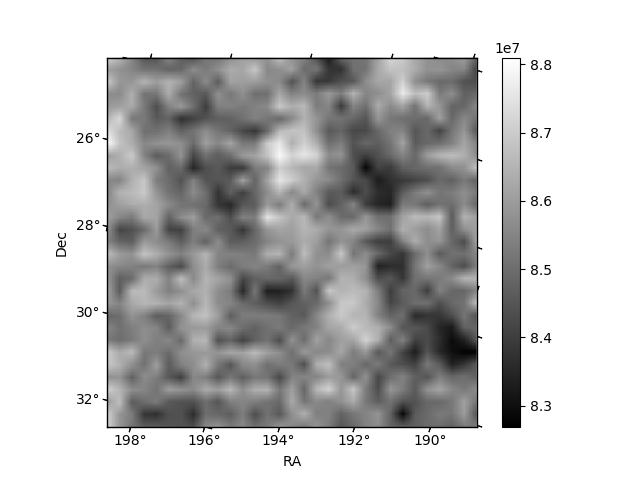
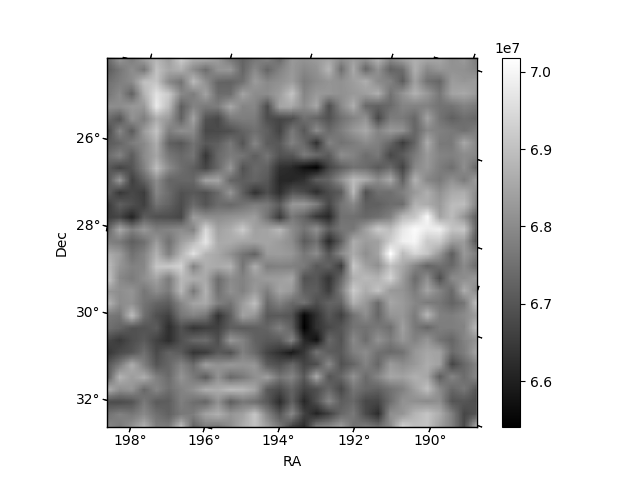
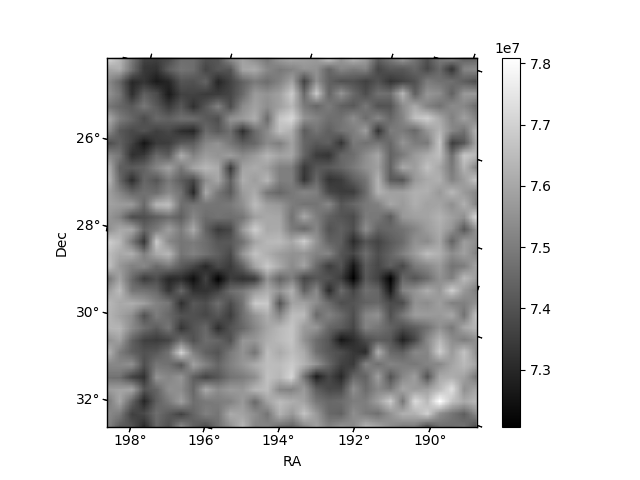
Histogram calculated using DETX and DETY for each event in the final _common_clean file
| Quadrant A | 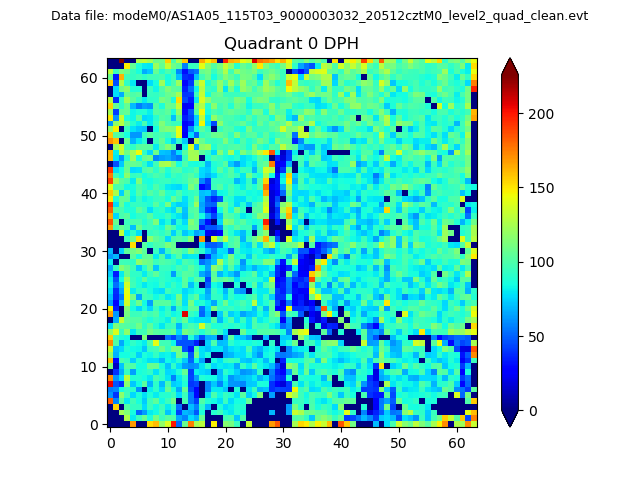 |
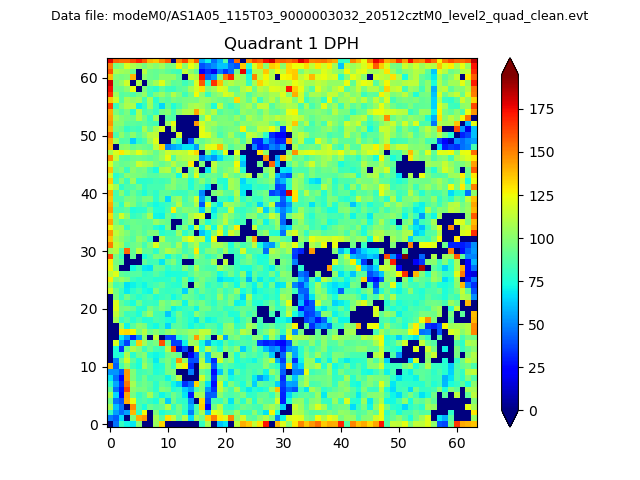 |
Quadrant B |
|---|---|---|---|
| Quadrant D | 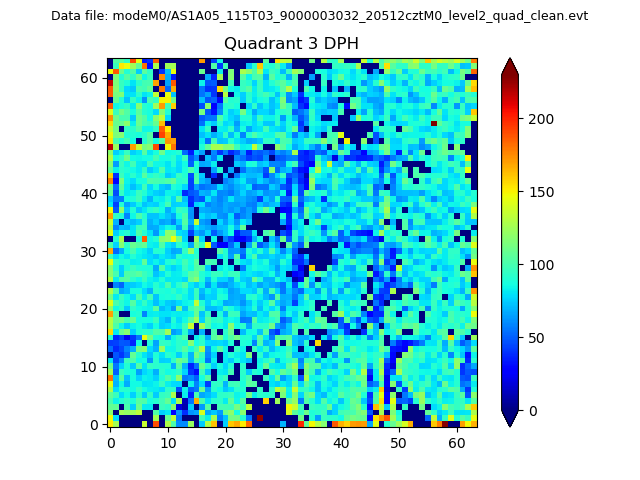 |
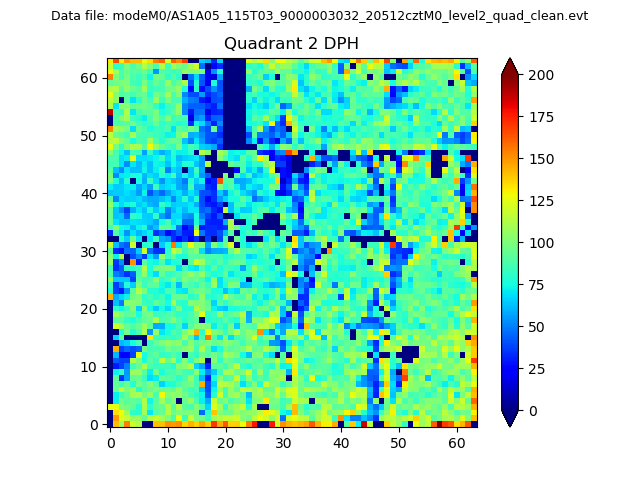 |
Quadrant C |
| Plot type | Count rate plots | Images |
|---|---|---|
| Comparison with Poisson distribution Blue bars denote a histogram of data divided into 1 sec bins. Red curve is a Poisson curve with rate = median count rate of data. |
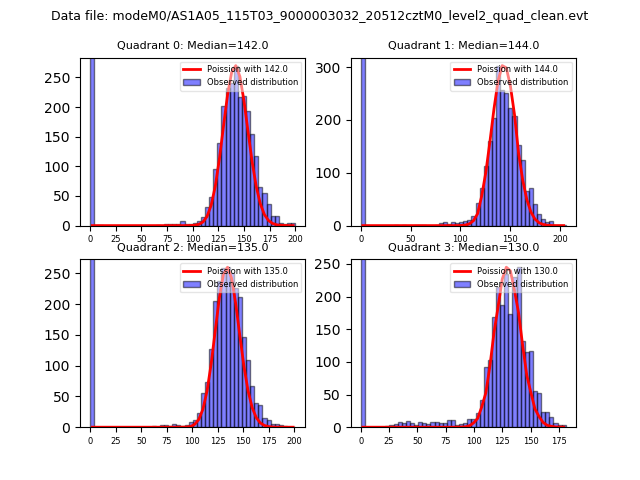 |
 |
| Quadrant-wise count rates Data is divided into 100 sec bins |
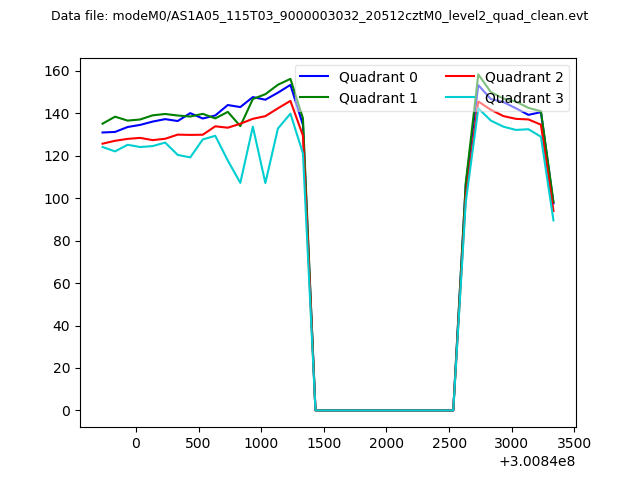 |
|
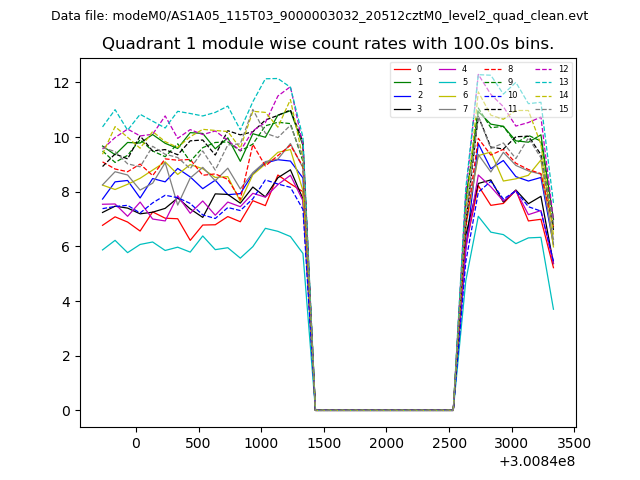
| Module-wise count rates for Quadrant A Data is divided into 100 sec bins |
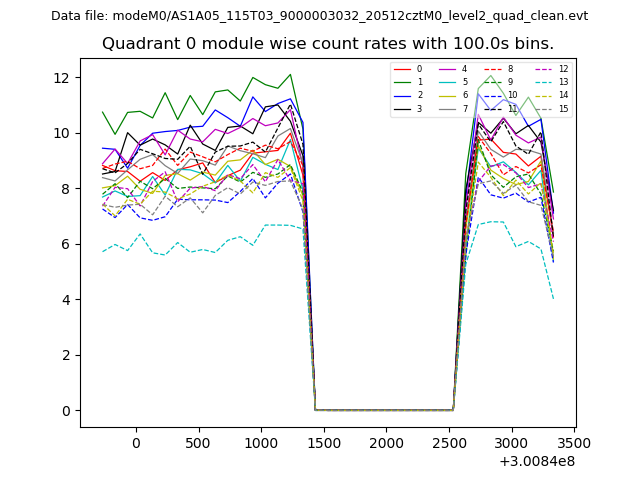 |
 |
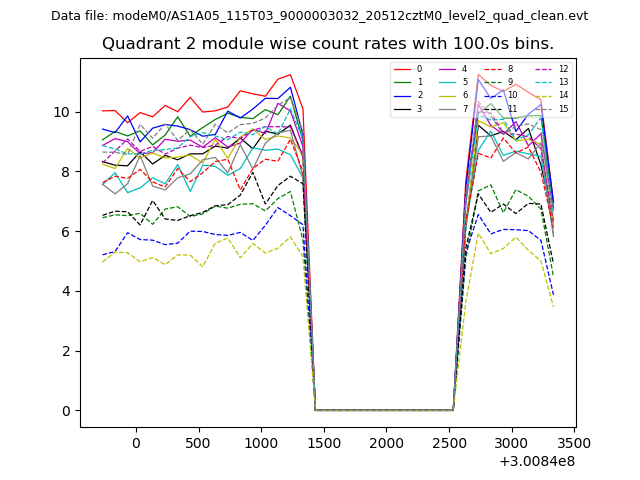
| Module-wise count rates for Quadrant B Data is divided into 100 sec bins |
 |
 |
| Module-wise count rates for Quadrant C Data is divided into 100 sec bins |
 |
 |
| Module-wise count rates for Quadrant D Data is divided into 100 sec bins |
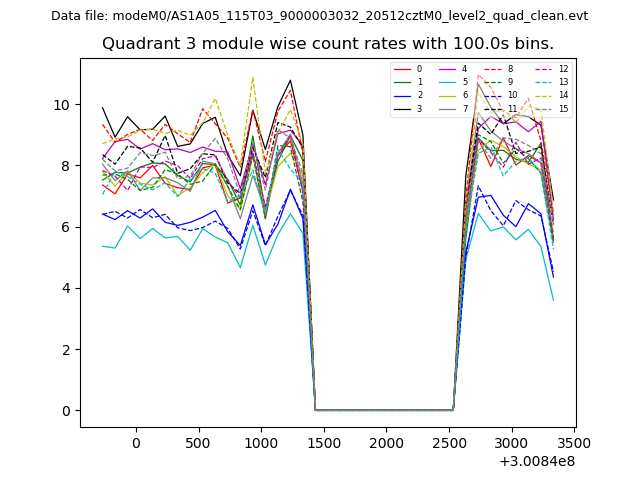 |
 |
| Parameter | Plot |
|---|---|
| CZT HV Monitor | 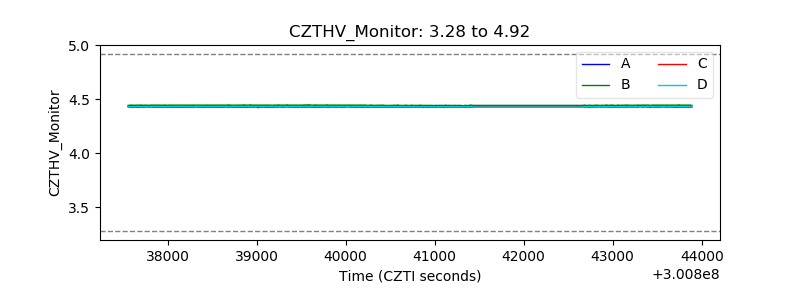 |
| D_VDD | 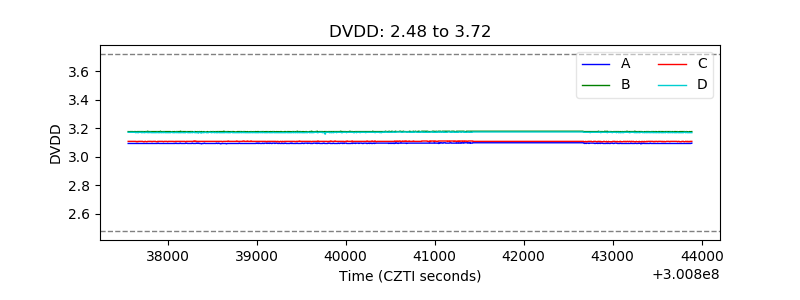 |
| Temperature 1 | 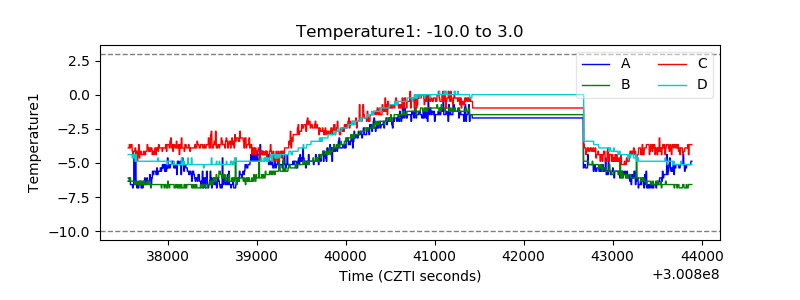 |
| Veto HV Monitor | 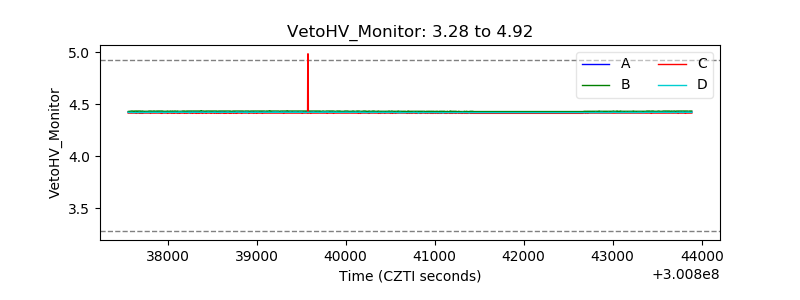 |
| Veto LLD | 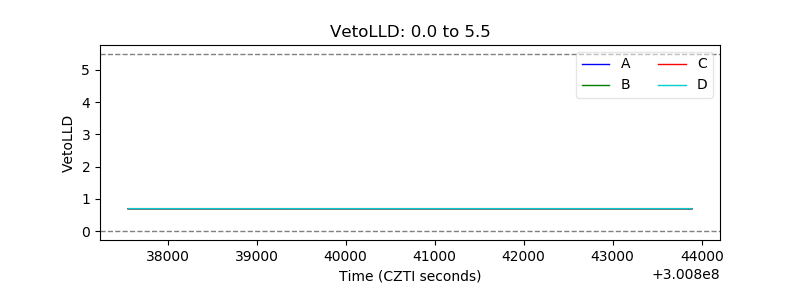 |
| Alpha Counter | 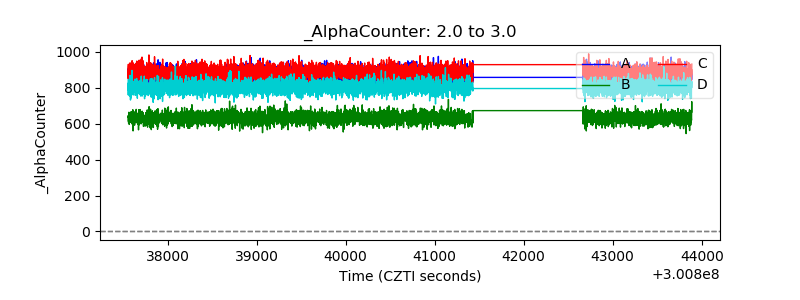 |
| _CPM_Rate | 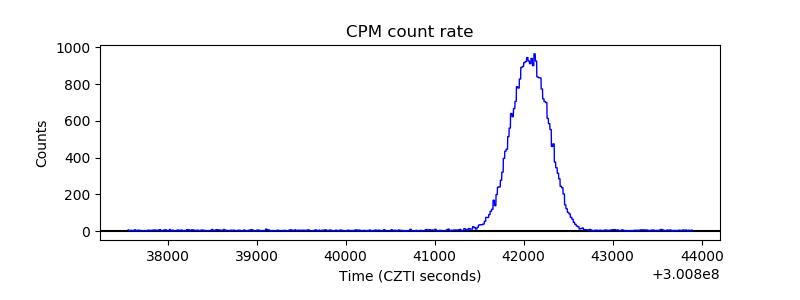 |
| CZT Counter | 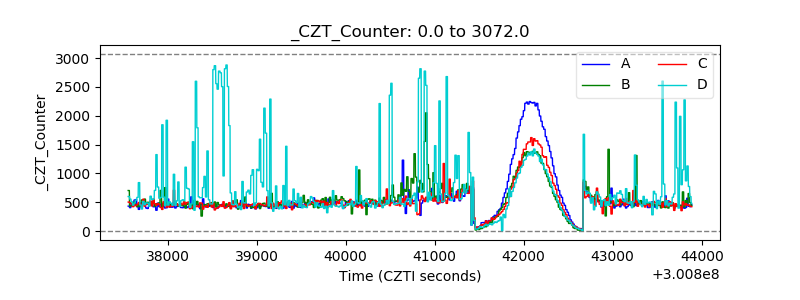 |
| +2.5 Volts monitor | 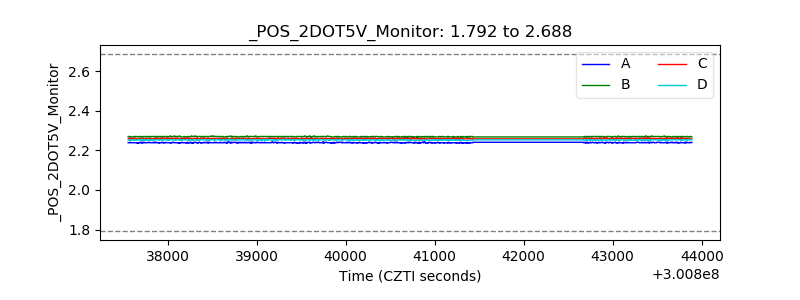 |
| +5 Volts monitor | 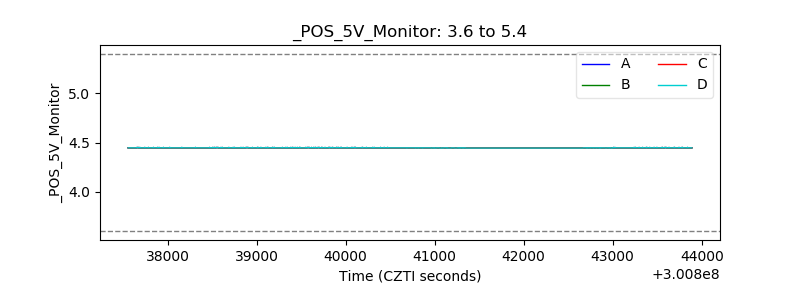 |
| _ROLL_ROT | 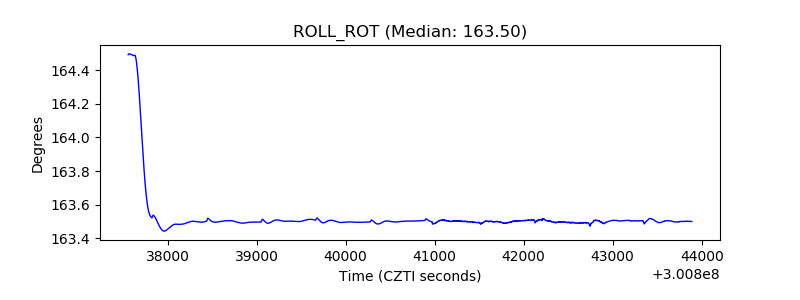 |
| _Roll_DEC | 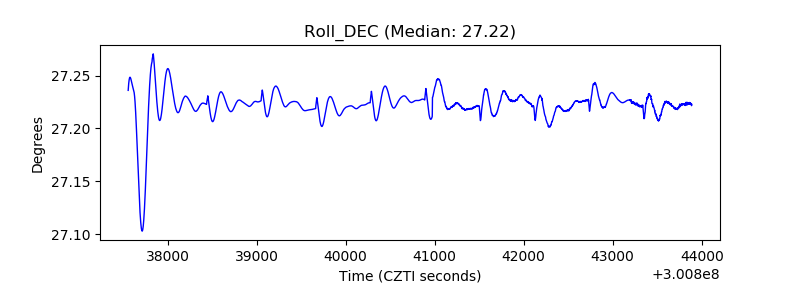 |
| _Roll_RA | 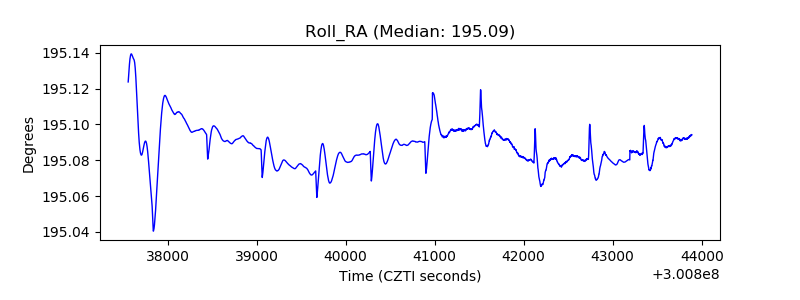 |
| Veto Counter | 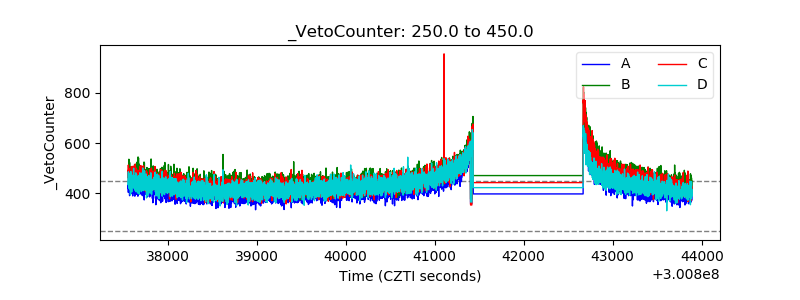 |