| Param | Original file | Final file |
|---|---|---|
| Filename | modeM0/AS1A05_115T03_9000003032_20514cztM0_level2.evt | modeM0/AS1A05_115T03_9000003032_20514cztM0_level2_quad_clean.evt |
| Size (bytes) | 565,367,040 | 76,109,760 |
| Size | 539.2 MB | 72.6 MB |
| Events in quadrant A | 3,992,682 | 457,243 |
| Events in quadrant B | 4,006,495 | 460,683 |
| Events in quadrant C | 3,524,471 | 444,354 |
| Events in quadrant D | 5,099,955 | 430,332 |
| Mode M9 | |||
|---|---|---|---|
| Quadrant | BADHDUFLAG | Total packets | Discarded packets |
| A | 0 | 3 | 0 |
| B | 0 | 3 | 0 |
| C | 0 | 3 | 0 |
| D | 0 | 3 | 0 |
| Mode M0 | |||
|---|---|---|---|
| Quadrant | BADHDUFLAG | Total packets | Discarded packets |
| A | 0 | 16599 | 1 |
| B | 0 | 16547 | 1 |
| C | 0 | 15110 | 1 |
| D | 0 | 20148 | 1 |
| Mode SS | |||
|---|---|---|---|
| Quadrant | BADHDUFLAG | Total packets | Discarded packets |
| A | 0 | 150 | 0 |
| B | 0 | 150 | 0 |
| C | 0 | 150 | 0 |
| D | 0 | 150 | 0 |
| Quadrant | Total seconds | Saturated seconds | Saturation percentage |
|---|---|---|---|
| A | 7347 | 222 | 3.021641% |
| B | 7347 | 220 | 2.994419% |
| C | 7347 | 156 | 2.123316% |
| D | 7348 | 293 | 3.987480% |
Noise dominated data is calculated using 1-second bins in cleaned event files. If a bin has >2000 counts, and if more than 50% of those come from <1% of pixels, then it is considered to be noise-dominated and hence unusable.
| Quadrant | # 1 sec bins | Bins with >0 counts | Bins with >2000 counts | High rate bins dominated by noise | Noise dominated (total time) | Noise dominated (detector-on time) | Marked lightcurve |
|---|---|---|---|---|---|---|---|
| A | 7727 | 7347 | 50 | 50 | 0.65% | 0.68% | 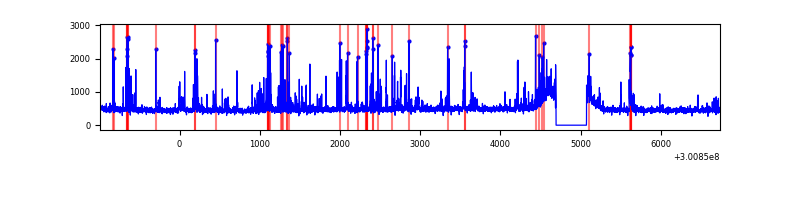 |
| B | 7727 | 7347 | 33 | 33 | 0.43% | 0.45% | 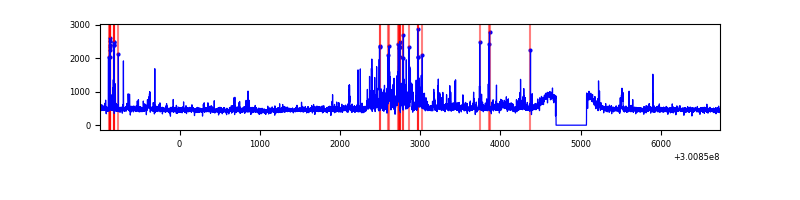 |
| C | 7727 | 7347 | 0 | 0 | 0.00% | 0.00% | 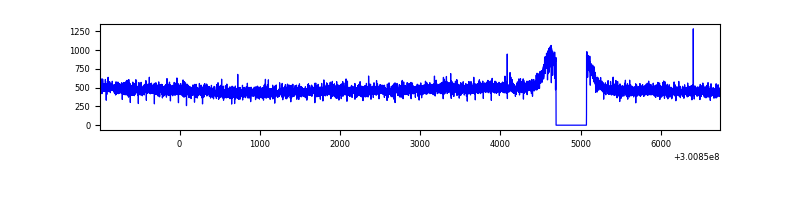 |
| D | 7728 | 7348 | 197 | 197 | 2.55% | 2.68% |  |
Top three noisy pixels from each quadrant. If the there are fewer than three noisy pixels in the level2.evt file, extra rows are filled as -1
| Pixel properties | Quadrant properties | ||||||
|---|---|---|---|---|---|---|---|
| Quadrant | DetID | PixID | Counts | Sigma | Mean | Median | Sigma |
| A | 5 | 16 | 464778 | 2559.73 | 888 | 867 | 181.2 |
| A | 12 | 96 | 103718 | 567.5 | 888 | 867 | 181.2 |
| A | 13 | 254 | 8047 | 39.62 | 888 | 867 | 181.2 |
| B | 7 | 220 | 167004 | 953.71 | 897 | 873 | 174.2 |
| B | 10 | 246 | 80044 | 454.5 | 897 | 873 | 174.2 |
| B | 0 | 197 | 68485 | 388.14 | 897 | 873 | 174.2 |
| C | 14 | 238 | 133367 | 652.11 | 859 | 862 | 203.2 |
| C | 7 | 220 | 33738 | 161.8 | 859 | 862 | 203.2 |
| C | 3 | 233 | 9945 | 44.7 | 859 | 862 | 203.2 |
| D | 1 | 52 | 412921 | 1980.91 | 856 | 832 | 208.0 |
| D | 7 | 238 | 375215 | 1799.66 | 856 | 832 | 208.0 |
| D | 13 | 153 | 333673 | 1599.97 | 856 | 832 | 208.0 |
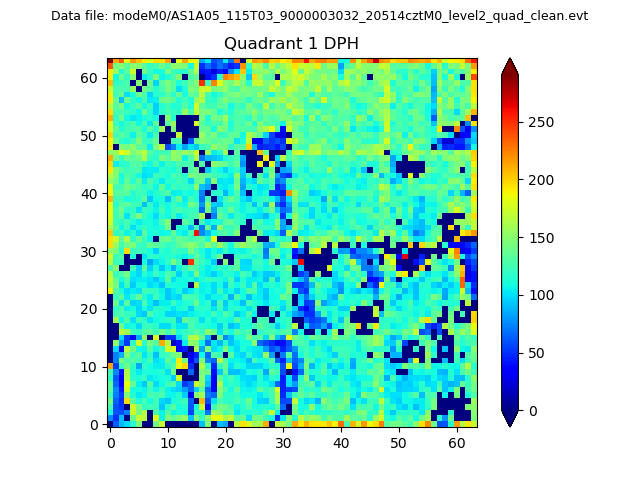
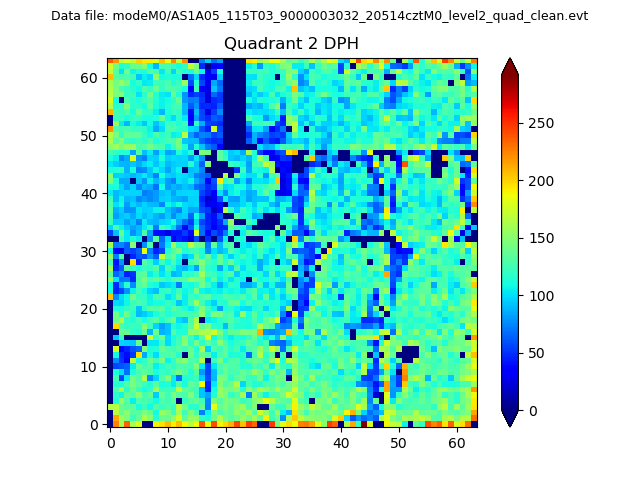
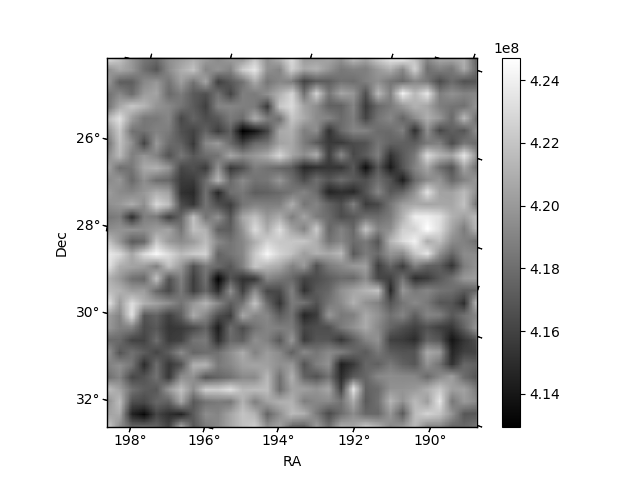
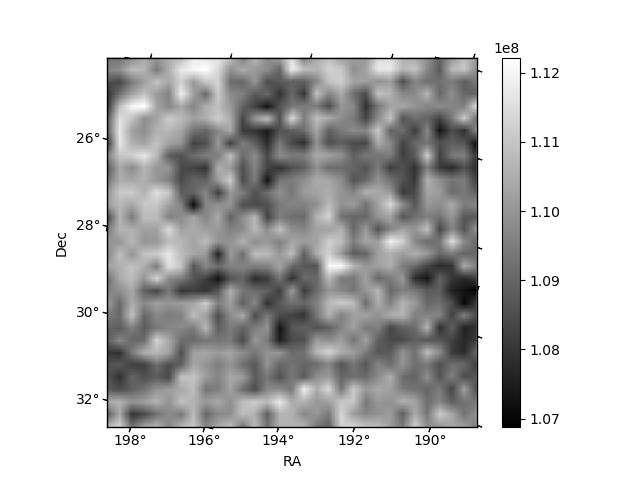
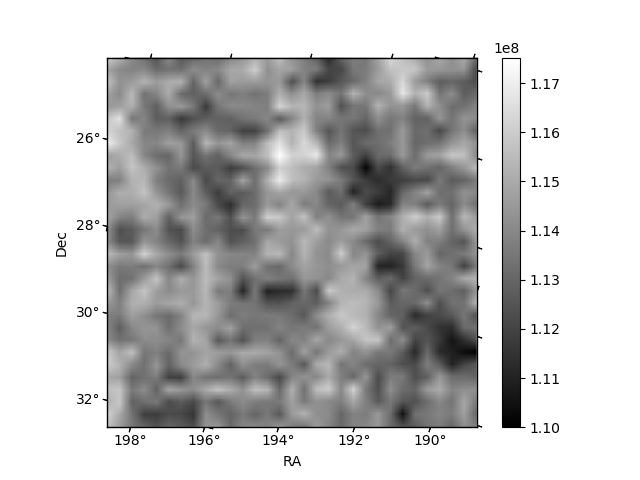
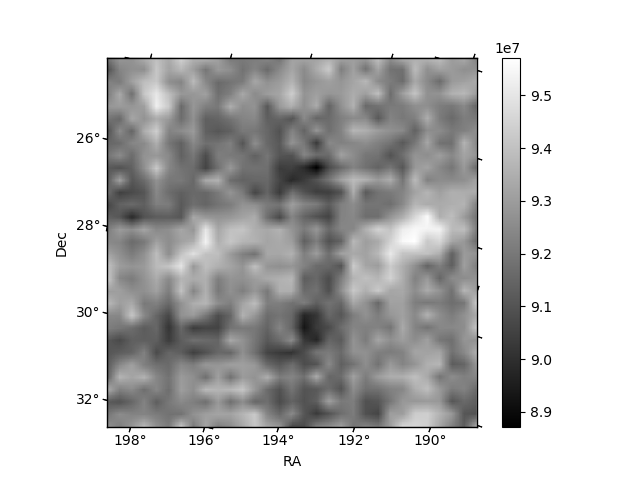
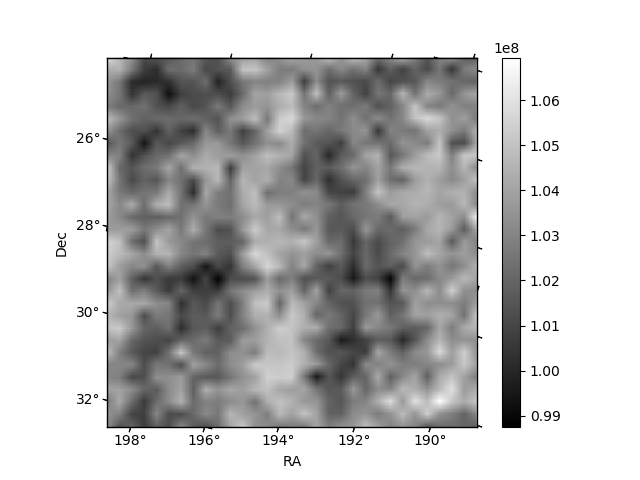
Histogram calculated using DETX and DETY for each event in the final _common_clean file
| Quadrant A | 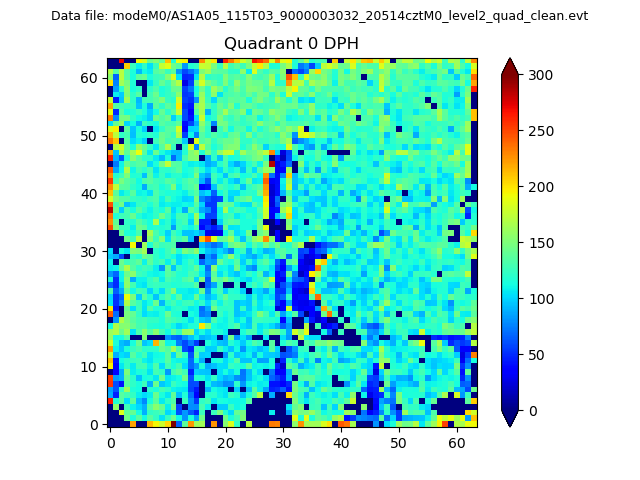 |
 |
Quadrant B |
|---|---|---|---|
| Quadrant D | 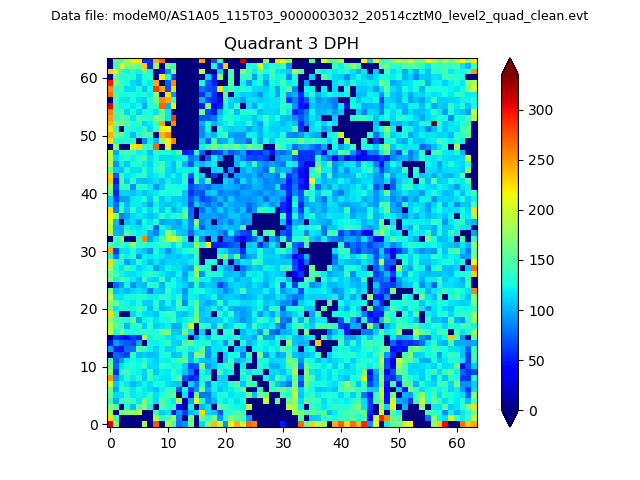 |
 |
Quadrant C |
| Plot type | Count rate plots | Images |
|---|---|---|
| Comparison with Poisson distribution Blue bars denote a histogram of data divided into 1 sec bins. Red curve is a Poisson curve with rate = median count rate of data. |
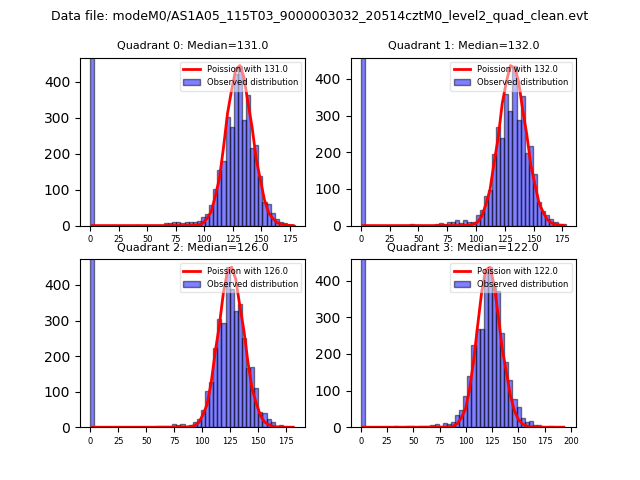 |
 |
| Quadrant-wise count rates Data is divided into 100 sec bins |
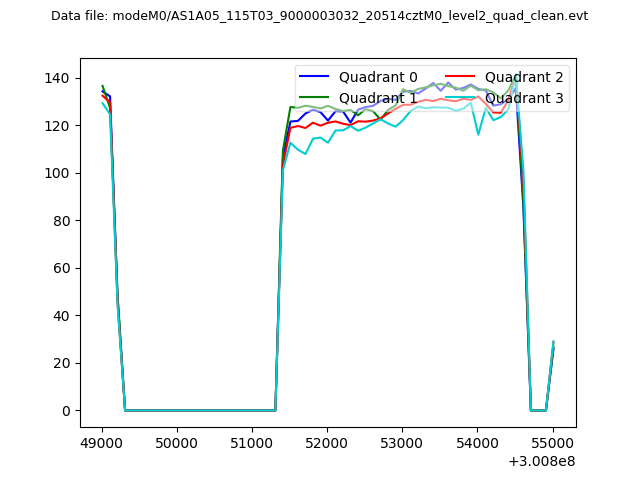 |
|
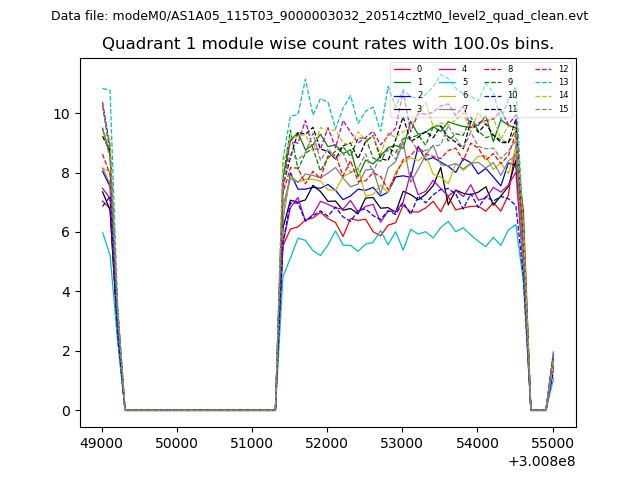
| Module-wise count rates for Quadrant A Data is divided into 100 sec bins |
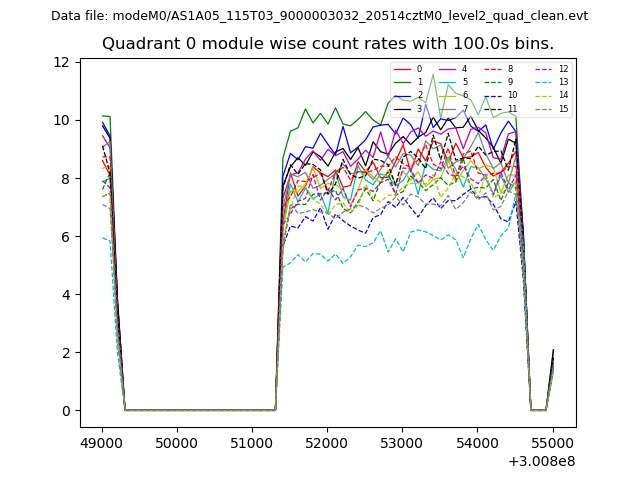 |
 |
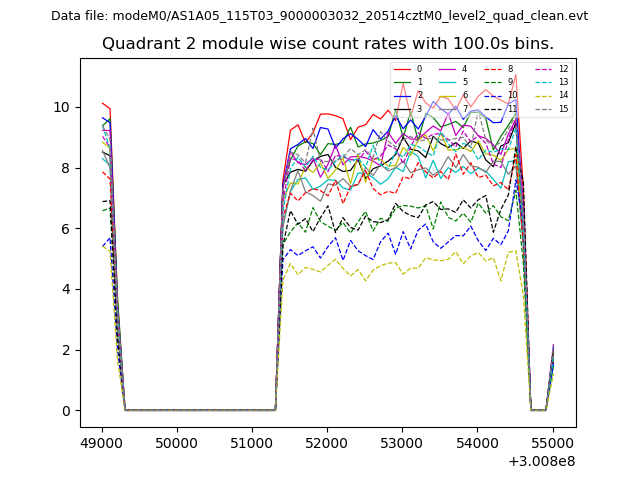
| Module-wise count rates for Quadrant B Data is divided into 100 sec bins |
 |
 |
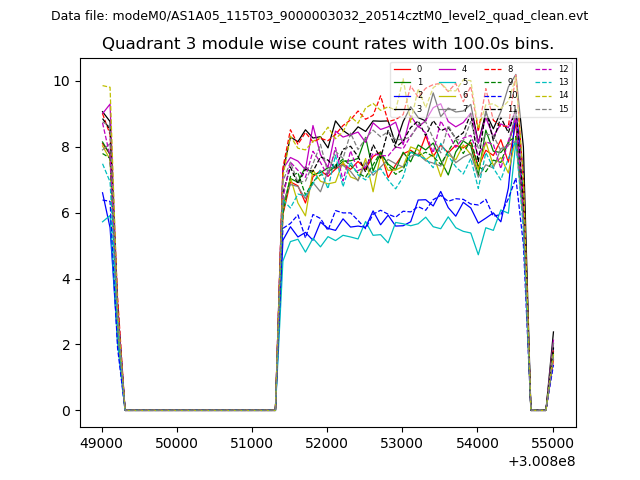
| Module-wise count rates for Quadrant C Data is divided into 100 sec bins |
 |
 |
| Module-wise count rates for Quadrant D Data is divided into 100 sec bins |
 |
 |
| Parameter | Plot |
|---|---|
| CZT HV Monitor | 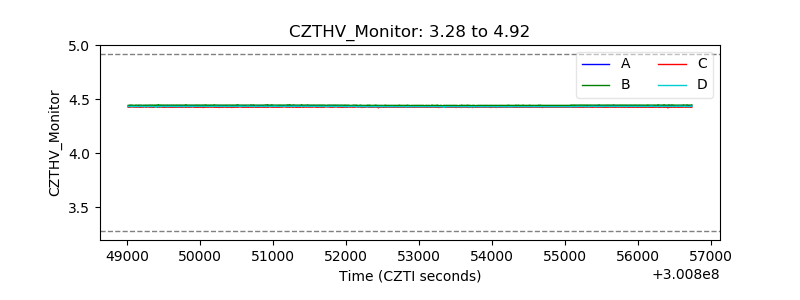 |
| D_VDD | 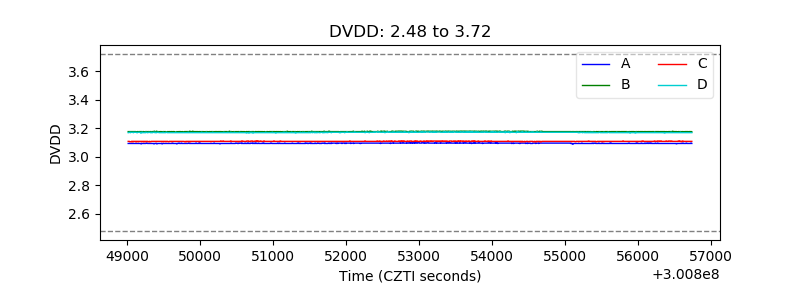 |
| Temperature 1 | 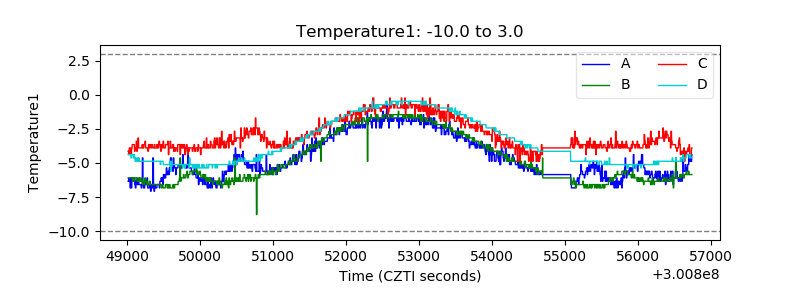 |
| Veto HV Monitor | 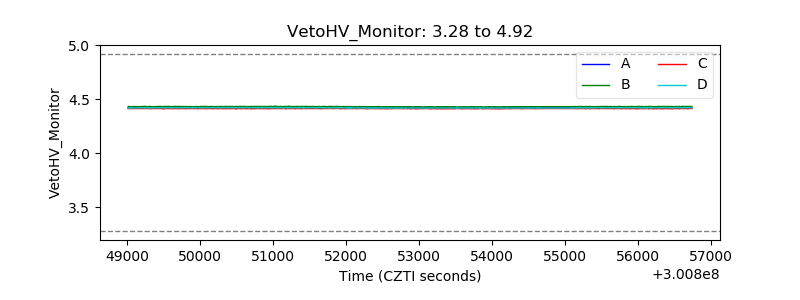 |
| Veto LLD |  |
| Alpha Counter | 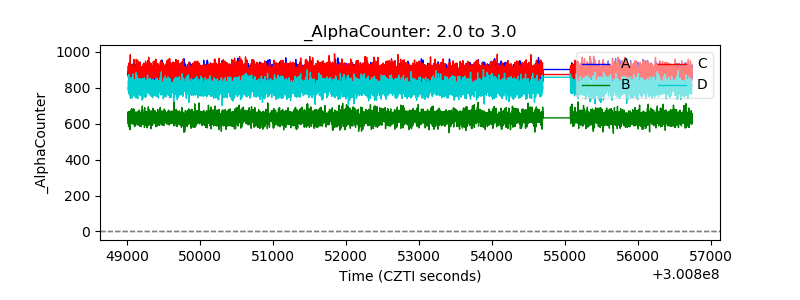 |
| _CPM_Rate | 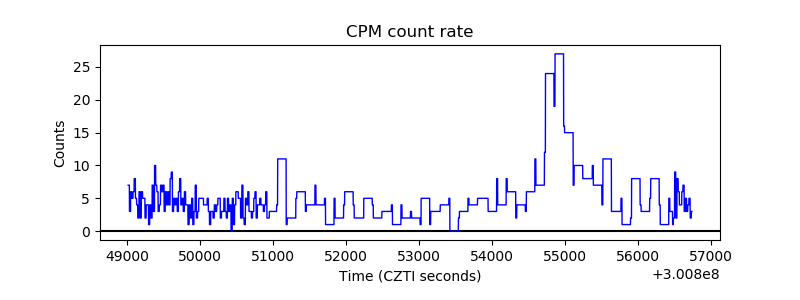 |
| CZT Counter | 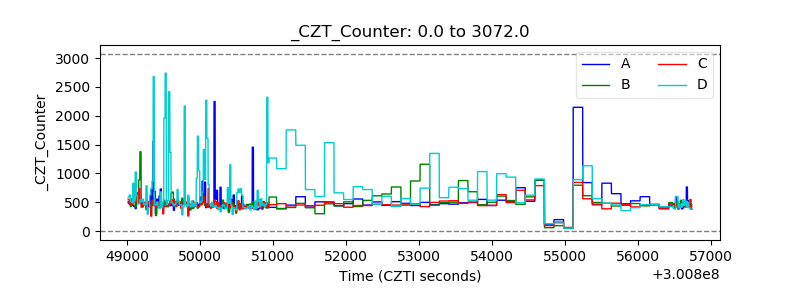 |
| +2.5 Volts monitor |  |
| +5 Volts monitor | 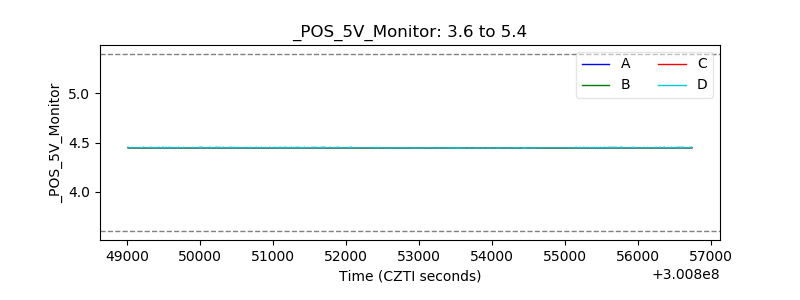 |
| _ROLL_ROT | 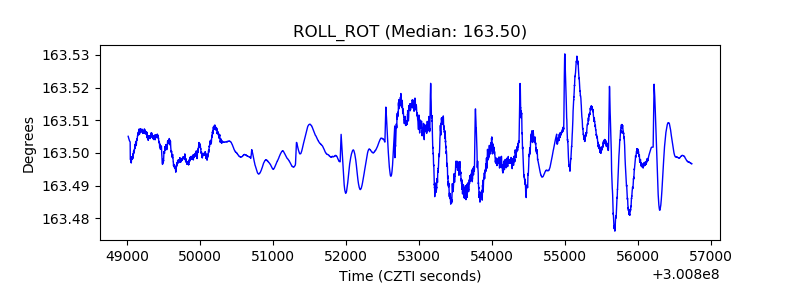 |
| _Roll_DEC | 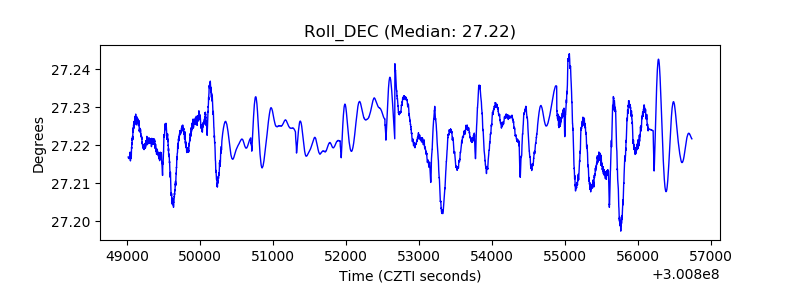 |
| _Roll_RA | 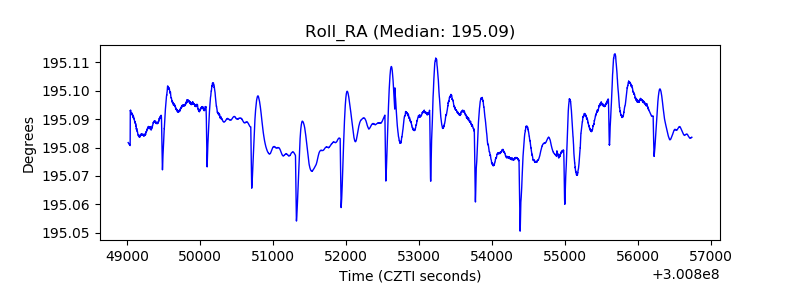 |
| Veto Counter | 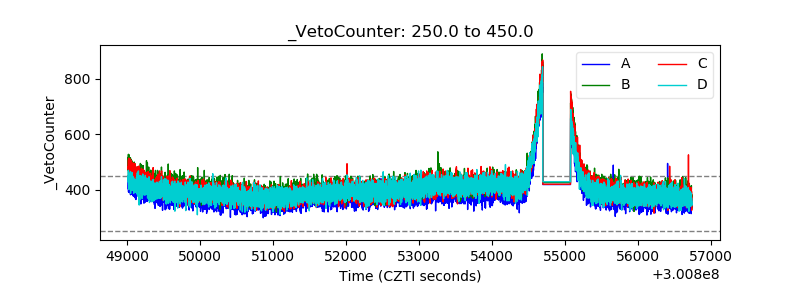 |