| Param | Original file | Final file |
|---|---|---|
| Filename | modeM0/AS1A05_115T03_9000003032_20516cztM0_level2.evt | modeM0/AS1A05_115T03_9000003032_20516cztM0_level2_quad_clean.evt |
| Size (bytes) | 623,067,840 | 82,889,280 |
| Size | 594.2 MB | 79.0 MB |
| Events in quadrant A | 4,239,065 | 505,150 |
| Events in quadrant B | 4,189,728 | 505,979 |
| Events in quadrant C | 3,767,593 | 486,779 |
| Events in quadrant D | 6,139,767 | 465,088 |
| Mode M9 | |||
|---|---|---|---|
| Quadrant | BADHDUFLAG | Total packets | Discarded packets |
| A | 0 | 3 | 0 |
| B | 0 | 3 | 0 |
| C | 0 | 3 | 0 |
| D | 0 | 3 | 0 |
| Mode M0 | |||
|---|---|---|---|
| Quadrant | BADHDUFLAG | Total packets | Discarded packets |
| A | 0 | 17784 | 3 |
| B | 0 | 17352 | 2 |
| C | 0 | 16277 | 2 |
| D | 0 | 23454 | 2 |
| Mode SS | |||
|---|---|---|---|
| Quadrant | BADHDUFLAG | Total packets | Discarded packets |
| A | 0 | 160 | 0 |
| B | 0 | 160 | 0 |
| C | 0 | 160 | 0 |
| D | 0 | 160 | 0 |
| Quadrant | Total seconds | Saturated seconds | Saturation percentage |
|---|---|---|---|
| A | 7861 | 415 | 5.279227% |
| B | 7861 | 390 | 4.961201% |
| C | 7862 | 325 | 4.133808% |
| D | 7862 | 775 | 9.857543% |
Noise dominated data is calculated using 1-second bins in cleaned event files. If a bin has >2000 counts, and if more than 50% of those come from <1% of pixels, then it is considered to be noise-dominated and hence unusable.
| Quadrant | # 1 sec bins | Bins with >0 counts | Bins with >2000 counts | High rate bins dominated by noise | Noise dominated (total time) | Noise dominated (detector-on time) | Marked lightcurve |
|---|---|---|---|---|---|---|---|
| A | 8206 | 7861 | 91 | 91 | 1.11% | 1.16% | 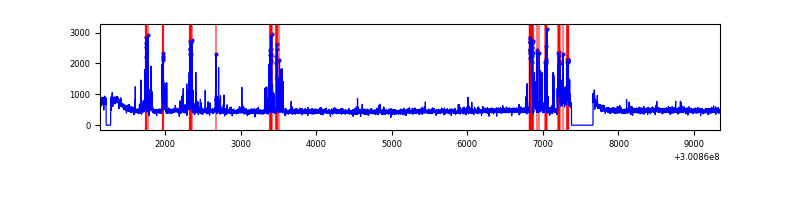 |
| B | 8206 | 7861 | 42 | 42 | 0.51% | 0.53% | 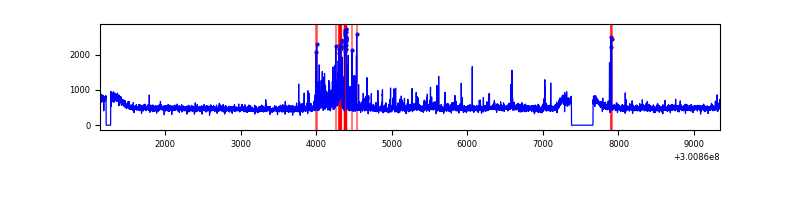 |
| C | 8207 | 7862 | 0 | 0 | 0.00% | 0.00% | 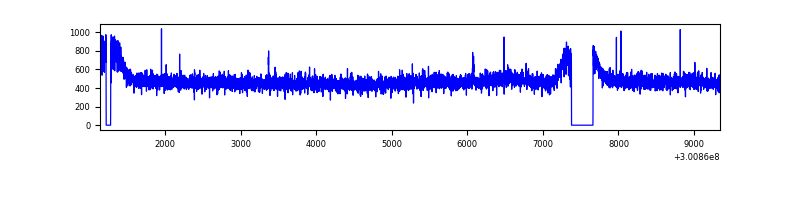 |
| D | 8207 | 7862 | 404 | 404 | 4.92% | 5.14% | 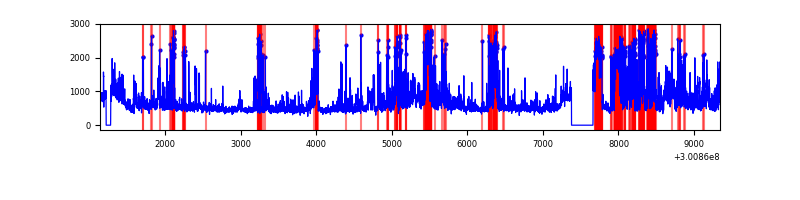 |
Top three noisy pixels from each quadrant. If the there are fewer than three noisy pixels in the level2.evt file, extra rows are filled as -1
| Pixel properties | Quadrant properties | ||||||
|---|---|---|---|---|---|---|---|
| Quadrant | DetID | PixID | Counts | Sigma | Mean | Median | Sigma |
| A | 5 | 16 | 486785 | 2514.07 | 952 | 928 | 193.3 |
| A | 15 | 174 | 86262 | 441.56 | 952 | 928 | 193.3 |
| A | 0 | 226 | 8133 | 37.28 | 952 | 928 | 193.3 |
| B | 7 | 220 | 132307 | 712.22 | 956 | 929 | 184.5 |
| B | 0 | 189 | 91438 | 490.66 | 956 | 929 | 184.5 |
| B | 10 | 246 | 89394 | 479.58 | 956 | 929 | 184.5 |
| C | 14 | 238 | 142323 | 647.54 | 922 | 926 | 218.4 |
| C | 3 | 233 | 12464 | 52.84 | 922 | 926 | 218.4 |
| C | 8 | 128 | 8111 | 32.9 | 922 | 926 | 218.4 |
| D | 5 | 222 | 1838991 | 8242.63 | 903 | 874 | 223.0 |
| D | 13 | 138 | 212130 | 947.33 | 903 | 874 | 223.0 |
| D | 13 | 153 | 179188 | 799.61 | 903 | 874 | 223.0 |
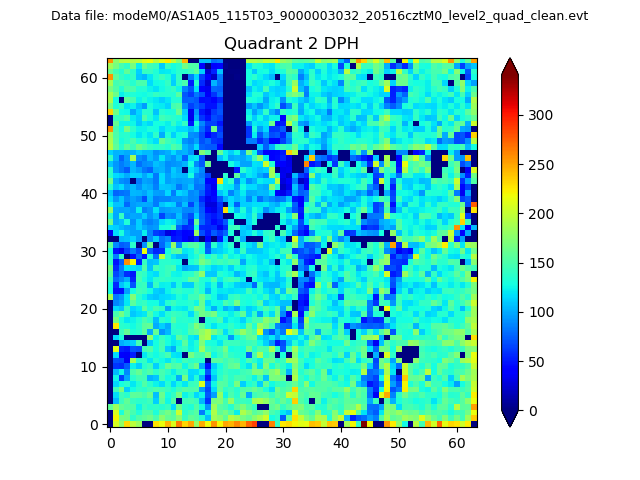
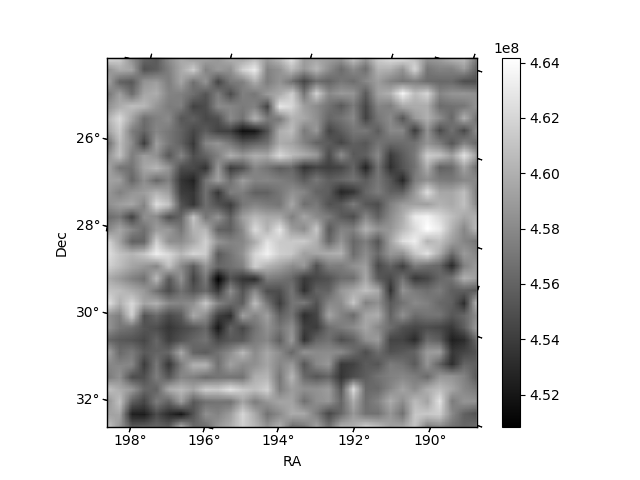
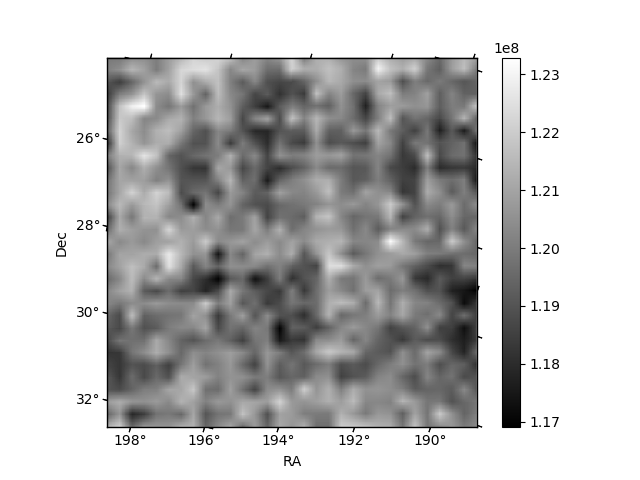
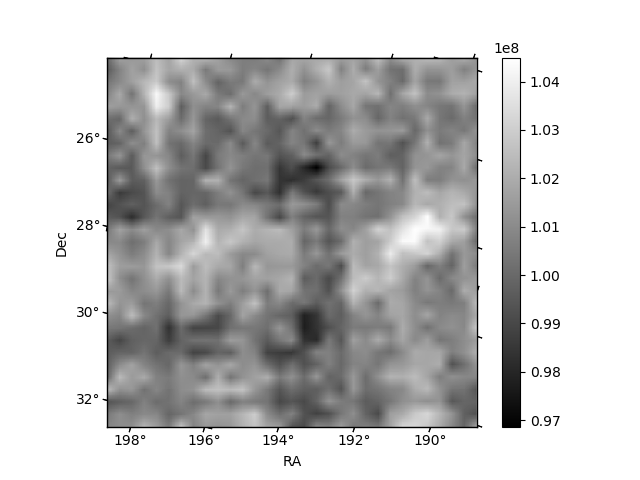
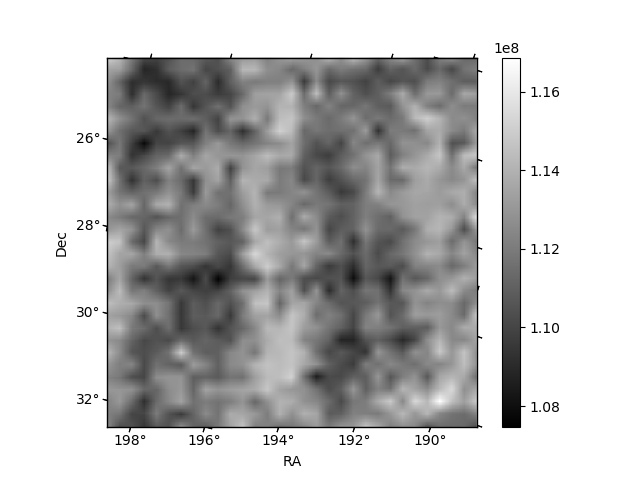
Histogram calculated using DETX and DETY for each event in the final _common_clean file
| Quadrant A | 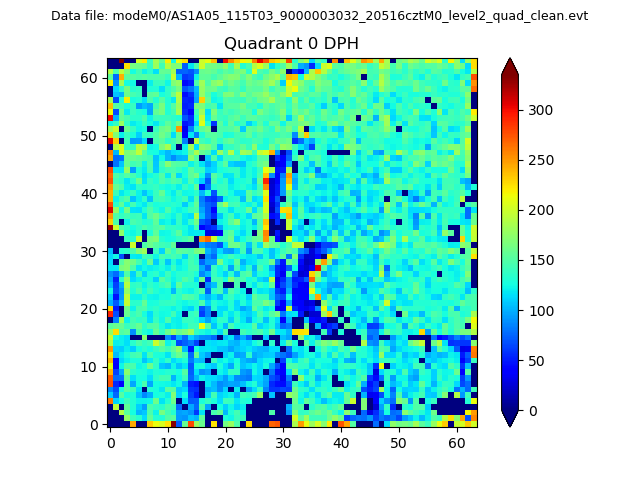 |
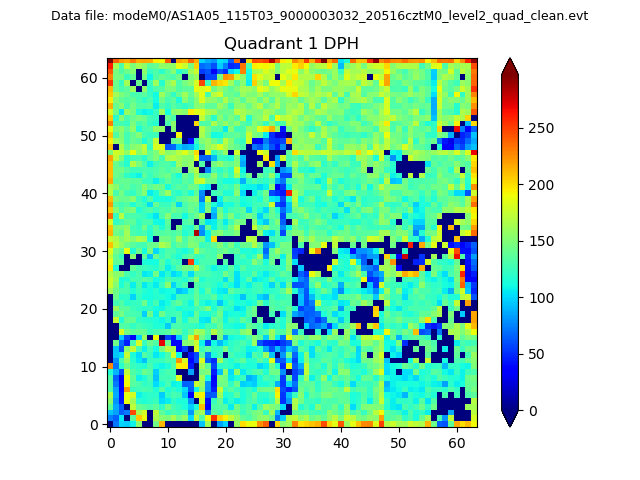 |
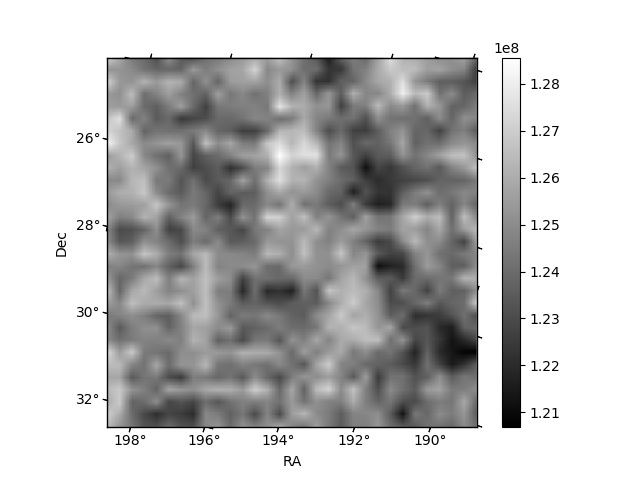
Quadrant B |
|---|---|---|---|
| Quadrant D | 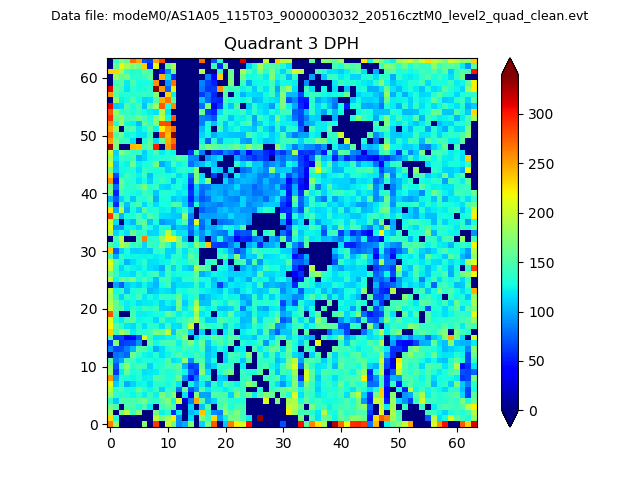 |
 |
Quadrant C |
| Plot type | Count rate plots | Images |
|---|---|---|
| Comparison with Poisson distribution Blue bars denote a histogram of data divided into 1 sec bins. Red curve is a Poisson curve with rate = median count rate of data. |
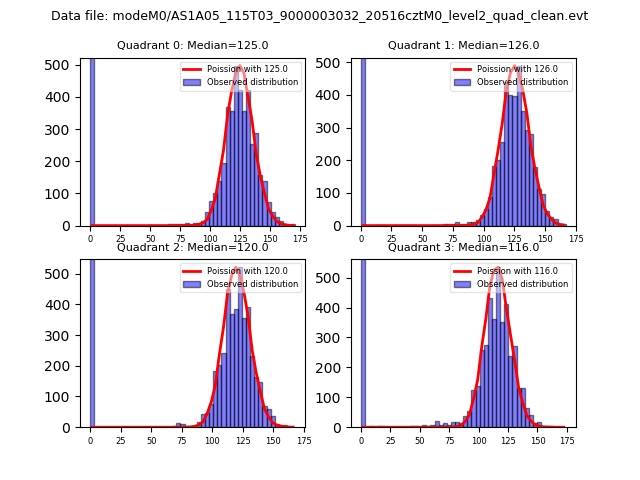 |
 |
| Quadrant-wise count rates Data is divided into 100 sec bins |
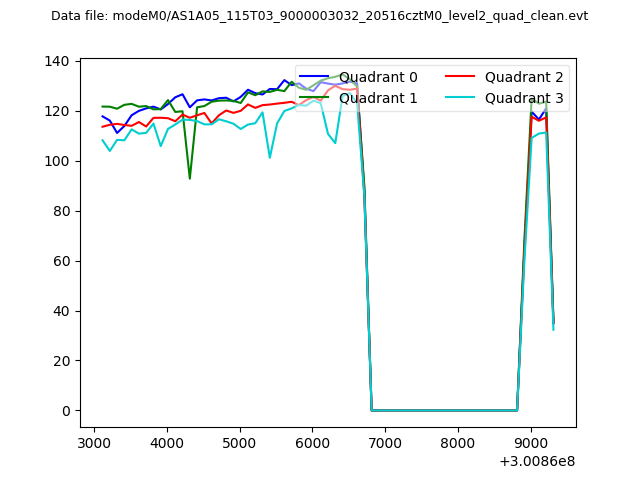 |
|
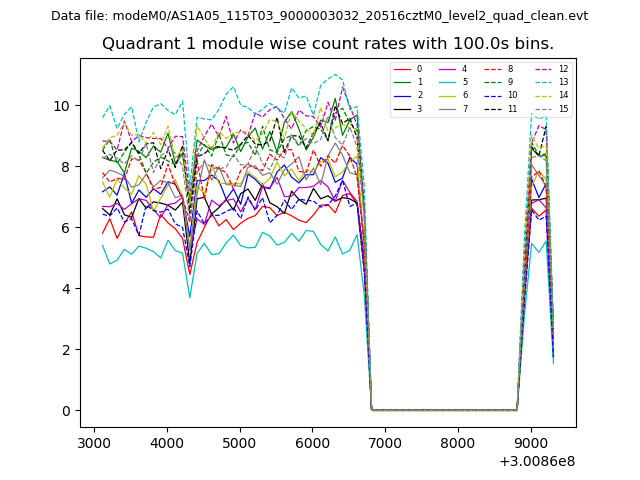
| Module-wise count rates for Quadrant A Data is divided into 100 sec bins |
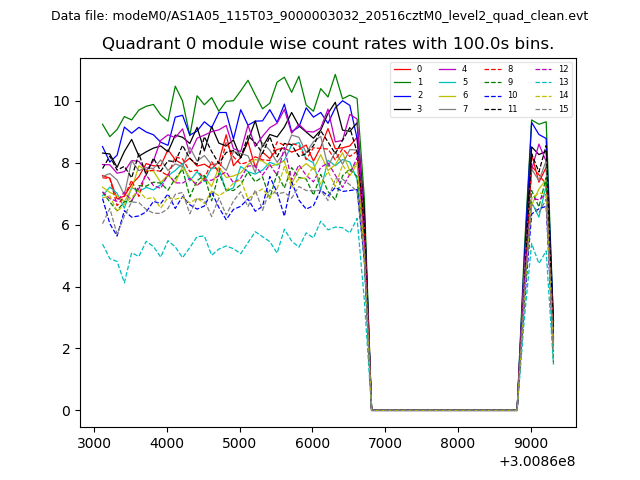 |
 |
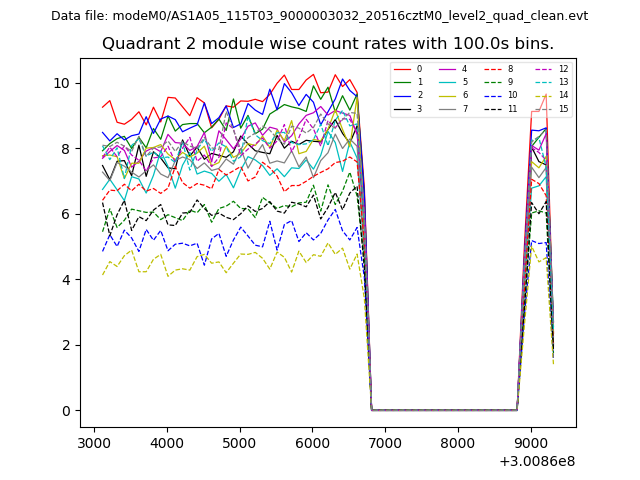
| Module-wise count rates for Quadrant B Data is divided into 100 sec bins |
 |
 |
| Module-wise count rates for Quadrant C Data is divided into 100 sec bins |
 |
 |
| Module-wise count rates for Quadrant D Data is divided into 100 sec bins |
 |
 |
| Parameter | Plot |
|---|---|
| CZT HV Monitor | 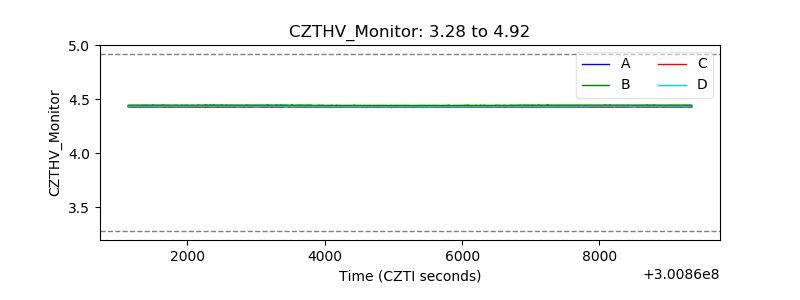 |
| D_VDD | 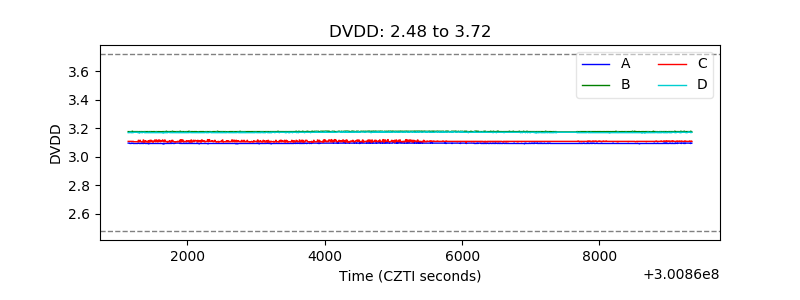 |
| Temperature 1 | 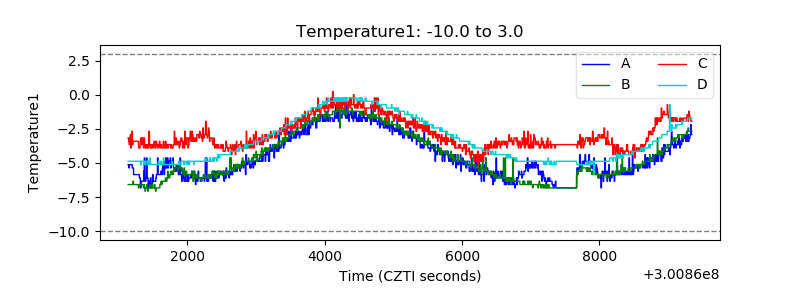 |
| Veto HV Monitor | 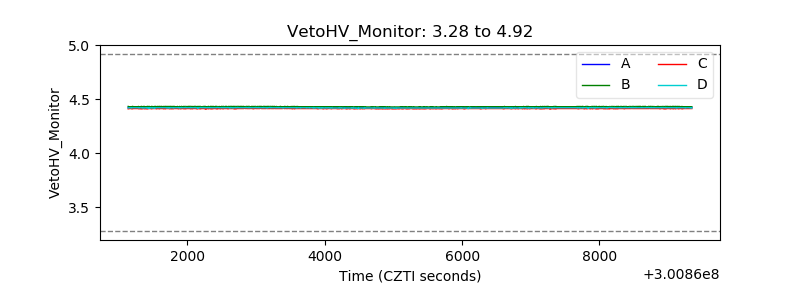 |
| Veto LLD | 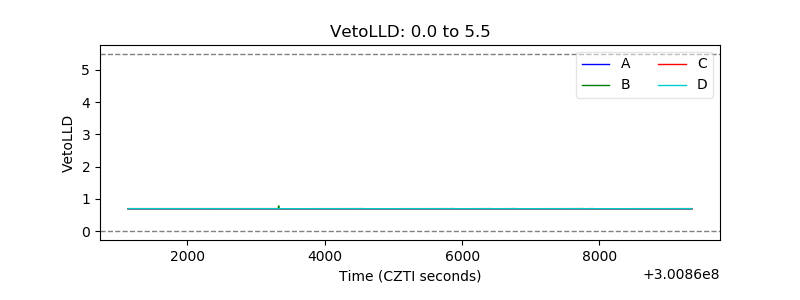 |
| Alpha Counter | 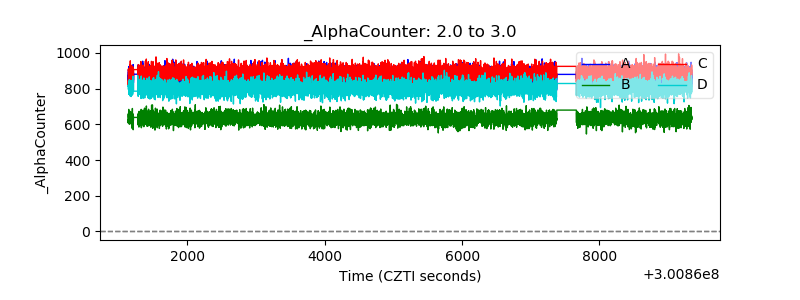 |
| _CPM_Rate | 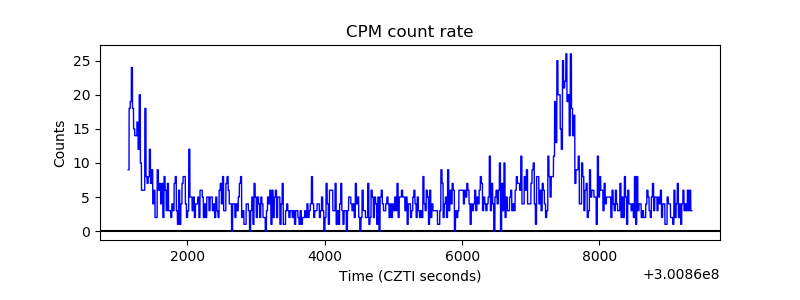 |
| CZT Counter | 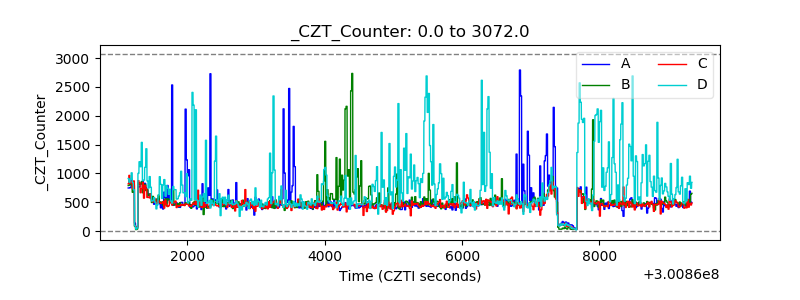 |
| +2.5 Volts monitor |  |
| +5 Volts monitor |  |
| _ROLL_ROT |  |
| _Roll_DEC | 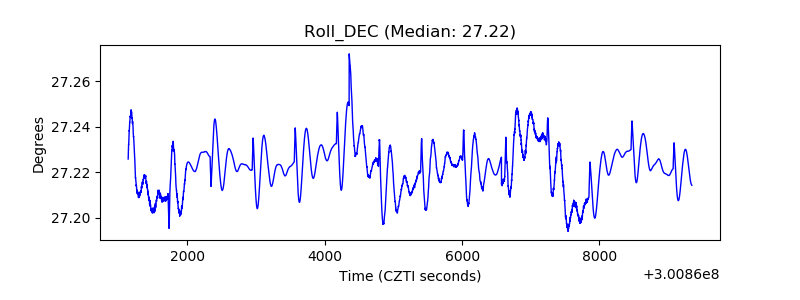 |
| _Roll_RA | 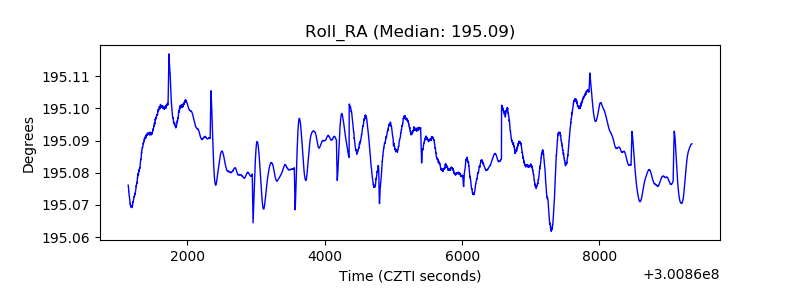 |
| Veto Counter | 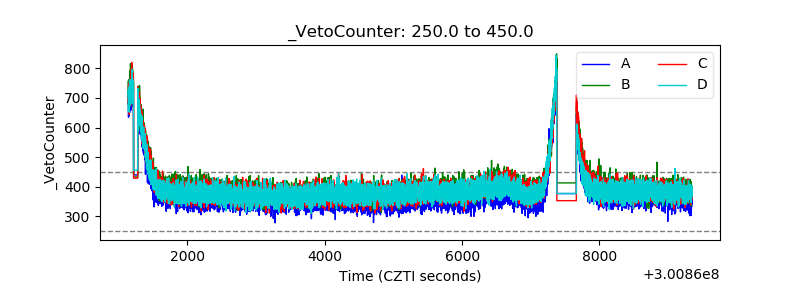 |