| Param | Original file | Final file |
|---|---|---|
| Filename | modeM0/AS1A05_115T03_9000003032_20518cztM0_level2.evt | modeM0/AS1A05_115T03_9000003032_20518cztM0_level2_quad_clean.evt |
| Size (bytes) | 1,037,514,240 | 166,230,720 |
| Size | 989.5 MB | 158.5 MB |
| Events in quadrant A | 6,457,602 | 1,065,393 |
| Events in quadrant B | 7,098,662 | 1,070,985 |
| Events in quadrant C | 6,256,608 | 1,022,633 |
| Events in quadrant D | 10,712,037 | 959,691 |
| Mode M9 | |||
|---|---|---|---|
| Quadrant | BADHDUFLAG | Total packets | Discarded packets |
| A | 0 | 15 | 0 |
| B | 0 | 15 | 0 |
| C | 0 | 15 | 0 |
| D | 0 | 15 | 0 |
| Mode M0 | |||
|---|---|---|---|
| Quadrant | BADHDUFLAG | Total packets | Discarded packets |
| A | 0 | 27832 | 2 |
| B | 0 | 29221 | 3 |
| C | 0 | 27154 | 2 |
| D | 0 | 40517 | 2 |
| Mode SS | |||
|---|---|---|---|
| Quadrant | BADHDUFLAG | Total packets | Discarded packets |
| A | 0 | 270 | 0 |
| B | 0 | 270 | 0 |
| C | 0 | 270 | 0 |
| D | 0 | 270 | 0 |
| Quadrant | Total seconds | Saturated seconds | Saturation percentage |
|---|---|---|---|
| A | 13257 | 304 | 2.293128% |
| B | 13257 | 344 | 2.594856% |
| C | 13257 | 290 | 2.187524% |
| D | 13257 | 1330 | 10.032436% |
Noise dominated data is calculated using 1-second bins in cleaned event files. If a bin has >2000 counts, and if more than 50% of those come from <1% of pixels, then it is considered to be noise-dominated and hence unusable.
| Quadrant | # 1 sec bins | Bins with >0 counts | Bins with >2000 counts | High rate bins dominated by noise | Noise dominated (total time) | Noise dominated (detector-on time) | Marked lightcurve |
|---|---|---|---|---|---|---|---|
| A | 14697 | 13257 | 28 | 28 | 0.19% | 0.21% | 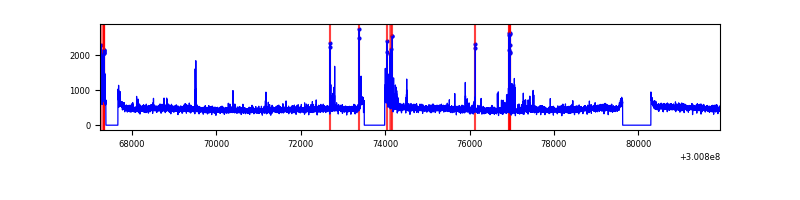 |
| B | 14697 | 13257 | 50 | 50 | 0.34% | 0.38% | 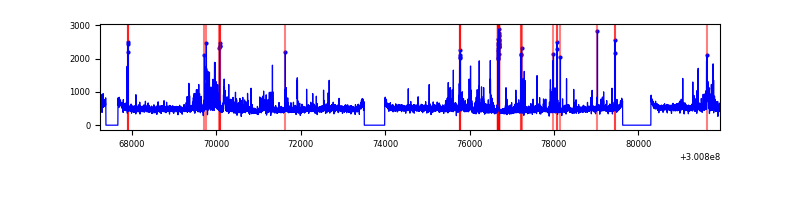 |
| C | 14697 | 13257 | 2 | 2 | 0.01% | 0.02% | 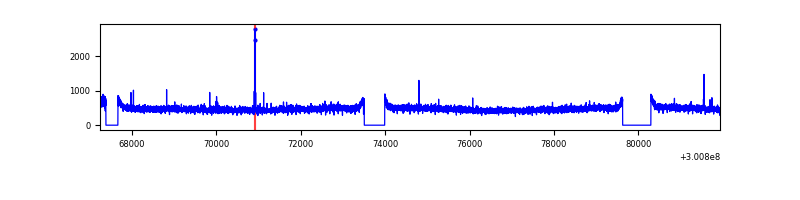 |
| D | 14697 | 13257 | 1007 | 1007 | 6.85% | 7.60% | 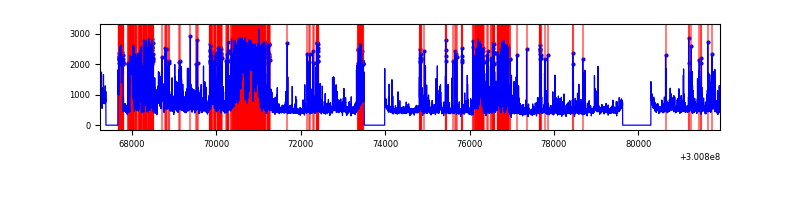 |
Top three noisy pixels from each quadrant. If the there are fewer than three noisy pixels in the level2.evt file, extra rows are filled as -1
| Pixel properties | Quadrant properties | ||||||
|---|---|---|---|---|---|---|---|
| Quadrant | DetID | PixID | Counts | Sigma | Mean | Median | Sigma |
| A | 5 | 16 | 226326 | 695.79 | 1595 | 1555 | 323.0 |
| A | 12 | 96 | 70563 | 213.62 | 1595 | 1555 | 323.0 |
| A | 11 | 29 | 15331 | 42.64 | 1595 | 1555 | 323.0 |
| B | 0 | 189 | 296946 | 977.91 | 1591 | 1552 | 302.1 |
| B | 0 | 197 | 142948 | 468.09 | 1591 | 1552 | 302.1 |
| B | 10 | 246 | 126845 | 414.78 | 1591 | 1552 | 302.1 |
| C | 14 | 238 | 235712 | 654.85 | 1529 | 1536 | 357.6 |
| C | 0 | 207 | 16226 | 41.08 | 1529 | 1536 | 357.6 |
| C | 8 | 128 | 11344 | 27.43 | 1529 | 1536 | 357.6 |
| D | 5 | 222 | 3565327 | 9737.56 | 1496 | 1452 | 366.0 |
| D | 13 | 153 | 575548 | 1568.6 | 1496 | 1452 | 366.0 |
| D | 7 | 238 | 223610 | 607.0 | 1496 | 1452 | 366.0 |
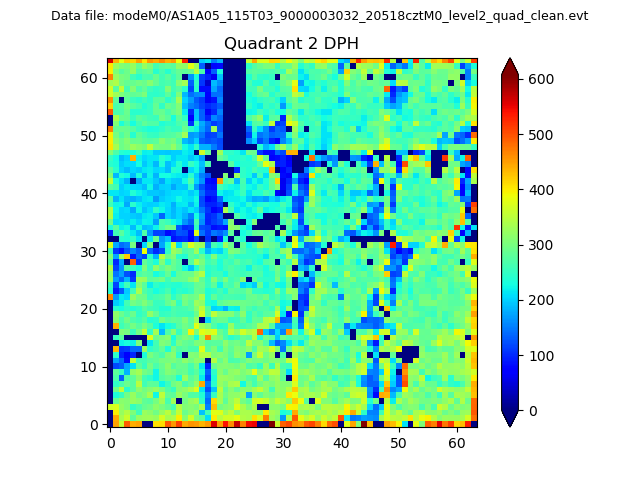
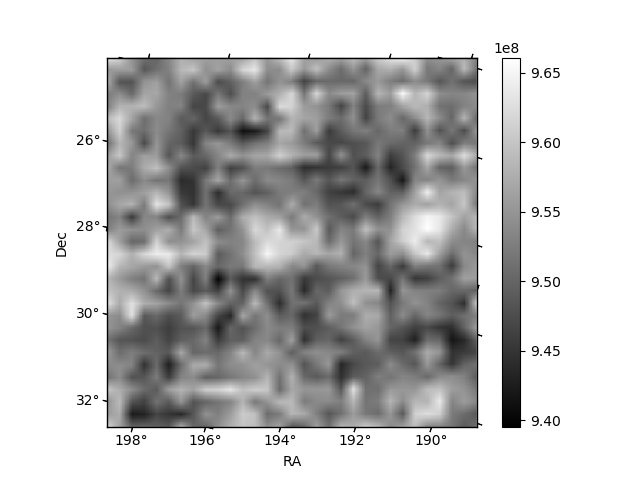
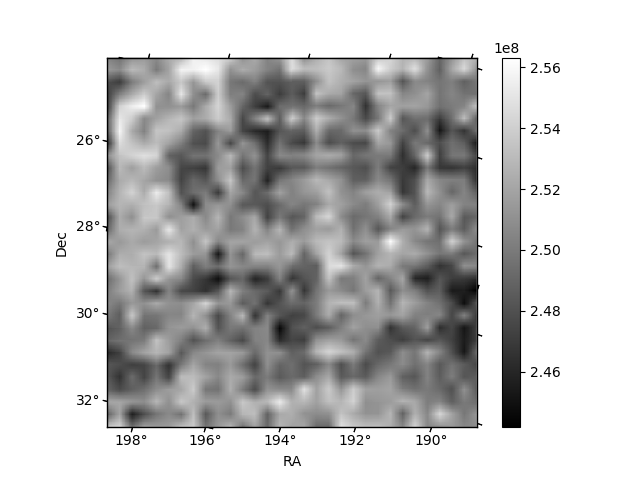
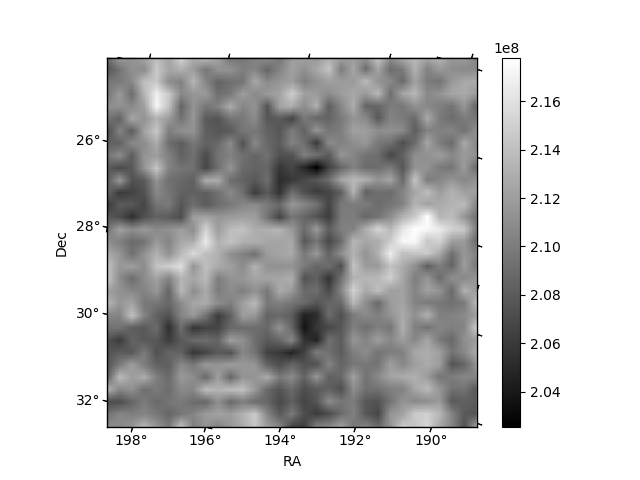
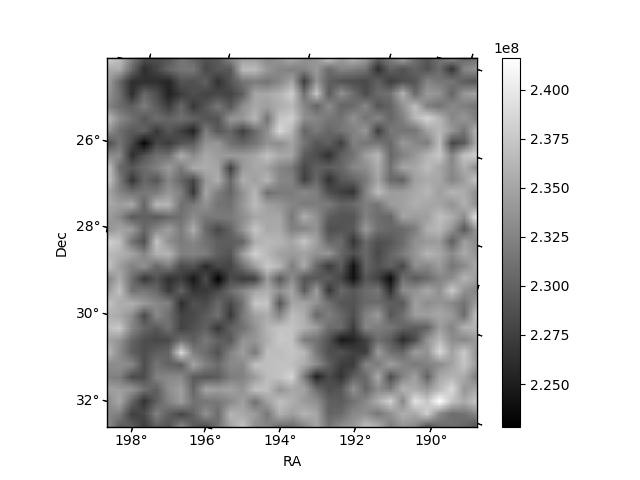
Histogram calculated using DETX and DETY for each event in the final _common_clean file
| Quadrant A | 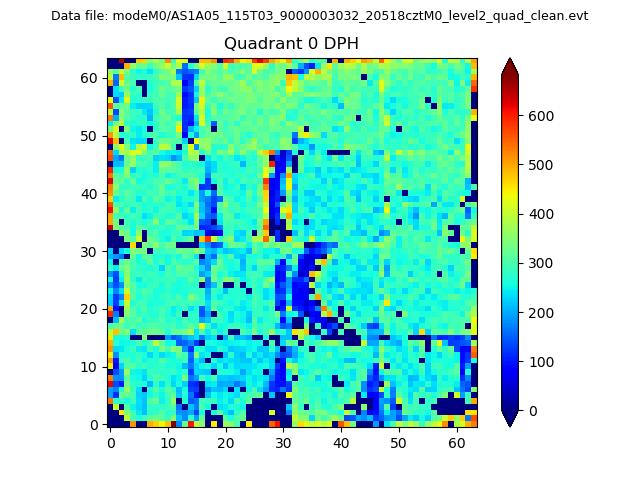 |
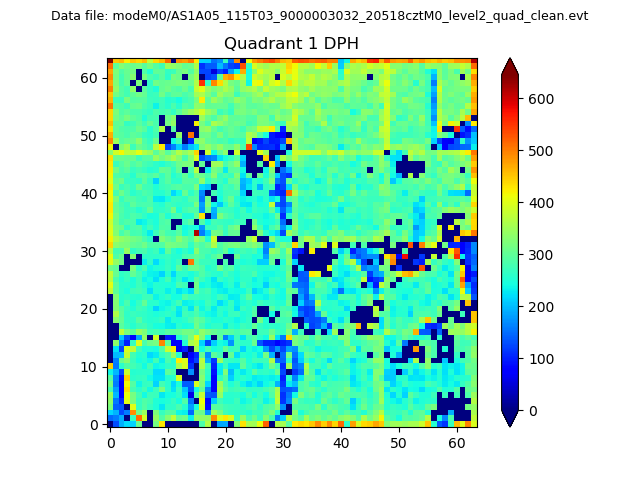 |
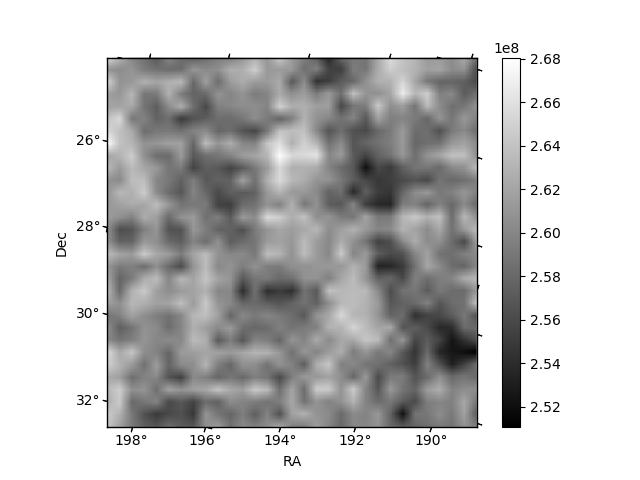
Quadrant B |
|---|---|---|---|
| Quadrant D | 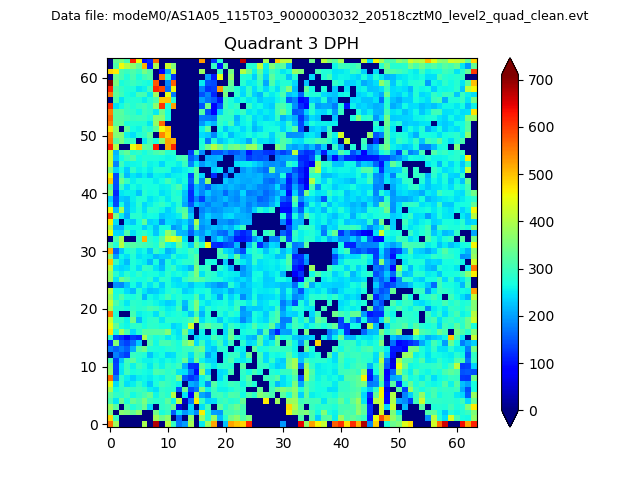 |
 |
Quadrant C |
| Plot type | Count rate plots | Images |
|---|---|---|
| Comparison with Poisson distribution Blue bars denote a histogram of data divided into 1 sec bins. Red curve is a Poisson curve with rate = median count rate of data. |
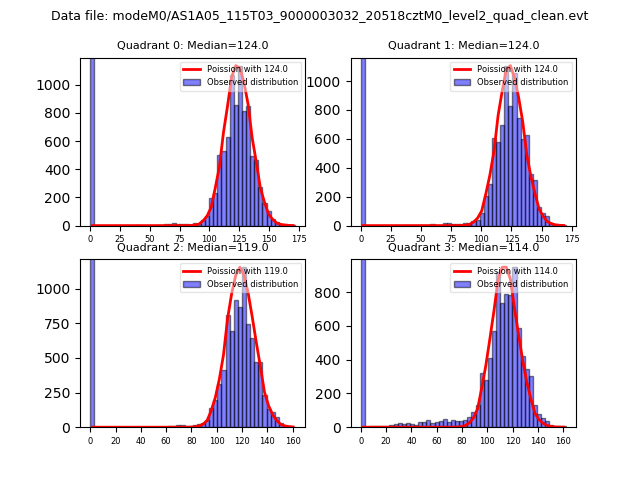 |
 |
| Quadrant-wise count rates Data is divided into 100 sec bins |
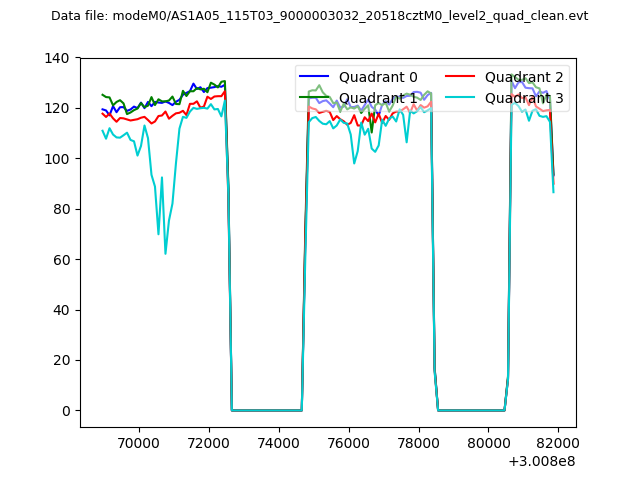 |
|
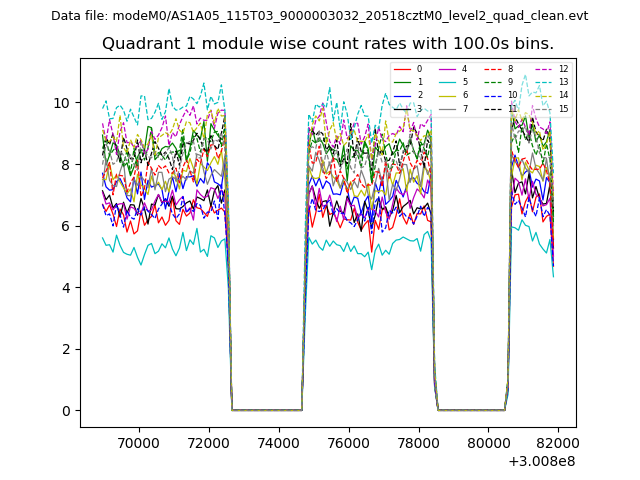
| Module-wise count rates for Quadrant A Data is divided into 100 sec bins |
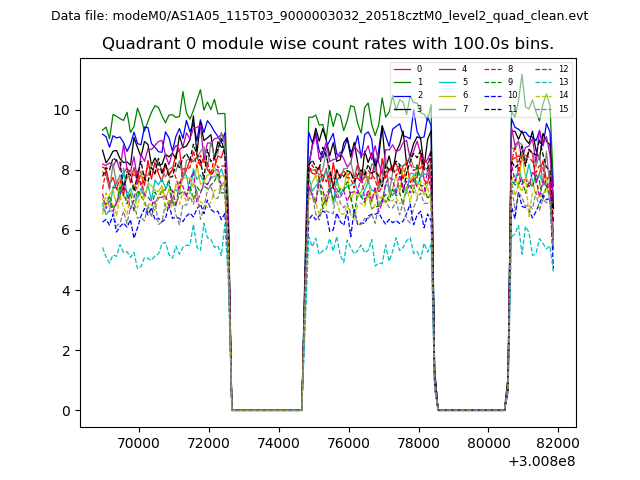 |
 |
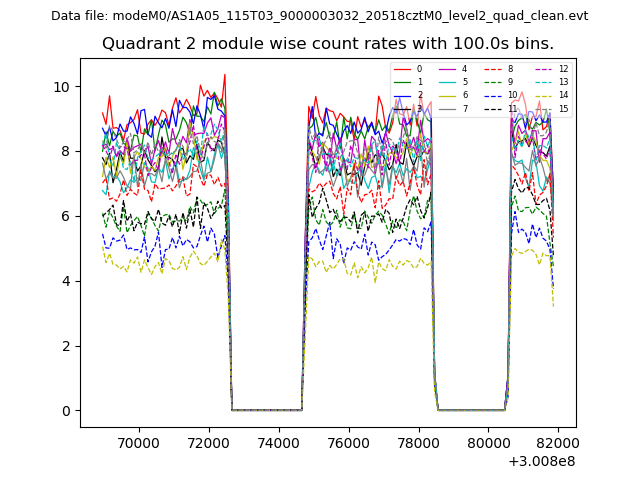
| Module-wise count rates for Quadrant B Data is divided into 100 sec bins |
 |
 |
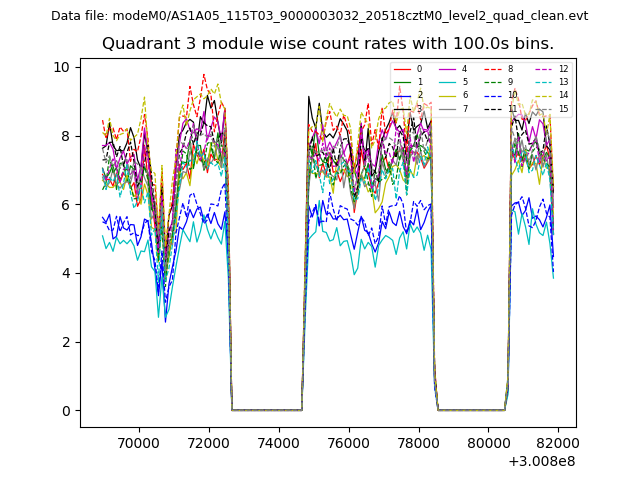
| Module-wise count rates for Quadrant C Data is divided into 100 sec bins |
 |
 |
| Module-wise count rates for Quadrant D Data is divided into 100 sec bins |
 |
 |
| Parameter | Plot |
|---|---|
| CZT HV Monitor | 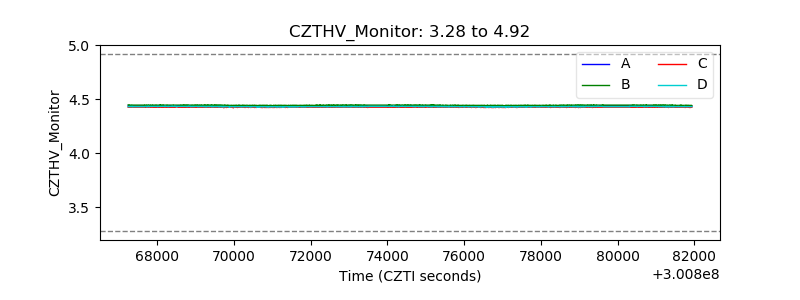 |
| D_VDD | 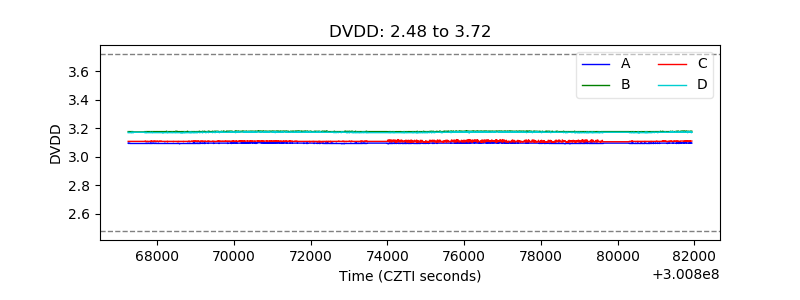 |
| Temperature 1 | 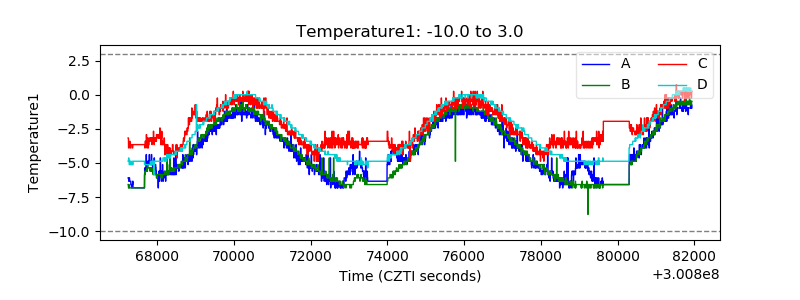 |
| Veto HV Monitor | 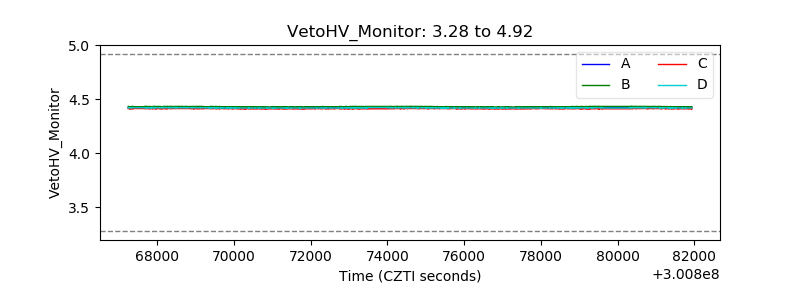 |
| Veto LLD | 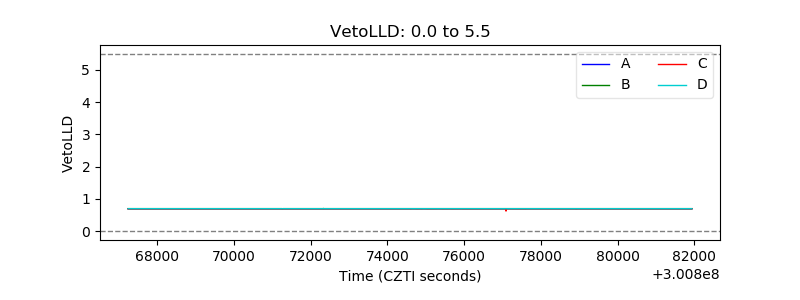 |
| Alpha Counter | 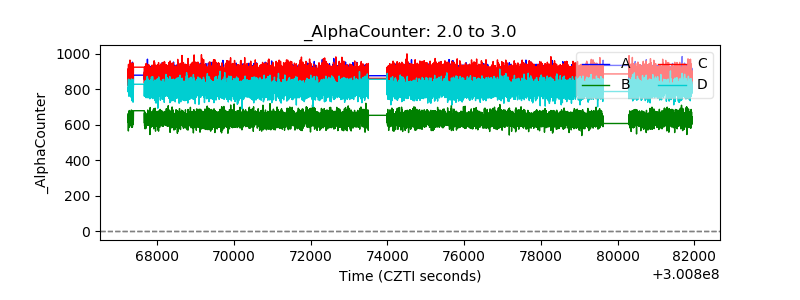 |
| _CPM_Rate | 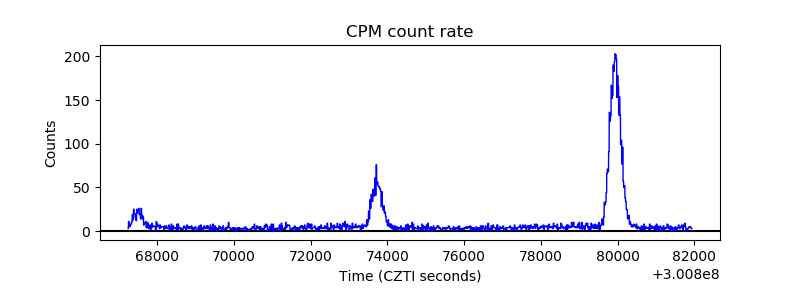 |
| CZT Counter | 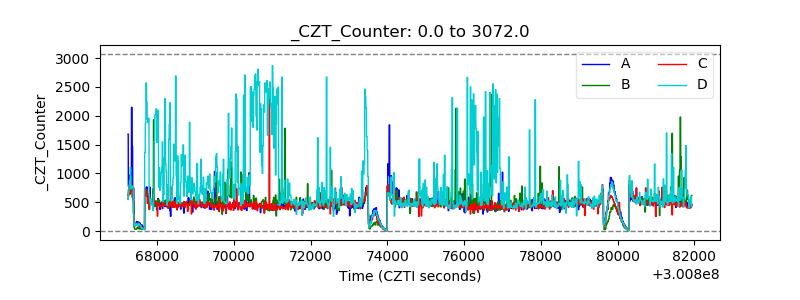 |
| +2.5 Volts monitor |  |
| +5 Volts monitor |  |
| _ROLL_ROT | 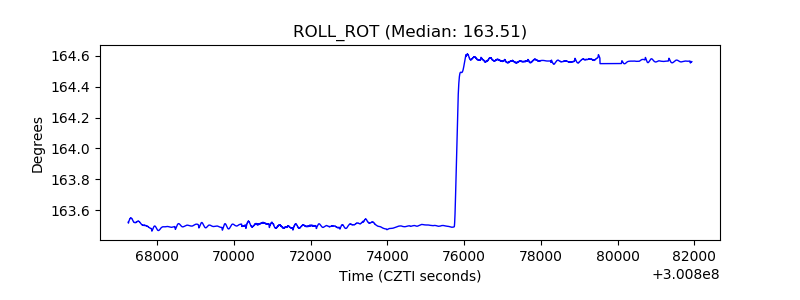 |
| _Roll_DEC | 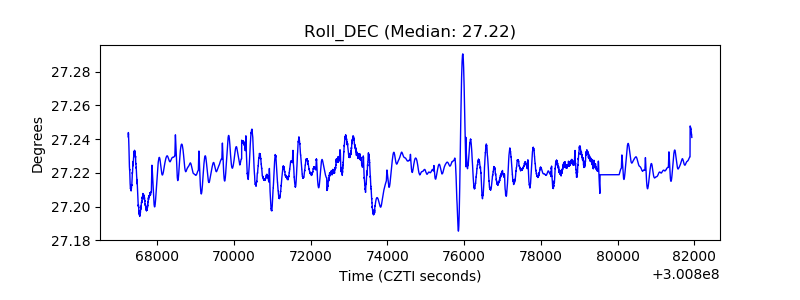 |
| _Roll_RA | 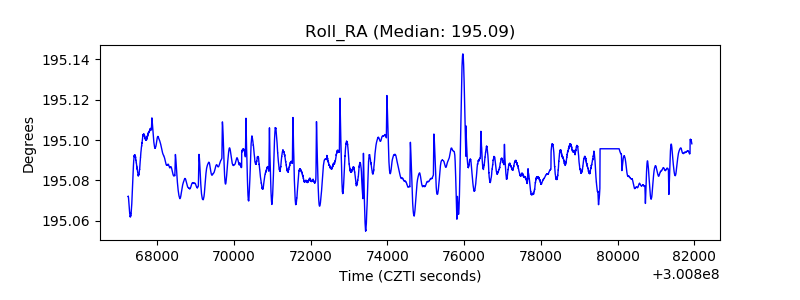 |
| Veto Counter | 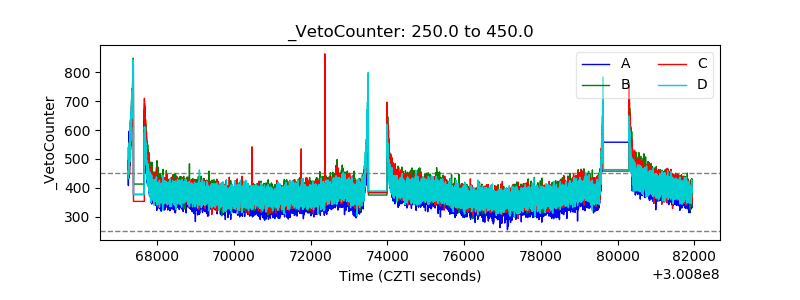 |