| Param | Original file | Final file |
|---|---|---|
| Filename | modeM0/AS1A05_115T03_9000003032_20519cztM0_level2.evt | modeM0/AS1A05_115T03_9000003032_20519cztM0_level2_quad_clean.evt |
| Size (bytes) | 461,162,880 | 94,455,360 |
| Size | 439.8 MB | 90.1 MB |
| Events in quadrant A | 3,109,070 | 622,199 |
| Events in quadrant B | 3,534,974 | 621,482 |
| Events in quadrant C | 2,978,453 | 594,572 |
| Events in quadrant D | 3,913,166 | 579,838 |
| Mode M9 | |||
|---|---|---|---|
| Quadrant | BADHDUFLAG | Total packets | Discarded packets |
| A | 0 | 9 | 0 |
| B | 0 | 9 | 0 |
| C | 0 | 9 | 0 |
| D | 0 | 9 | 0 |
| Mode M0 | |||
|---|---|---|---|
| Quadrant | BADHDUFLAG | Total packets | Discarded packets |
| A | 0 | 13409 | 1 |
| B | 0 | 14579 | 2 |
| C | 0 | 12946 | 1 |
| D | 0 | 15806 | 1 |
| Mode SS | |||
|---|---|---|---|
| Quadrant | BADHDUFLAG | Total packets | Discarded packets |
| A | 0 | 128 | 0 |
| B | 0 | 128 | 0 |
| C | 0 | 128 | 0 |
| D | 0 | 128 | 0 |
| Quadrant | Total seconds | Saturated seconds | Saturation percentage |
|---|---|---|---|
| A | 6343 | 101 | 1.592306% |
| B | 6343 | 79 | 1.245467% |
| C | 6343 | 63 | 0.993221% |
| D | 6343 | 135 | 2.128330% |
Noise dominated data is calculated using 1-second bins in cleaned event files. If a bin has >2000 counts, and if more than 50% of those come from <1% of pixels, then it is considered to be noise-dominated and hence unusable.
| Quadrant | # 1 sec bins | Bins with >0 counts | Bins with >2000 counts | High rate bins dominated by noise | Noise dominated (total time) | Noise dominated (detector-on time) | Marked lightcurve |
|---|---|---|---|---|---|---|---|
| A | 7188 | 6343 | 44 | 44 | 0.61% | 0.69% | 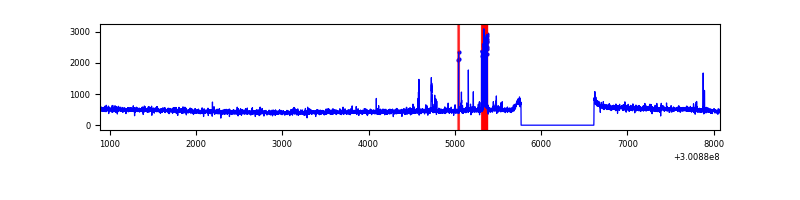 |
| B | 7188 | 6343 | 13 | 13 | 0.18% | 0.20% | 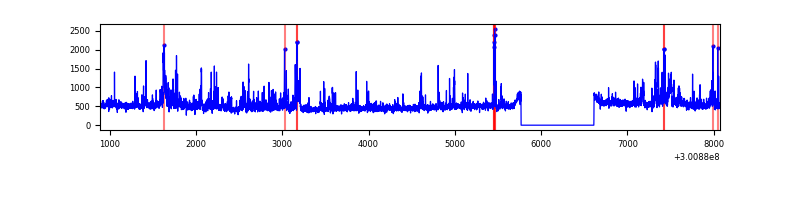 |
| C | 7187 | 6342 | 0 | 0 | 0.00% | 0.00% | 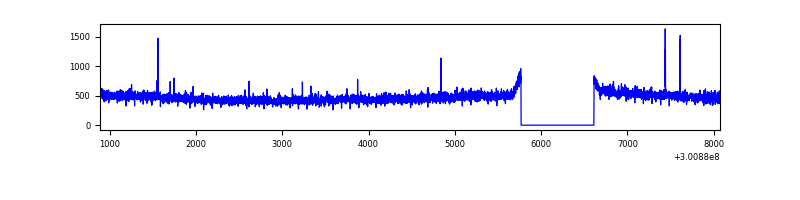 |
| D | 7188 | 6343 | 82 | 82 | 1.14% | 1.29% |  |
Top three noisy pixels from each quadrant. If the there are fewer than three noisy pixels in the level2.evt file, extra rows are filled as -1
| Pixel properties | Quadrant properties | ||||||
|---|---|---|---|---|---|---|---|
| Quadrant | DetID | PixID | Counts | Sigma | Mean | Median | Sigma |
| A | 5 | 16 | 105268 | 674.29 | 762 | 743 | 155.0 |
| A | 12 | 96 | 53412 | 339.77 | 762 | 743 | 155.0 |
| A | 8 | 205 | 9322 | 55.34 | 762 | 743 | 155.0 |
| B | 0 | 189 | 251435 | 1716.03 | 758 | 737 | 146.1 |
| B | 0 | 197 | 110593 | 751.96 | 758 | 737 | 146.1 |
| B | 10 | 246 | 75448 | 511.39 | 758 | 737 | 146.1 |
| C | 14 | 238 | 112208 | 647.98 | 730 | 734 | 172.0 |
| C | 0 | 207 | 13510 | 74.26 | 730 | 734 | 172.0 |
| C | 13 | 61 | 5282 | 26.44 | 730 | 734 | 172.0 |
| D | 5 | 222 | 235632 | 1304.23 | 741 | 719 | 180.1 |
| D | 7 | 238 | 199984 | 1106.31 | 741 | 719 | 180.1 |
| D | 13 | 153 | 176611 | 976.55 | 741 | 719 | 180.1 |
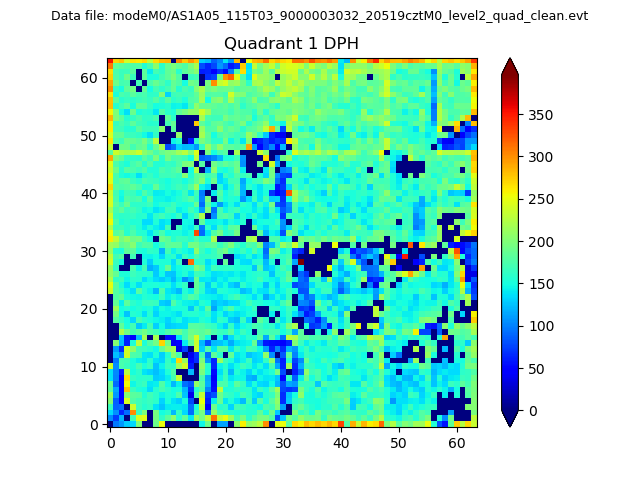
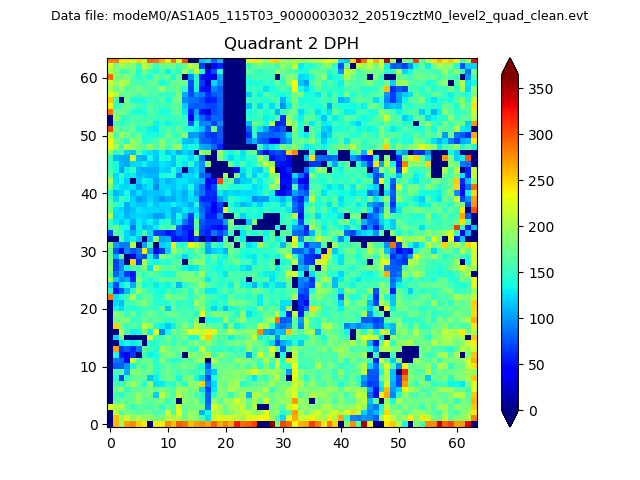
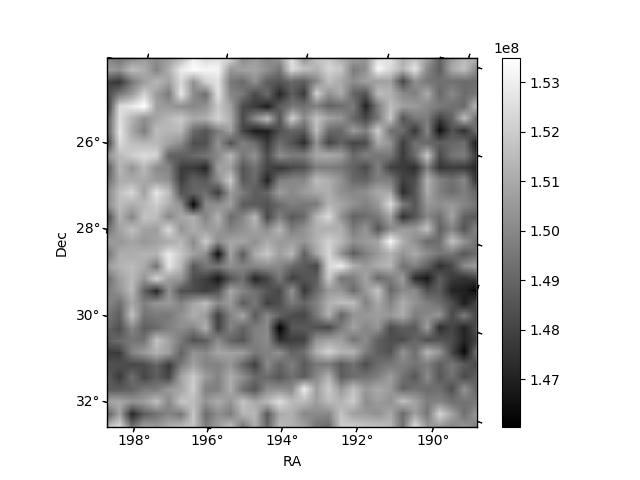
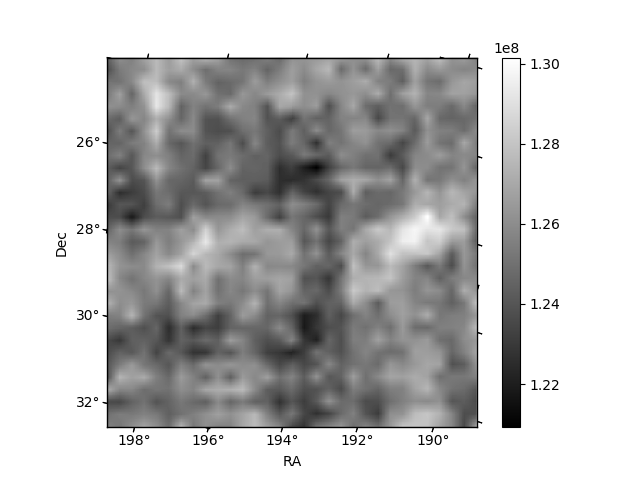
Histogram calculated using DETX and DETY for each event in the final _common_clean file
| Quadrant A | 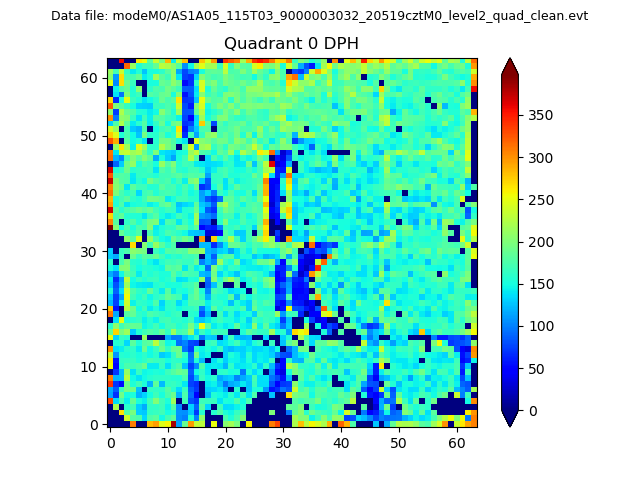 |
 |
Quadrant B |
|---|---|---|---|
| Quadrant D |  |
 |
Quadrant C |
| Plot type | Count rate plots | Images |
|---|---|---|
| Comparison with Poisson distribution Blue bars denote a histogram of data divided into 1 sec bins. Red curve is a Poisson curve with rate = median count rate of data. |
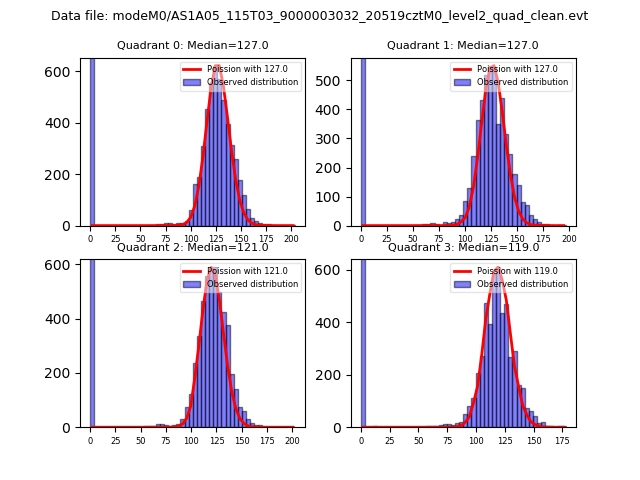 |
 |
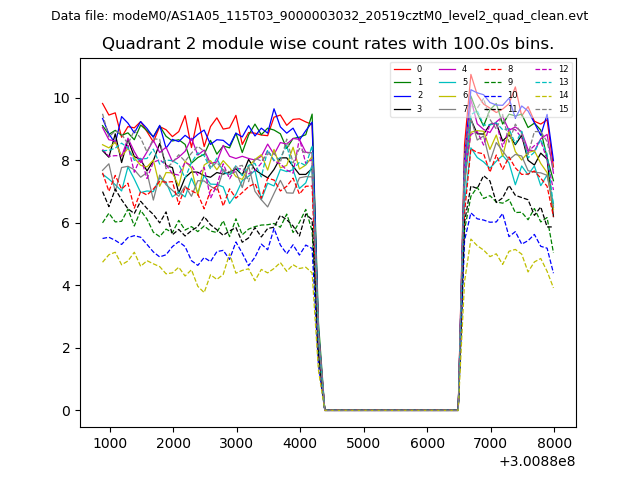
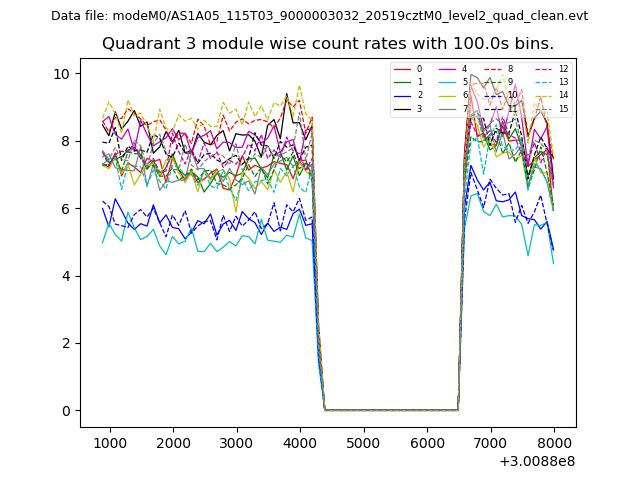
| Quadrant-wise count rates Data is divided into 100 sec bins |
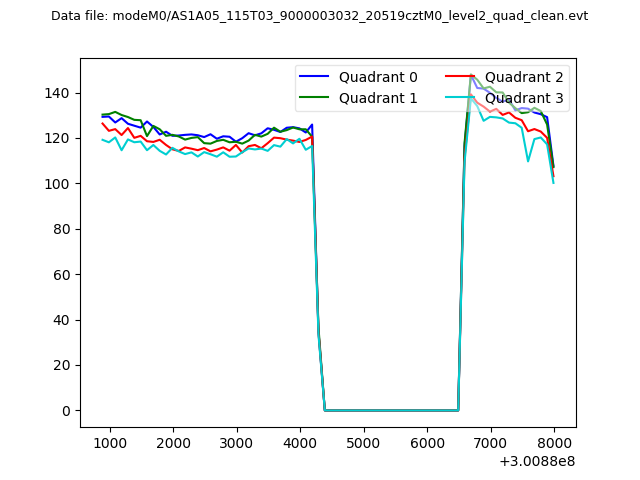 |
|
| Module-wise count rates for Quadrant A Data is divided into 100 sec bins |
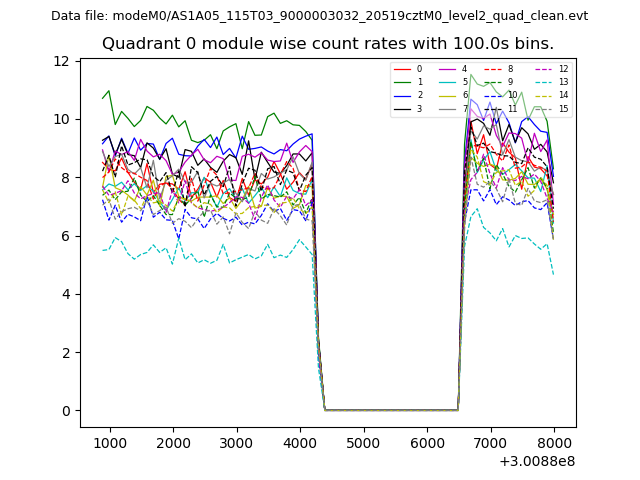 |
 |
| Module-wise count rates for Quadrant B Data is divided into 100 sec bins |
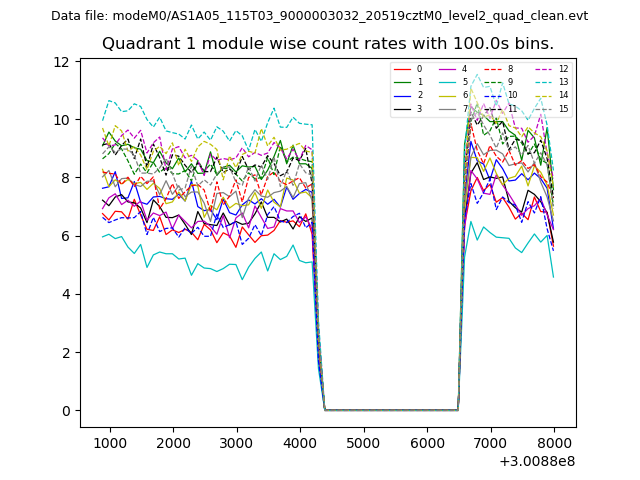 |
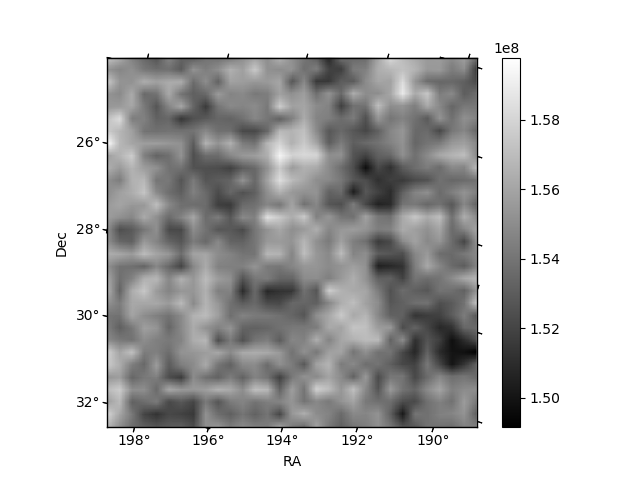 |
| Module-wise count rates for Quadrant C Data is divided into 100 sec bins |
 |
 |
| Module-wise count rates for Quadrant D Data is divided into 100 sec bins |
 |
 |
| Parameter | Plot |
|---|---|
| CZT HV Monitor | 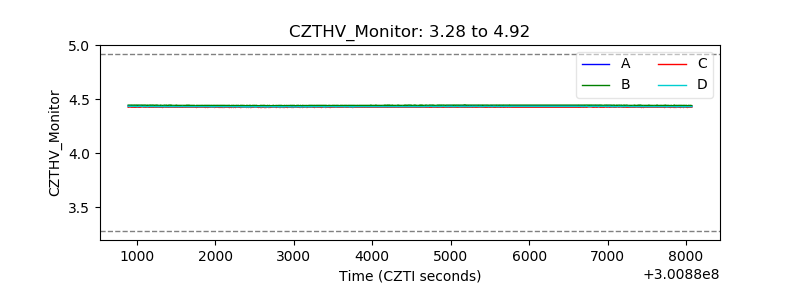 |
| D_VDD | 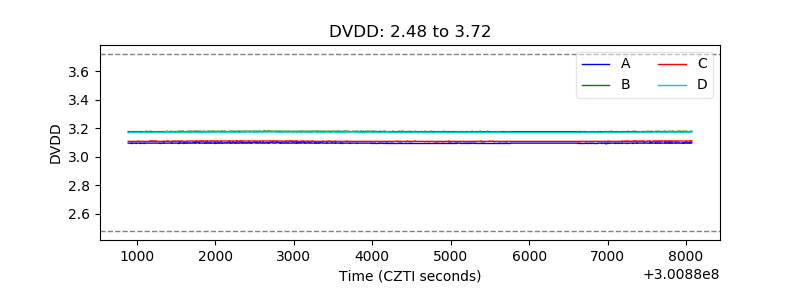 |
| Temperature 1 |  |
| Veto HV Monitor | 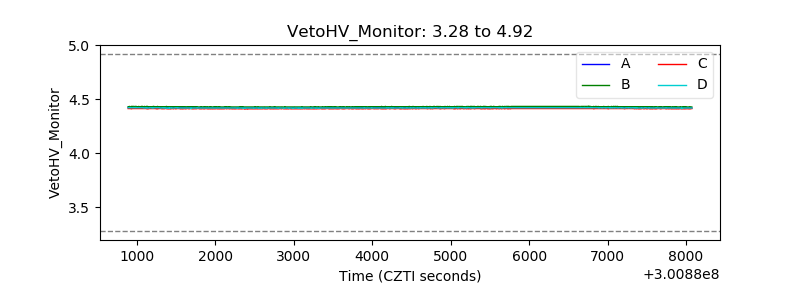 |
| Veto LLD |  |
| Alpha Counter | 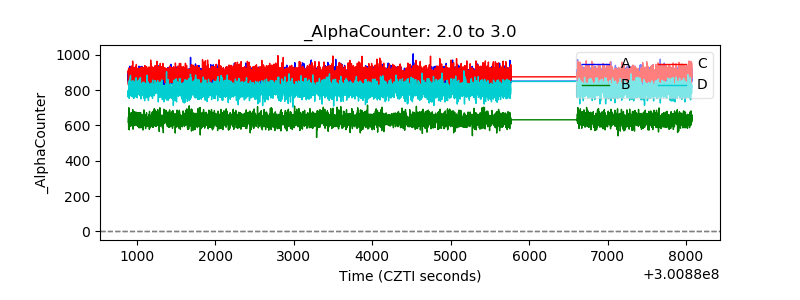 |
| _CPM_Rate | 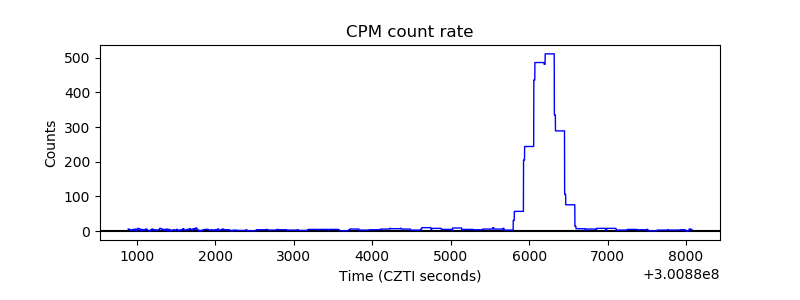 |
| CZT Counter | 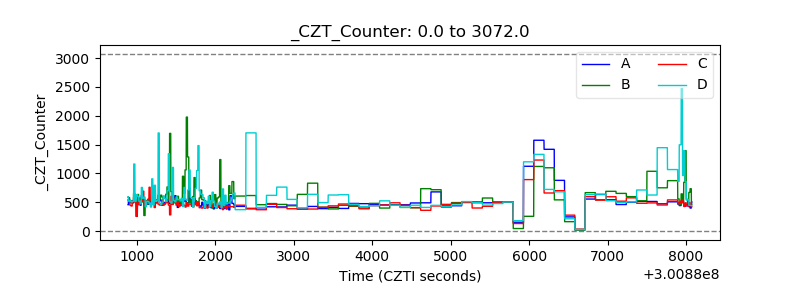 |
| +2.5 Volts monitor |  |
| +5 Volts monitor |  |
| _ROLL_ROT | 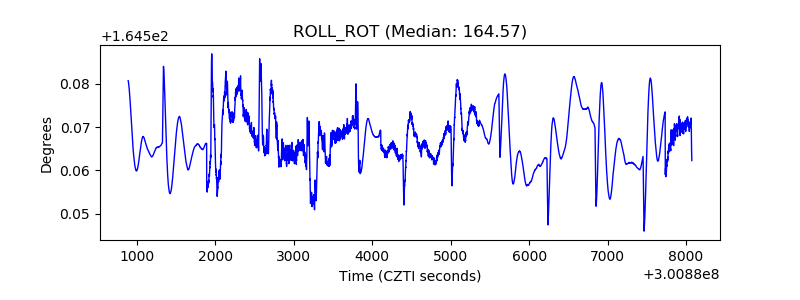 |
| _Roll_DEC | 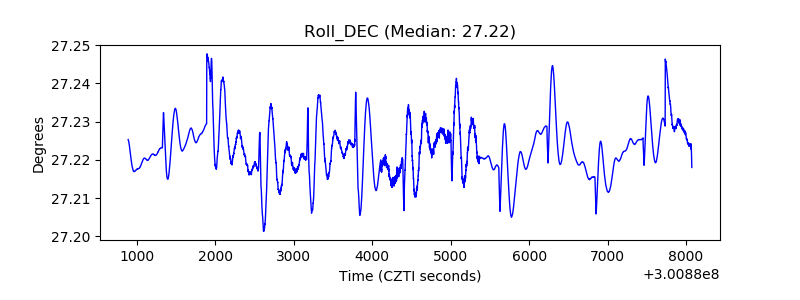 |
| _Roll_RA | 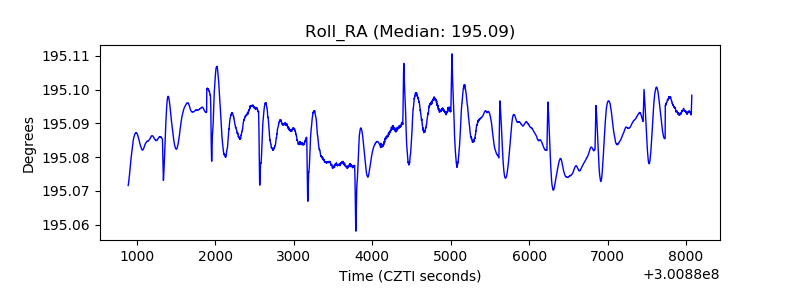 |
| Veto Counter | 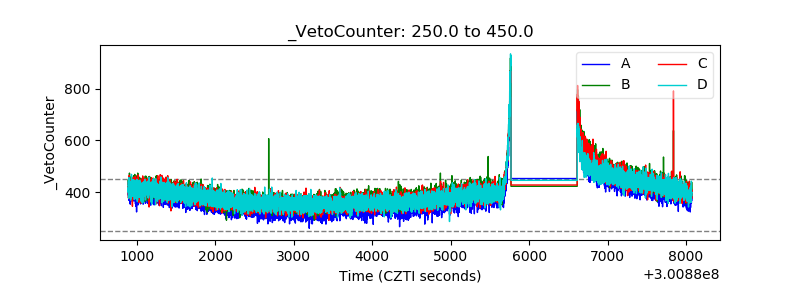 |