| Param | Original file | Final file |
|---|---|---|
| Filename | modeM0/AS1A05_115T03_9000003032_20520cztM0_level2.evt | modeM0/AS1A05_115T03_9000003032_20520cztM0_level2_quad_clean.evt |
| Size (bytes) | 474,206,400 | 90,037,440 |
| Size | 452.2 MB | 85.9 MB |
| Events in quadrant A | 2,950,016 | 594,743 |
| Events in quadrant B | 3,612,675 | 591,482 |
| Events in quadrant C | 2,928,193 | 567,770 |
| Events in quadrant D | 4,450,403 | 540,726 |
| Mode M9 | |||
|---|---|---|---|
| Quadrant | BADHDUFLAG | Total packets | Discarded packets |
| A | 0 | 11 | 0 |
| B | 0 | 11 | 0 |
| C | 0 | 11 | 0 |
| D | 0 | 11 | 0 |
| Mode M0 | |||
|---|---|---|---|
| Quadrant | BADHDUFLAG | Total packets | Discarded packets |
| A | 0 | 12895 | 0 |
| B | 0 | 14938 | 0 |
| C | 0 | 12755 | 0 |
| D | 0 | 17431 | 0 |
| Mode SS | |||
|---|---|---|---|
| Quadrant | BADHDUFLAG | Total packets | Discarded packets |
| A | 0 | 124 | 0 |
| B | 0 | 124 | 0 |
| C | 0 | 124 | 0 |
| D | 0 | 124 | 0 |
| Quadrant | Total seconds | Saturated seconds | Saturation percentage |
|---|---|---|---|
| A | 6193 | 38 | 0.613596% |
| B | 6194 | 85 | 1.372296% |
| C | 6194 | 64 | 1.033258% |
| D | 6194 | 249 | 4.020019% |
Noise dominated data is calculated using 1-second bins in cleaned event files. If a bin has >2000 counts, and if more than 50% of those come from <1% of pixels, then it is considered to be noise-dominated and hence unusable.
| Quadrant | # 1 sec bins | Bins with >0 counts | Bins with >2000 counts | High rate bins dominated by noise | Noise dominated (total time) | Noise dominated (detector-on time) | Marked lightcurve |
|---|---|---|---|---|---|---|---|
| A | 7198 | 6193 | 6 | 6 | 0.08% | 0.10% | 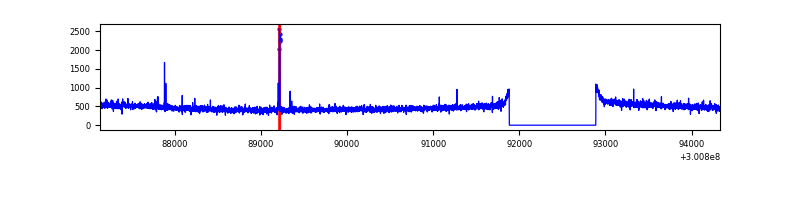 |
| B | 7199 | 6194 | 18 | 18 | 0.25% | 0.29% | 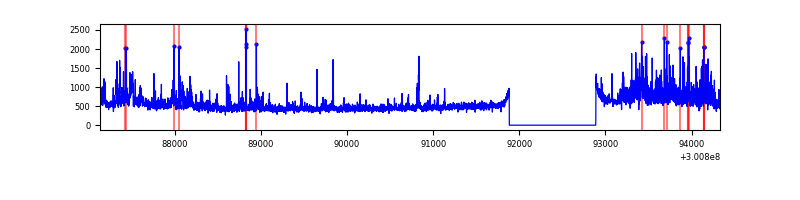 |
| C | 7199 | 6194 | 0 | 0 | 0.00% | 0.00% | 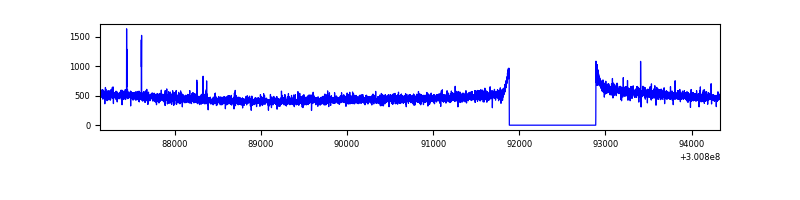 |
| D | 7199 | 6194 | 181 | 181 | 2.51% | 2.92% | 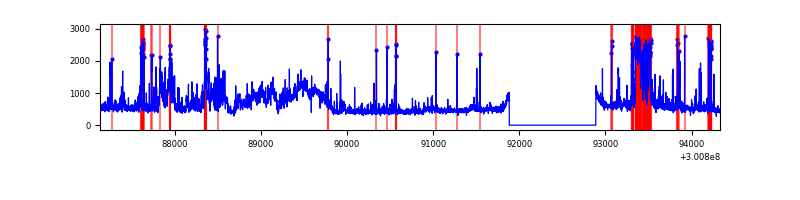 |
Top three noisy pixels from each quadrant. If the there are fewer than three noisy pixels in the level2.evt file, extra rows are filled as -1
| Pixel properties | Quadrant properties | ||||||
|---|---|---|---|---|---|---|---|
| Quadrant | DetID | PixID | Counts | Sigma | Mean | Median | Sigma |
| A | 12 | 96 | 29546 | 188.27 | 753 | 736 | 153.0 |
| A | 11 | 29 | 18588 | 116.66 | 753 | 736 | 153.0 |
| A | 0 | 226 | 6341 | 36.63 | 753 | 736 | 153.0 |
| B | 7 | 220 | 219611 | 1535.64 | 746 | 727 | 142.5 |
| B | 0 | 189 | 193681 | 1353.72 | 746 | 727 | 142.5 |
| B | 0 | 197 | 97372 | 678.04 | 746 | 727 | 142.5 |
| C | 14 | 238 | 111896 | 660.31 | 718 | 724 | 168.4 |
| C | 0 | 207 | 10897 | 60.42 | 718 | 724 | 168.4 |
| C | 13 | 61 | 5037 | 25.62 | 718 | 724 | 168.4 |
| D | 7 | 38 | 773247 | 4312.46 | 726 | 703 | 179.1 |
| D | 7 | 238 | 322210 | 1794.7 | 726 | 703 | 179.1 |
| D | 13 | 153 | 168427 | 936.26 | 726 | 703 | 179.1 |
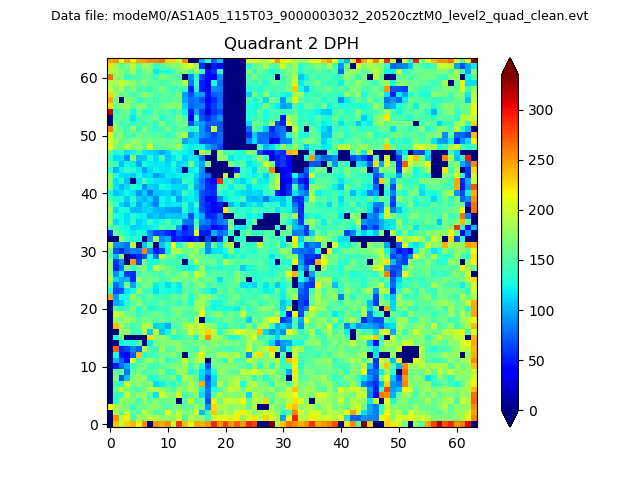
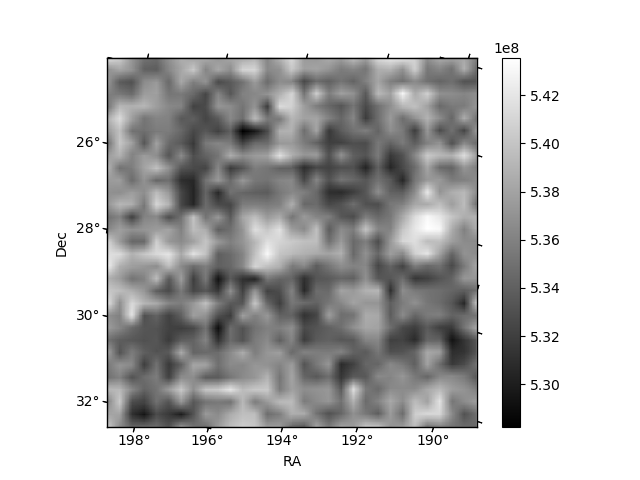
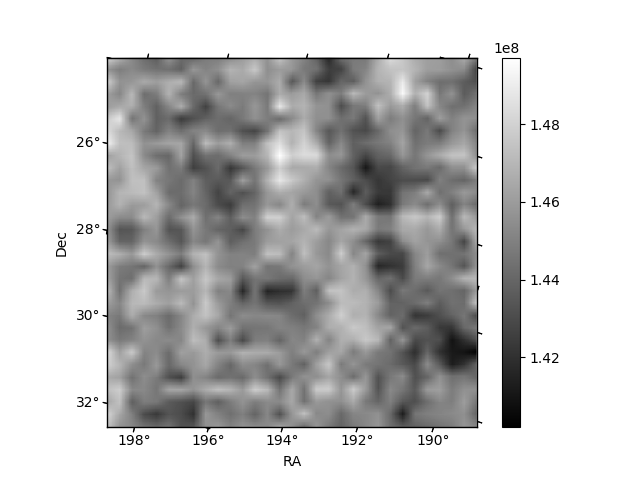
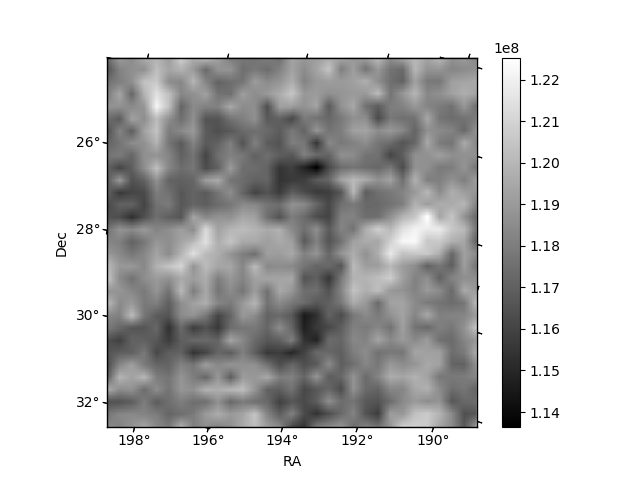
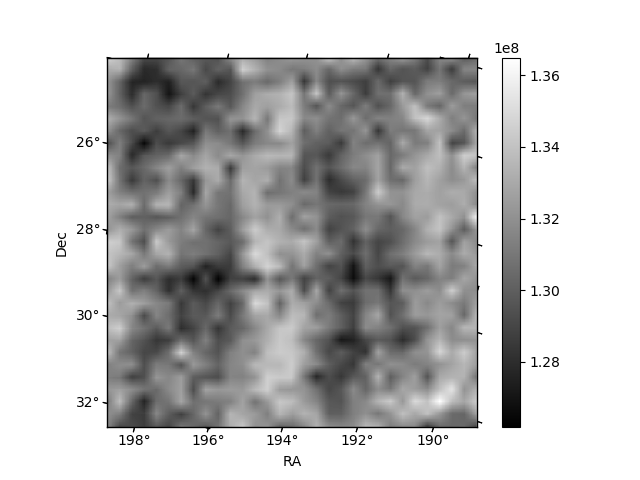
Histogram calculated using DETX and DETY for each event in the final _common_clean file
| Quadrant A | 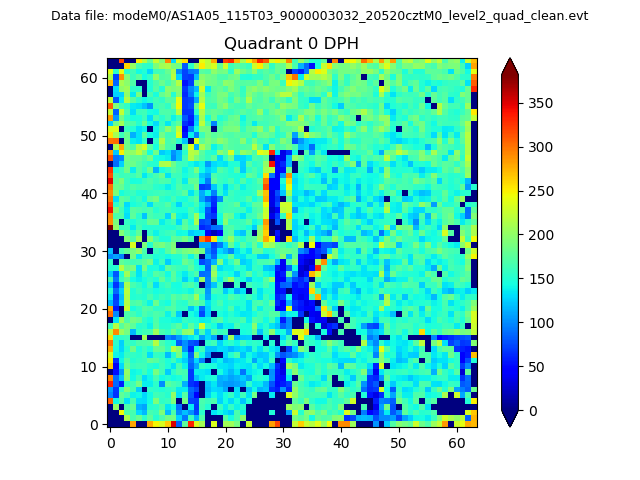 |
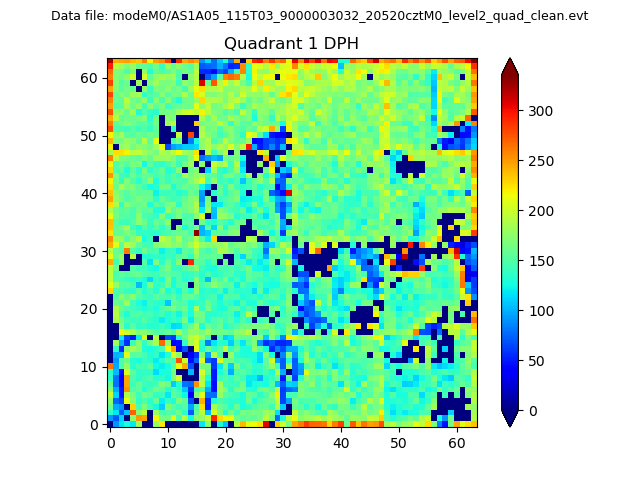 |
Quadrant B |
|---|---|---|---|
| Quadrant D | 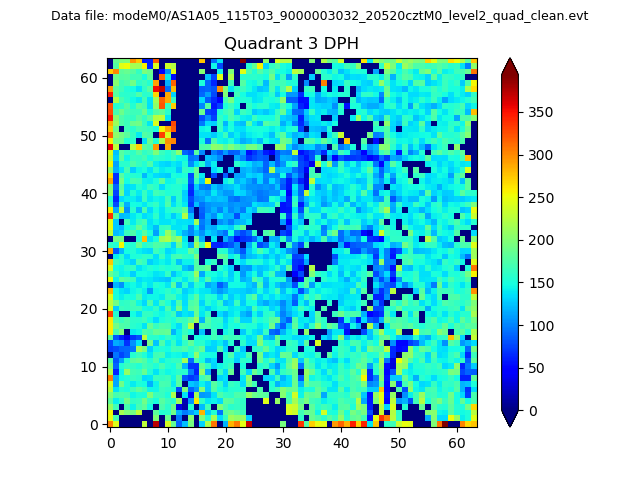 |
 |
Quadrant C |
| Plot type | Count rate plots | Images |
|---|---|---|
| Comparison with Poisson distribution Blue bars denote a histogram of data divided into 1 sec bins. Red curve is a Poisson curve with rate = median count rate of data. |
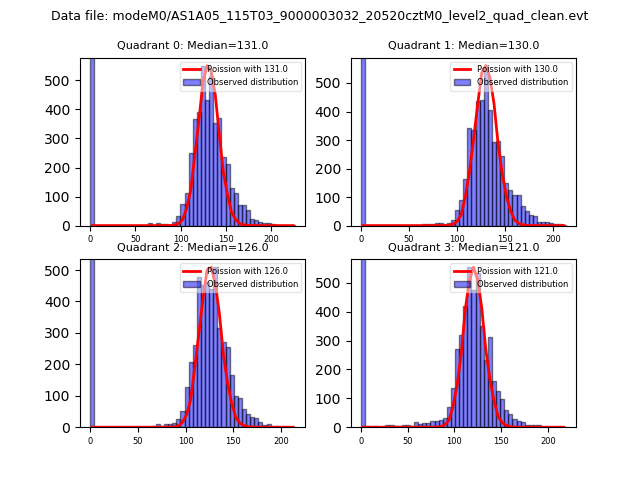 |
 |
| Quadrant-wise count rates Data is divided into 100 sec bins |
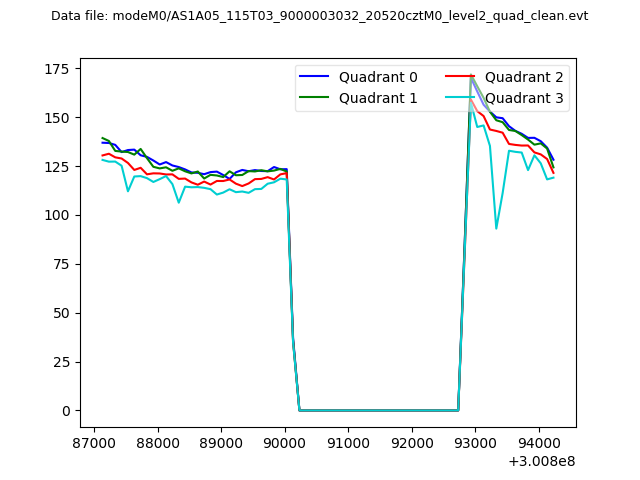 |
|
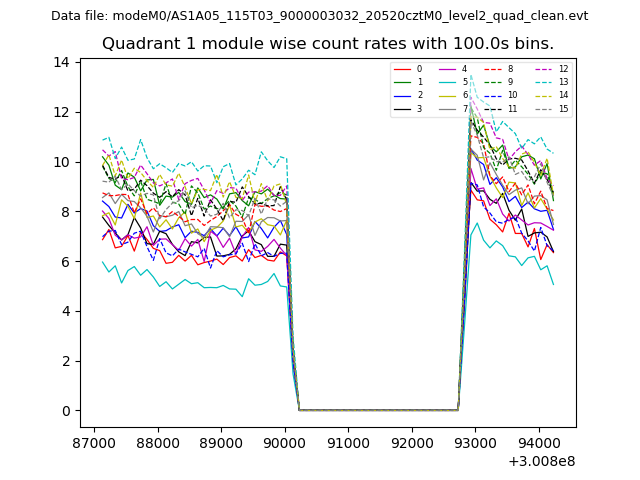
| Module-wise count rates for Quadrant A Data is divided into 100 sec bins |
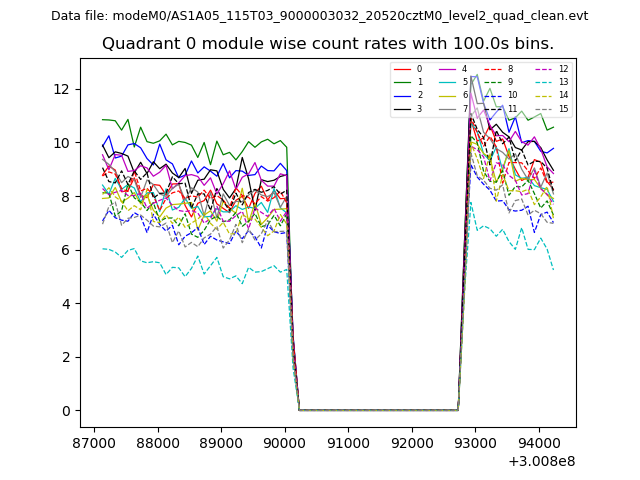 |
 |
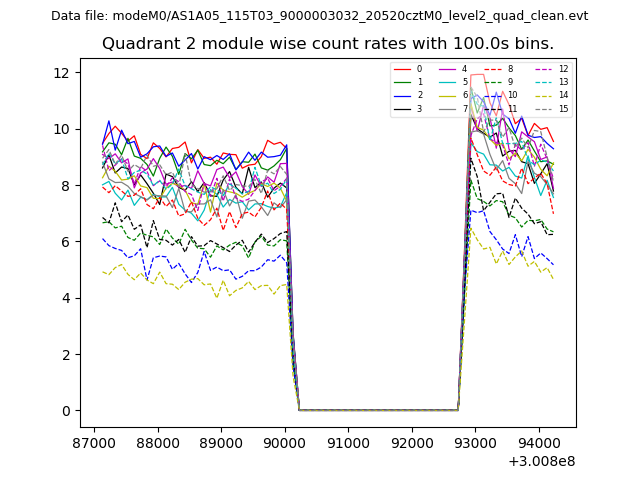
| Module-wise count rates for Quadrant B Data is divided into 100 sec bins |
 |
 |
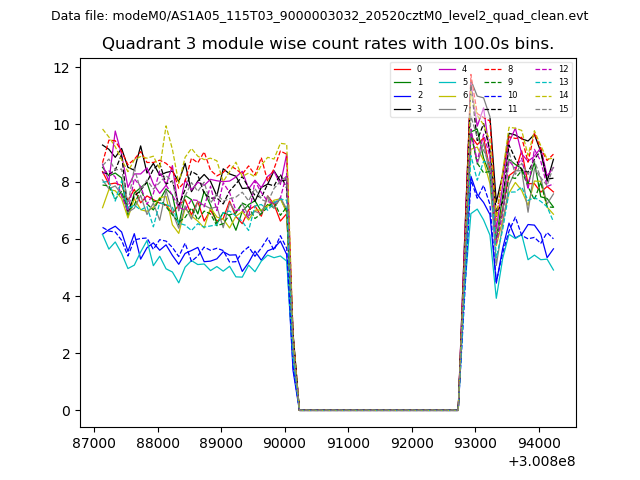
| Module-wise count rates for Quadrant C Data is divided into 100 sec bins |
 |
 |
| Module-wise count rates for Quadrant D Data is divided into 100 sec bins |
 |
 |
| Parameter | Plot |
|---|---|
| CZT HV Monitor |  |
| D_VDD | 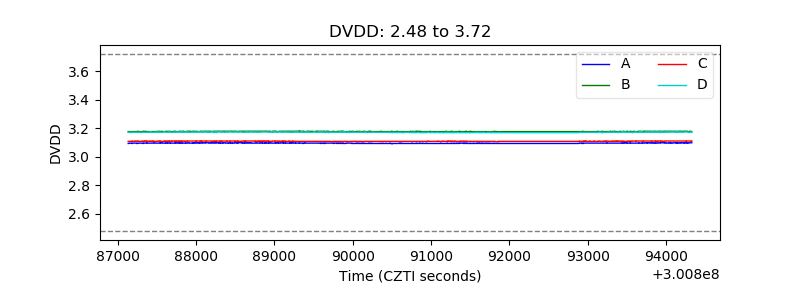 |
| Temperature 1 | 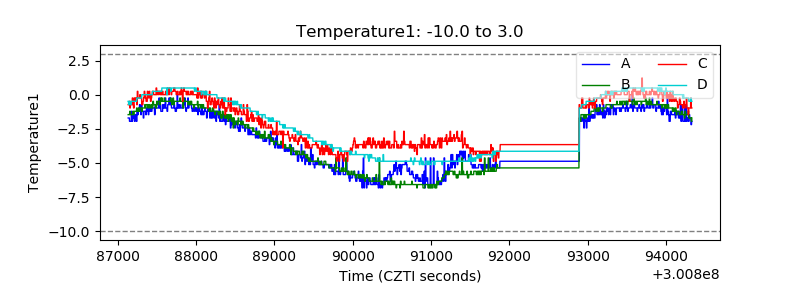 |
| Veto HV Monitor | 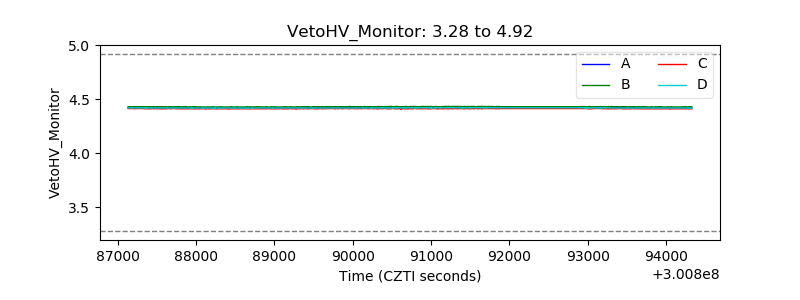 |
| Veto LLD | 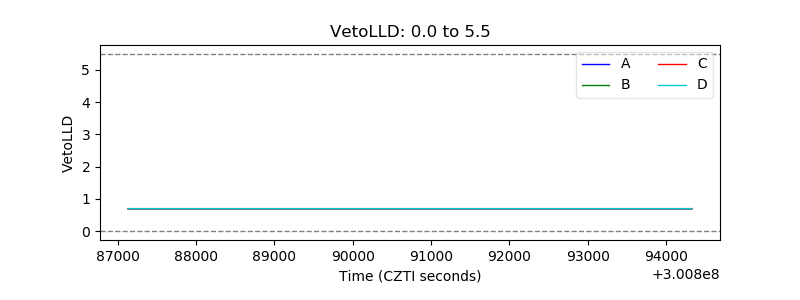 |
| Alpha Counter | 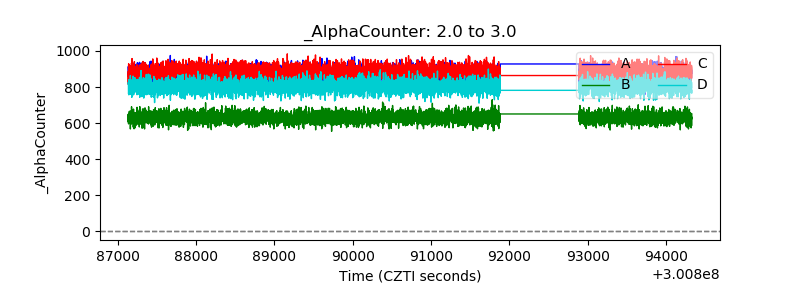 |
| _CPM_Rate | 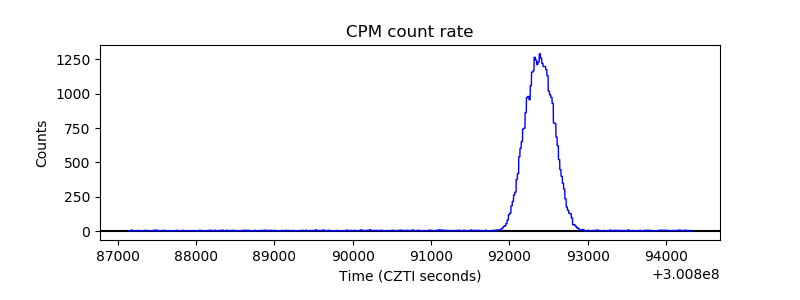 |
| CZT Counter | 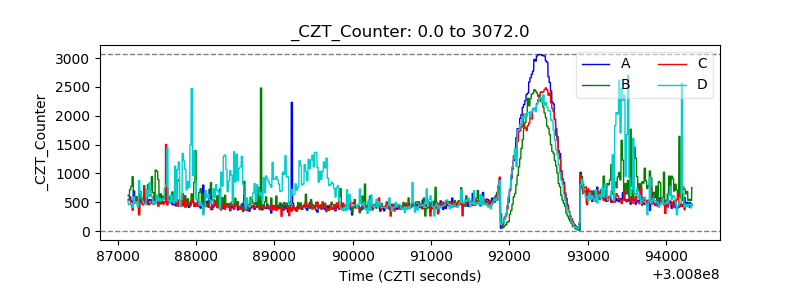 |
| +2.5 Volts monitor |  |
| +5 Volts monitor |  |
| _ROLL_ROT | 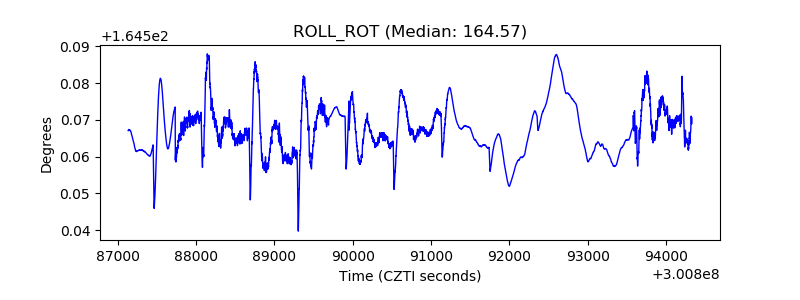 |
| _Roll_DEC | 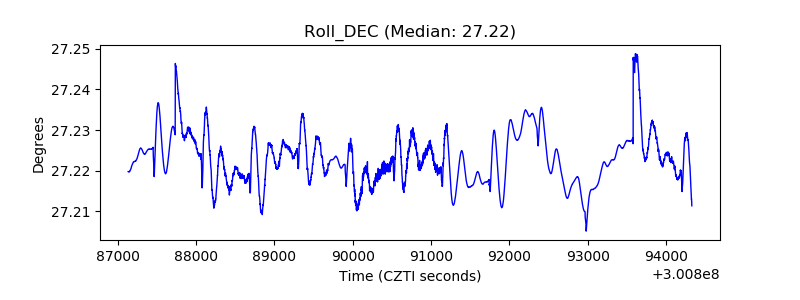 |
| _Roll_RA | 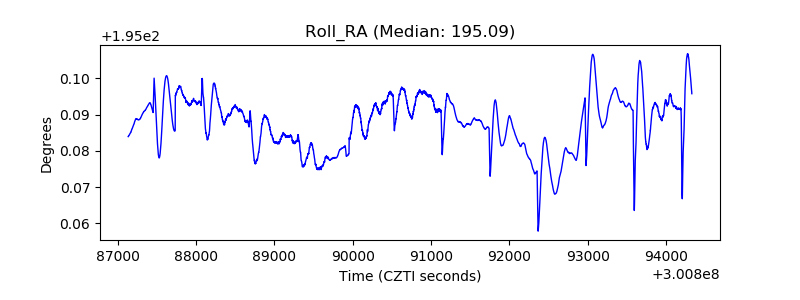 |
| Veto Counter | 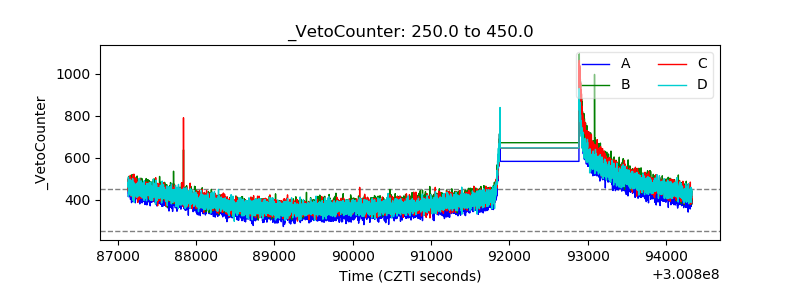 |