| Param | Original file | Final file |
|---|---|---|
| Filename | modeM0/AS1A05_115T03_9000003032_20522cztM0_level2.evt | modeM0/AS1A05_115T03_9000003032_20522cztM0_level2_quad_clean.evt |
| Size (bytes) | 440,493,120 | 84,879,360 |
| Size | 420.1 MB | 80.9 MB |
| Events in quadrant A | 2,858,620 | 555,053 |
| Events in quadrant B | 3,497,715 | 555,215 |
| Events in quadrant C | 2,919,152 | 530,373 |
| Events in quadrant D | 3,659,194 | 512,654 |
| Mode M9 | |||
|---|---|---|---|
| Quadrant | BADHDUFLAG | Total packets | Discarded packets |
| A | 0 | 12 | 0 |
| B | 0 | 12 | 0 |
| C | 0 | 12 | 0 |
| D | 0 | 12 | 0 |
| Mode M0 | |||
|---|---|---|---|
| Quadrant | BADHDUFLAG | Total packets | Discarded packets |
| A | 0 | 12415 | 0 |
| B | 0 | 14332 | 0 |
| C | 0 | 12528 | 0 |
| D | 0 | 14882 | 0 |
| Mode SS | |||
|---|---|---|---|
| Quadrant | BADHDUFLAG | Total packets | Discarded packets |
| A | 0 | 120 | 0 |
| B | 0 | 120 | 0 |
| C | 0 | 120 | 0 |
| D | 0 | 120 | 0 |
| Quadrant | Total seconds | Saturated seconds | Saturation percentage |
|---|---|---|---|
| A | 5975 | 41 | 0.686192% |
| B | 5975 | 75 | 1.255230% |
| C | 5976 | 66 | 1.104418% |
| D | 5976 | 201 | 3.363454% |
Noise dominated data is calculated using 1-second bins in cleaned event files. If a bin has >2000 counts, and if more than 50% of those come from <1% of pixels, then it is considered to be noise-dominated and hence unusable.
| Quadrant | # 1 sec bins | Bins with >0 counts | Bins with >2000 counts | High rate bins dominated by noise | Noise dominated (total time) | Noise dominated (detector-on time) | Marked lightcurve |
|---|---|---|---|---|---|---|---|
| A | 7125 | 5975 | 0 | 0 | 0.00% | 0.00% | 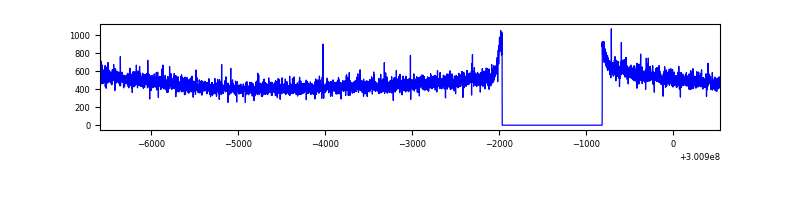 |
| B | 7125 | 5975 | 22 | 22 | 0.31% | 0.37% | 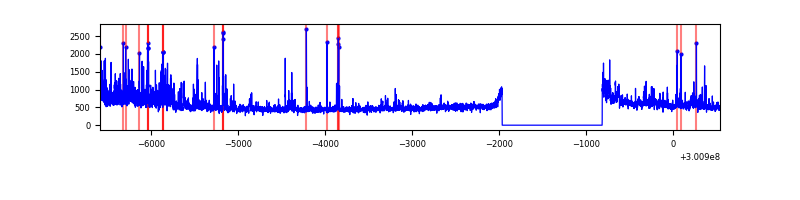 |
| C | 7126 | 5976 | 11 | 11 | 0.15% | 0.18% | 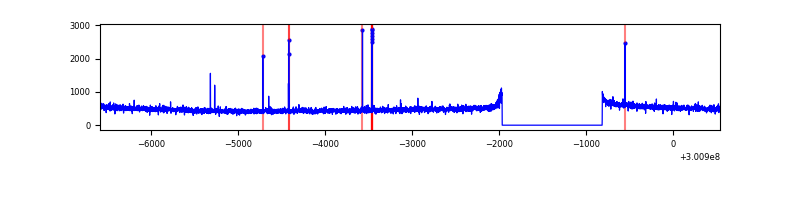 |
| D | 7126 | 5976 | 127 | 127 | 1.78% | 2.13% | 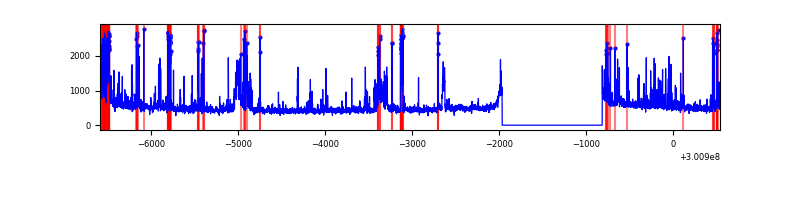 |
Top three noisy pixels from each quadrant. If the there are fewer than three noisy pixels in the level2.evt file, extra rows are filled as -1
| Pixel properties | Quadrant properties | ||||||
|---|---|---|---|---|---|---|---|
| Quadrant | DetID | PixID | Counts | Sigma | Mean | Median | Sigma |
| A | 11 | 29 | 15667 | 100.29 | 737 | 721 | 149.0 |
| A | 0 | 226 | 6510 | 38.84 | 737 | 721 | 149.0 |
| A | 12 | 194 | 5441 | 31.67 | 737 | 721 | 149.0 |
| B | 0 | 189 | 204530 | 1470.85 | 735 | 719 | 138.6 |
| B | 7 | 220 | 169081 | 1215.02 | 735 | 719 | 138.6 |
| B | 0 | 219 | 66356 | 473.68 | 735 | 719 | 138.6 |
| C | 14 | 238 | 109885 | 653.78 | 706 | 711 | 167.0 |
| C | 3 | 9 | 33392 | 195.71 | 706 | 711 | 167.0 |
| C | 9 | 221 | 12686 | 71.71 | 706 | 711 | 167.0 |
| D | 5 | 222 | 237517 | 1368.78 | 710 | 691 | 173.0 |
| D | 7 | 238 | 173980 | 1001.56 | 710 | 691 | 173.0 |
| D | 12 | 227 | 134832 | 775.29 | 710 | 691 | 173.0 |
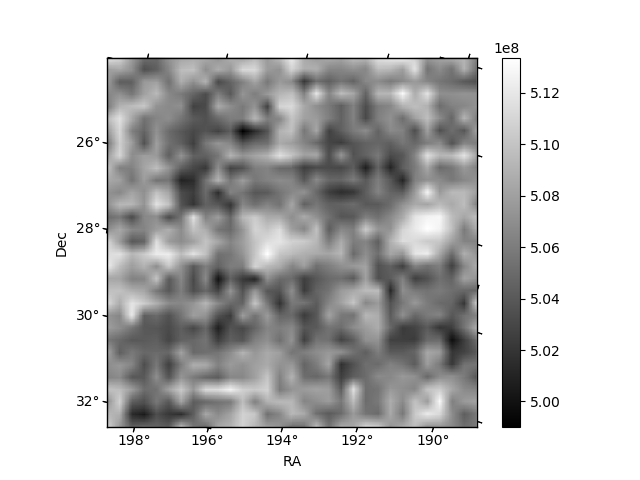
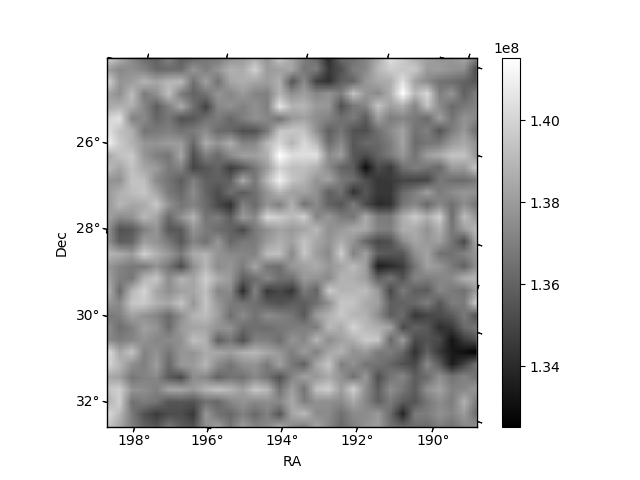
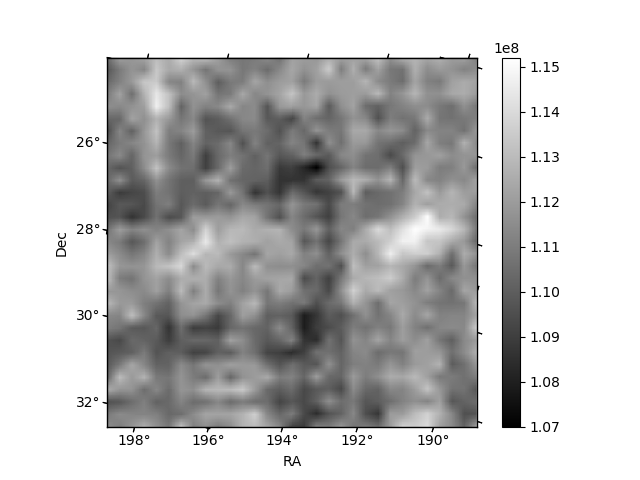
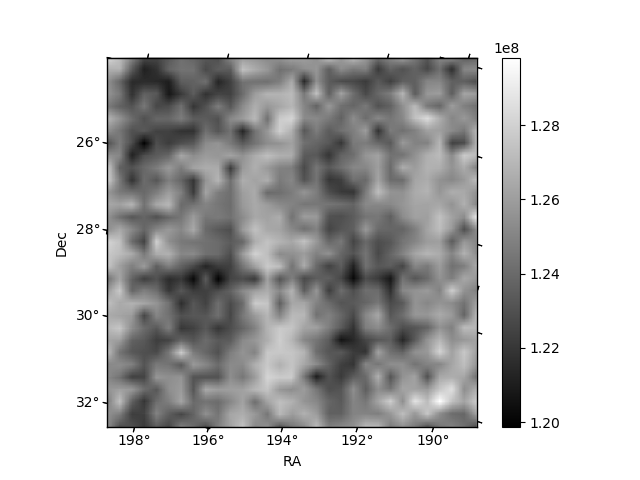
Histogram calculated using DETX and DETY for each event in the final _common_clean file
| Quadrant A | 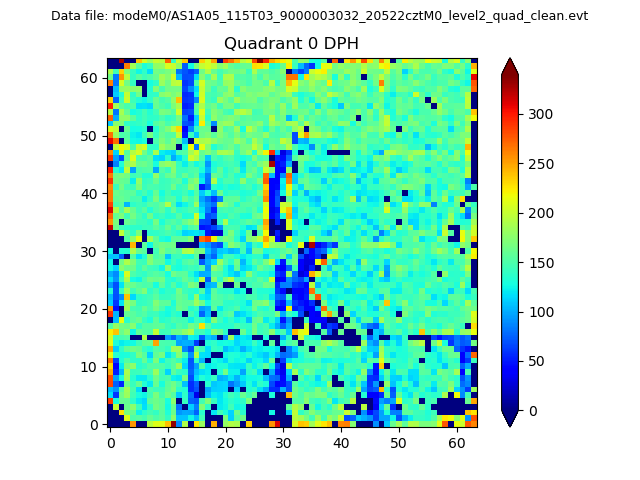 |
 |
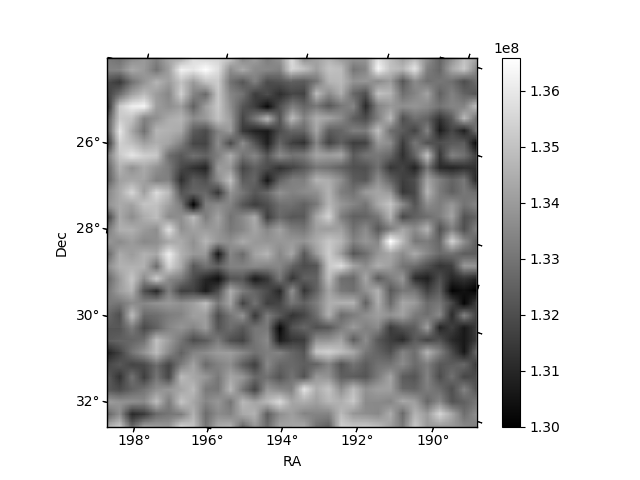
Quadrant B |
|---|---|---|---|
| Quadrant D | 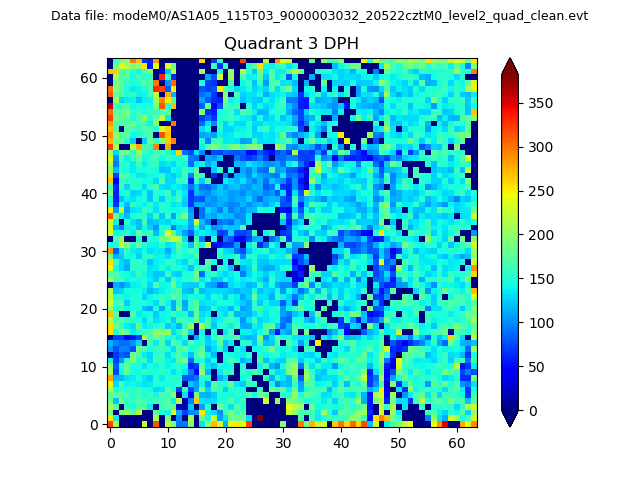 |
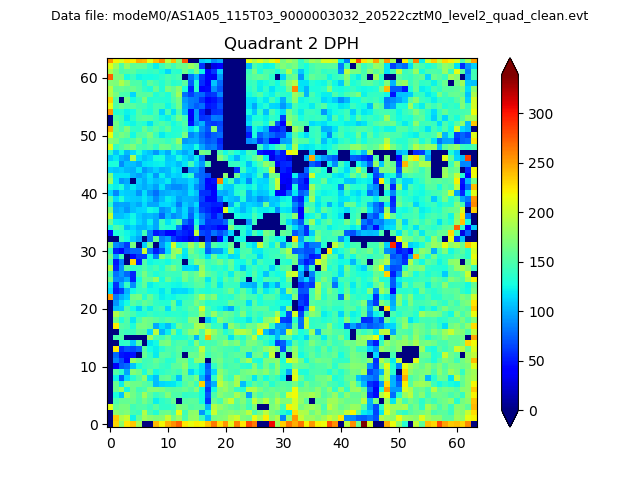 |
Quadrant C |
| Plot type | Count rate plots | Images |
|---|---|---|
| Comparison with Poisson distribution Blue bars denote a histogram of data divided into 1 sec bins. Red curve is a Poisson curve with rate = median count rate of data. |
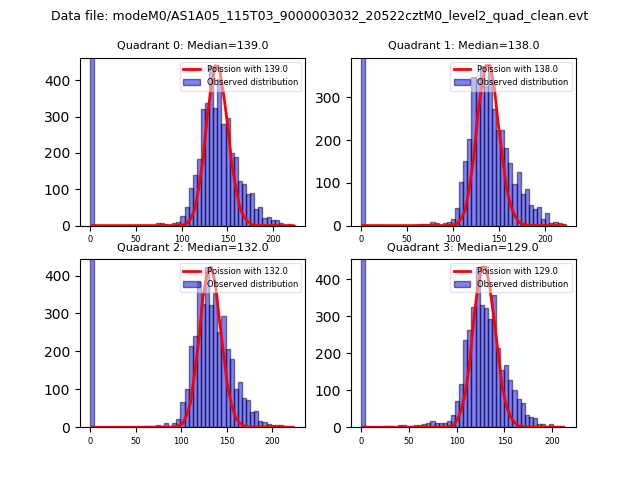 |
 |
| Quadrant-wise count rates Data is divided into 100 sec bins |
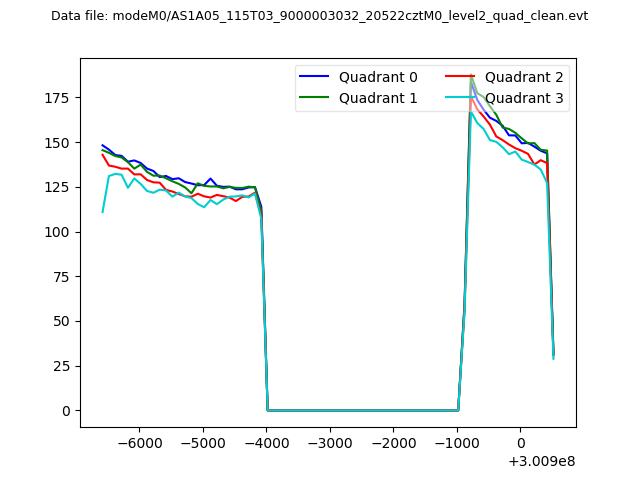 |
|
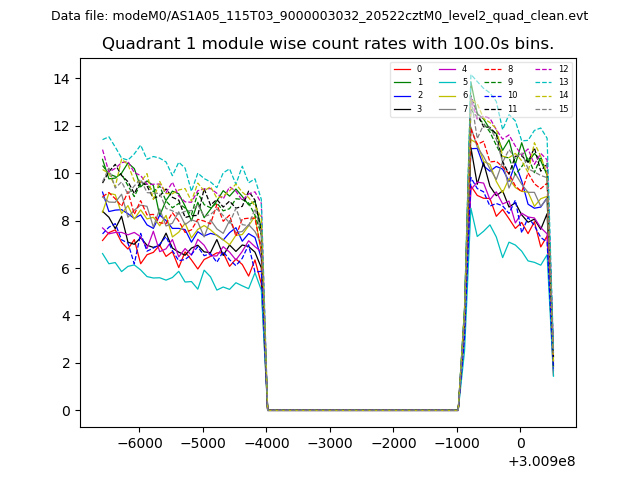
| Module-wise count rates for Quadrant A Data is divided into 100 sec bins |
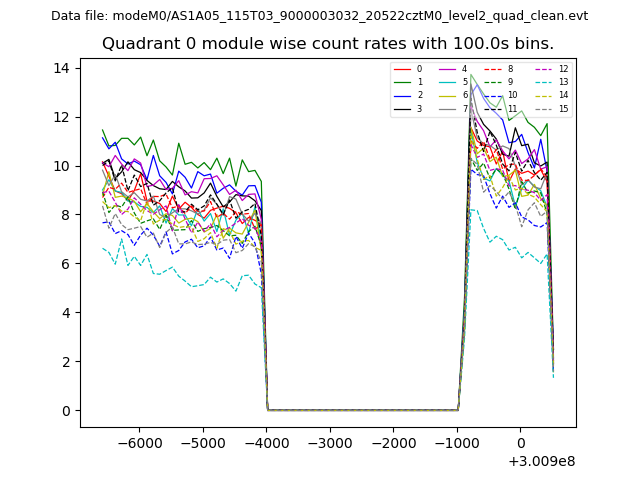 |
 |
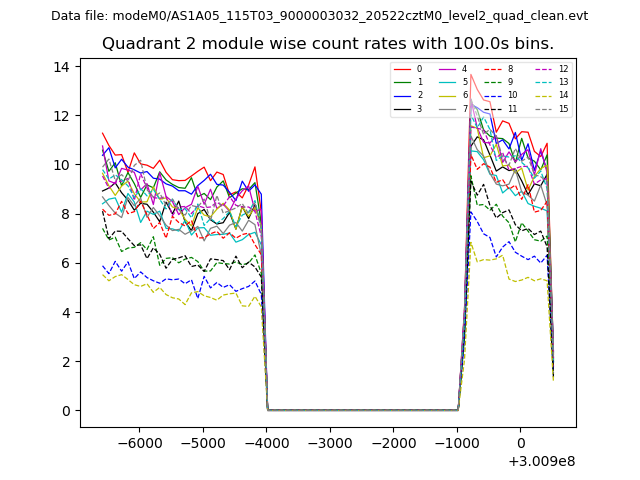
| Module-wise count rates for Quadrant B Data is divided into 100 sec bins |
 |
 |
| Module-wise count rates for Quadrant C Data is divided into 100 sec bins |
 |
 |
| Module-wise count rates for Quadrant D Data is divided into 100 sec bins |
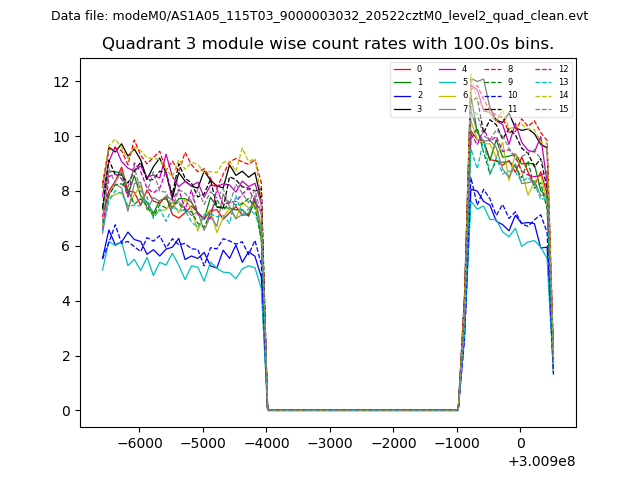 |
 |
| Parameter | Plot |
|---|---|
| CZT HV Monitor |  |
| D_VDD | 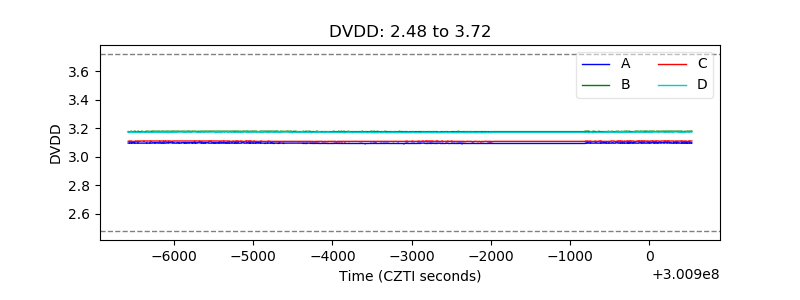 |
| Temperature 1 | 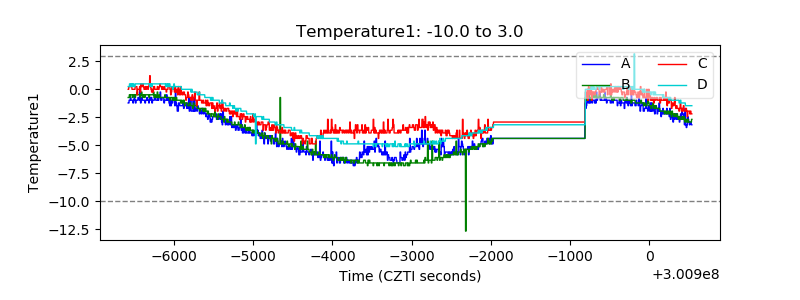 |
| Veto HV Monitor | 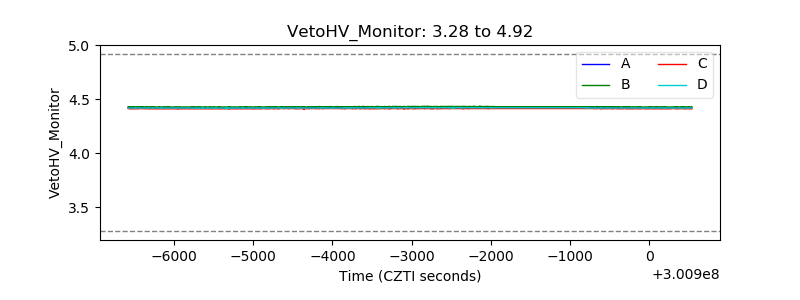 |
| Veto LLD | 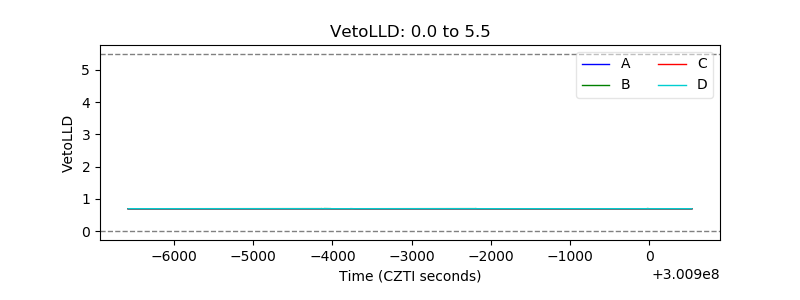 |
| Alpha Counter | 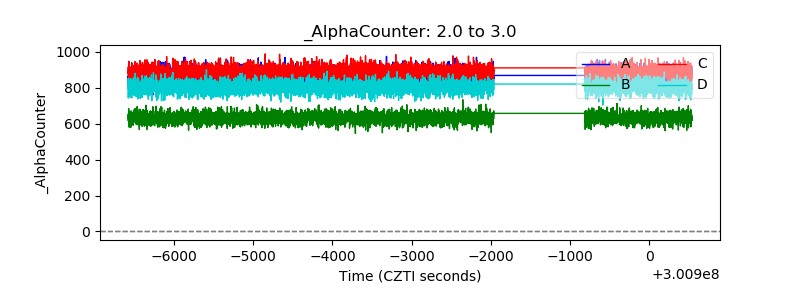 |
| _CPM_Rate | 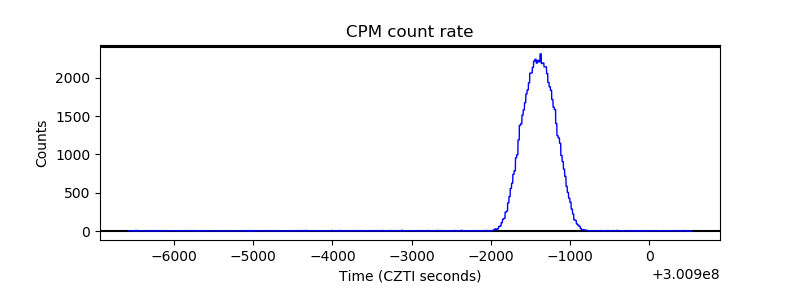 |
| CZT Counter | 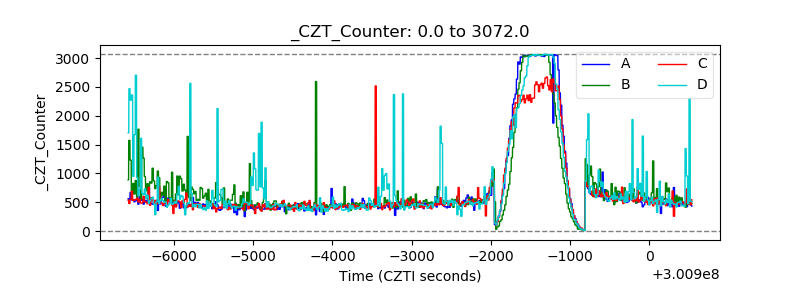 |
| +2.5 Volts monitor |  |
| +5 Volts monitor | 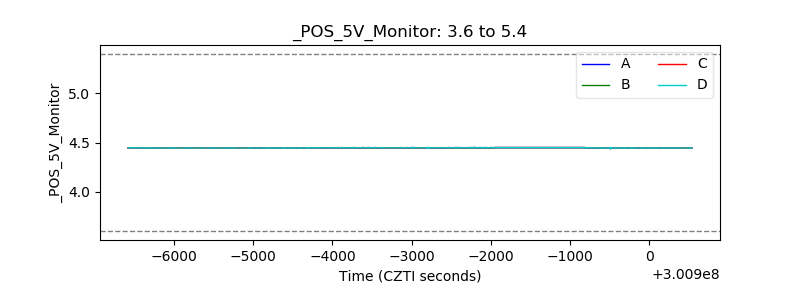 |
| _ROLL_ROT | 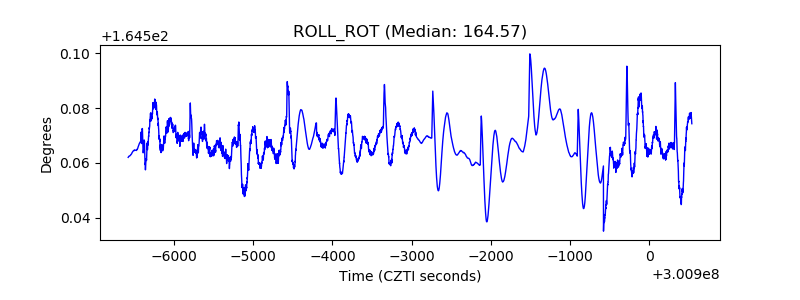 |
| _Roll_DEC | 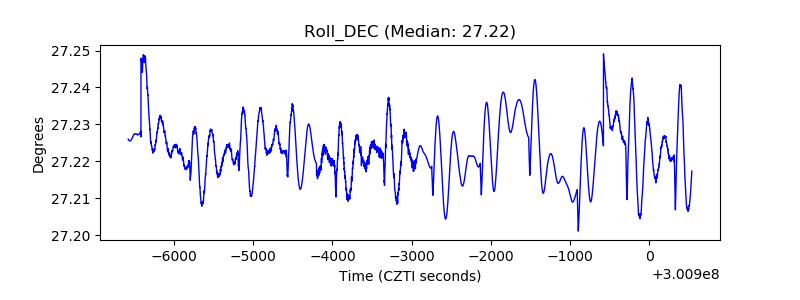 |
| _Roll_RA | 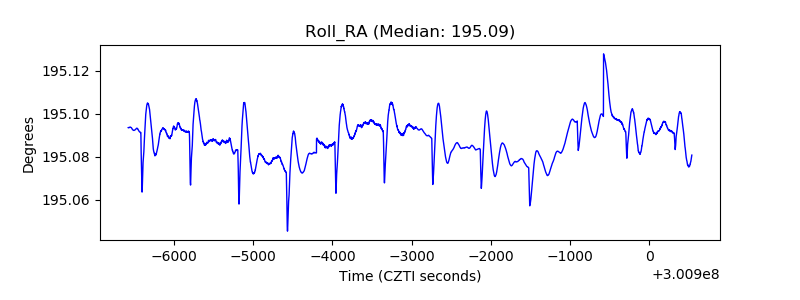 |
| Veto Counter | 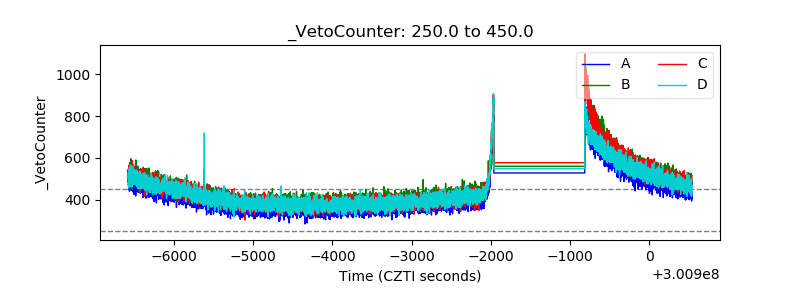 |