| Param | Original file | Final file |
|---|---|---|
| Filename | modeM0/AS1A05_115T03_9000003032_20524cztM0_level2.evt | modeM0/AS1A05_115T03_9000003032_20524cztM0_level2_quad_clean.evt |
| Size (bytes) | 486,002,880 | 96,710,400 |
| Size | 463.5 MB | 92.2 MB |
| Events in quadrant A | 3,169,565 | 645,627 |
| Events in quadrant B | 3,497,362 | 660,554 |
| Events in quadrant C | 3,213,471 | 616,985 |
| Events in quadrant D | 4,414,384 | 569,685 |
| Mode M9 | |||
|---|---|---|---|
| Quadrant | BADHDUFLAG | Total packets | Discarded packets |
| A | 0 | 18 | 0 |
| B | 0 | 19 | 0 |
| C | 0 | 19 | 0 |
| D | 0 | 19 | 0 |
| Mode M0 | |||
|---|---|---|---|
| Quadrant | BADHDUFLAG | Total packets | Discarded packets |
| A | 0 | 13333 | 2 |
| B | 0 | 14343 | 3 |
| C | 0 | 13398 | 2 |
| D | 0 | 17259 | 2 |
| Mode SS | |||
|---|---|---|---|
| Quadrant | BADHDUFLAG | Total packets | Discarded packets |
| A | 0 | 126 | 0 |
| B | 0 | 126 | 0 |
| C | 0 | 126 | 0 |
| D | 0 | 126 | 0 |
| Quadrant | Total seconds | Saturated seconds | Saturation percentage |
|---|---|---|---|
| A | 6250 | 43 | 0.688000% |
| B | 6249 | 59 | 0.944151% |
| C | 6249 | 78 | 1.248200% |
| D | 6249 | 405 | 6.481037% |
Noise dominated data is calculated using 1-second bins in cleaned event files. If a bin has >2000 counts, and if more than 50% of those come from <1% of pixels, then it is considered to be noise-dominated and hence unusable.
| Quadrant | # 1 sec bins | Bins with >0 counts | Bins with >2000 counts | High rate bins dominated by noise | Noise dominated (total time) | Noise dominated (detector-on time) | Marked lightcurve |
|---|---|---|---|---|---|---|---|
| A | 7585 | 6250 | 0 | 0 | 0.00% | 0.00% | 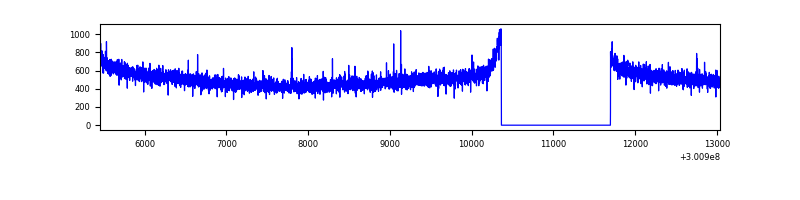 |
| B | 7584 | 6249 | 3 | 3 | 0.04% | 0.05% | 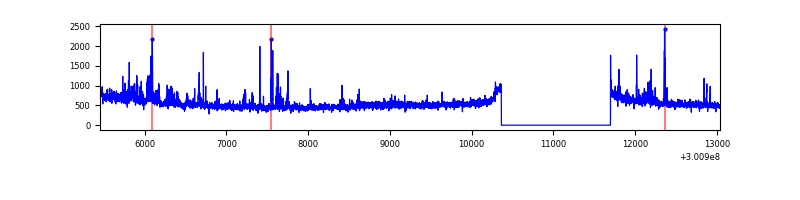 |
| C | 7584 | 6249 | 0 | 0 | 0.00% | 0.00% | 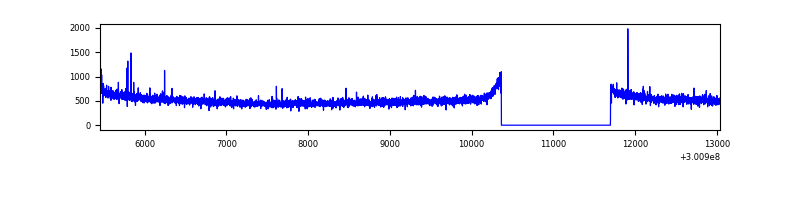 |
| D | 7584 | 6249 | 372 | 372 | 4.91% | 5.95% | 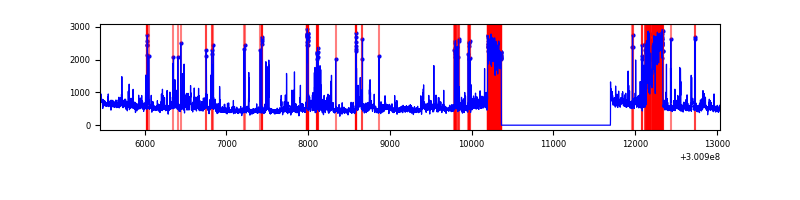 |
Top three noisy pixels from each quadrant. If the there are fewer than three noisy pixels in the level2.evt file, extra rows are filled as -1
| Pixel properties | Quadrant properties | ||||||
|---|---|---|---|---|---|---|---|
| Quadrant | DetID | PixID | Counts | Sigma | Mean | Median | Sigma |
| A | 2 | 79 | 10599 | 59.56 | 819 | 804 | 164.4 |
| A | 0 | 226 | 7275 | 39.35 | 819 | 804 | 164.4 |
| A | 12 | 194 | 6143 | 32.47 | 819 | 804 | 164.4 |
| B | 0 | 189 | 136157 | 888.97 | 821 | 803 | 152.3 |
| B | 0 | 219 | 52454 | 339.23 | 821 | 803 | 152.3 |
| B | 0 | 190 | 34773 | 223.11 | 821 | 803 | 152.3 |
| C | 14 | 238 | 124050 | 671.03 | 788 | 796 | 183.7 |
| C | 0 | 207 | 10253 | 51.49 | 788 | 796 | 183.7 |
| C | 13 | 61 | 5773 | 27.1 | 788 | 796 | 183.7 |
| D | 1 | 52 | 621399 | 3302.56 | 763 | 740 | 187.9 |
| D | 5 | 222 | 525147 | 2790.4 | 763 | 740 | 187.9 |
| D | 2 | 184 | 65794 | 346.15 | 763 | 740 | 187.9 |
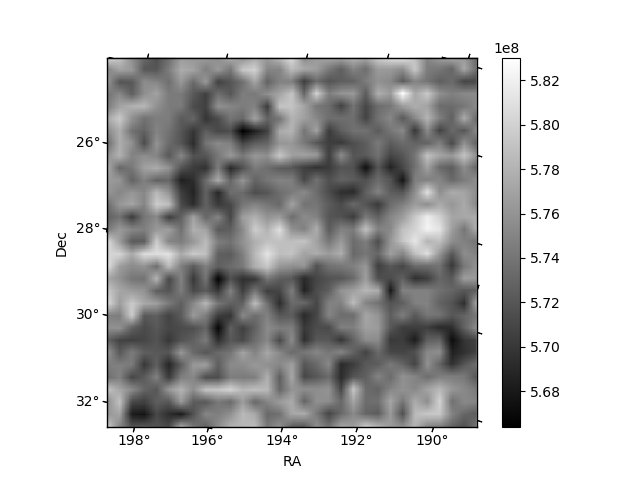
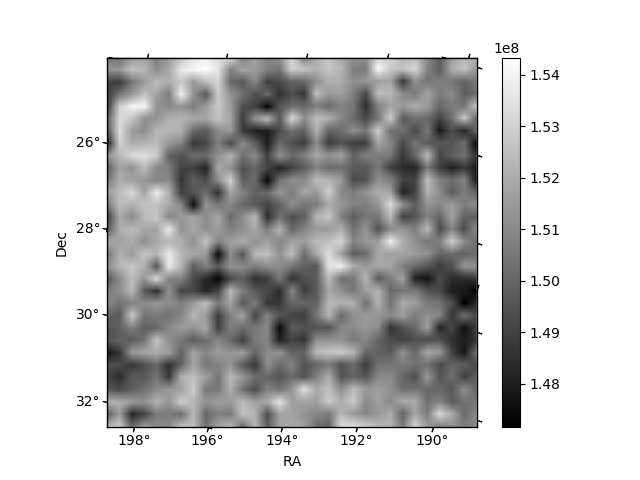
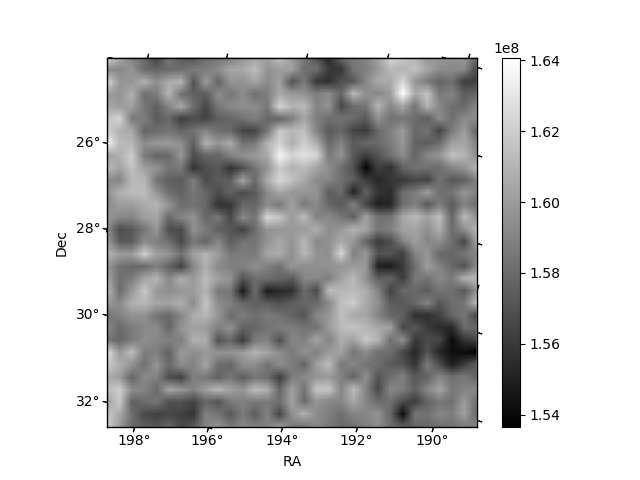
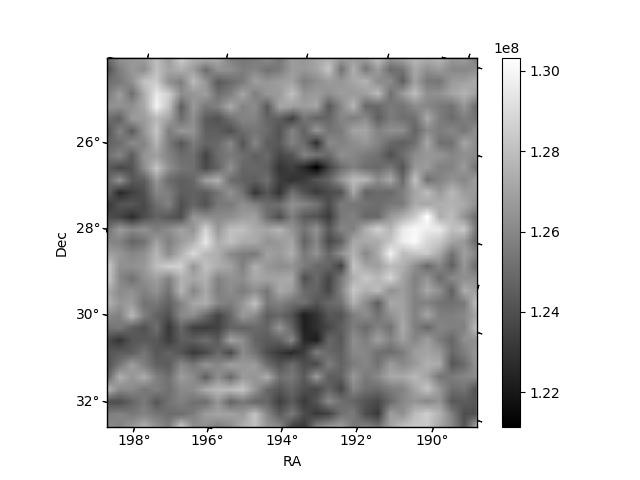
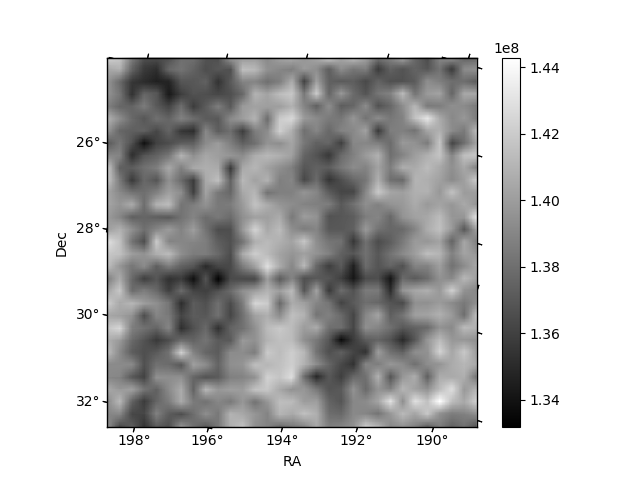
Histogram calculated using DETX and DETY for each event in the final _common_clean file
| Quadrant A | 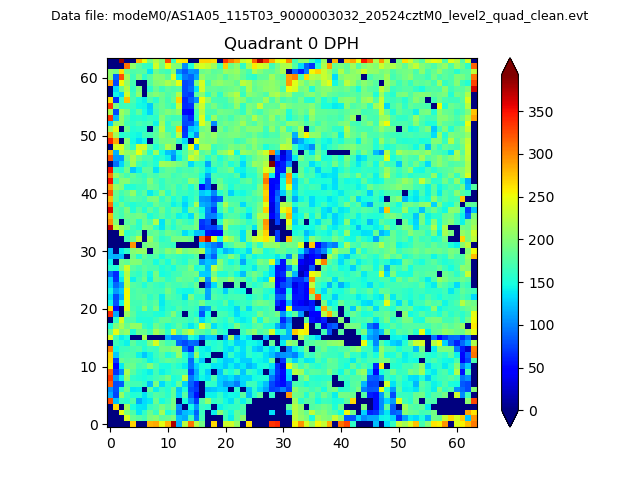 |
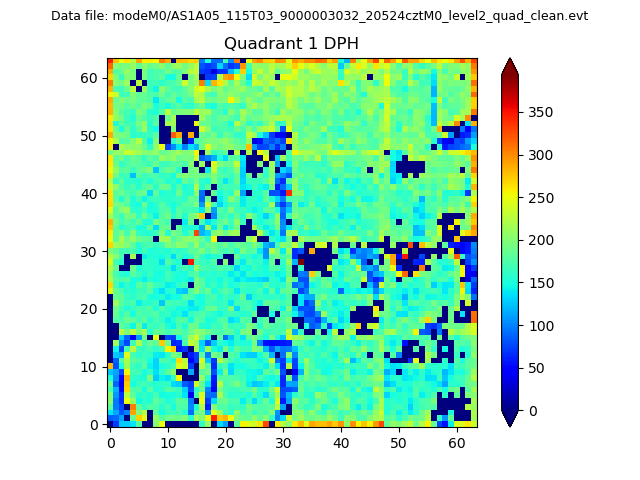 |
Quadrant B |
|---|---|---|---|
| Quadrant D | 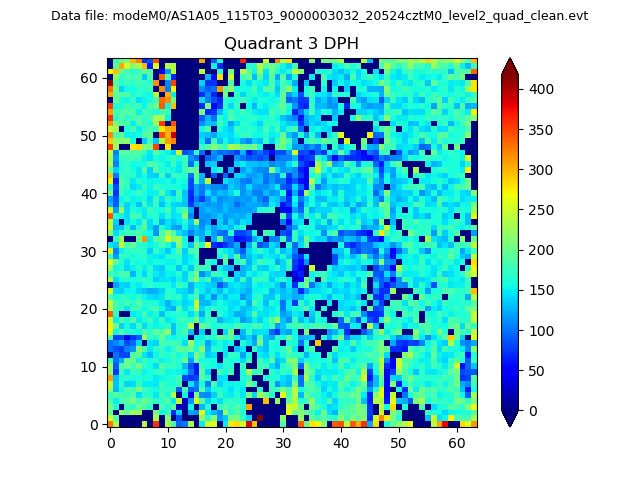 |
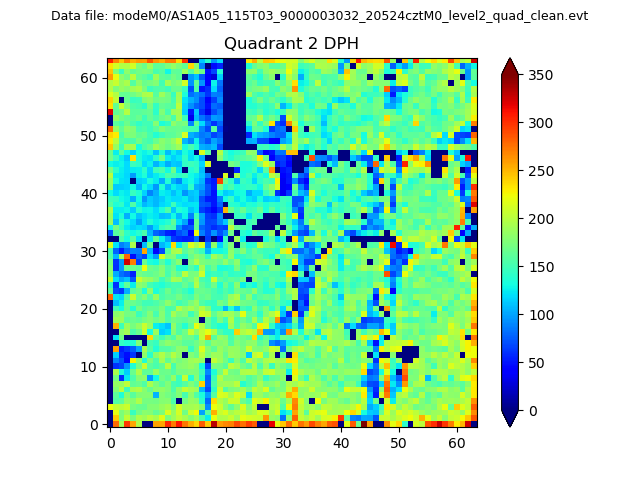 |
Quadrant C |
| Plot type | Count rate plots | Images |
|---|---|---|
| Comparison with Poisson distribution Blue bars denote a histogram of data divided into 1 sec bins. Red curve is a Poisson curve with rate = median count rate of data. |
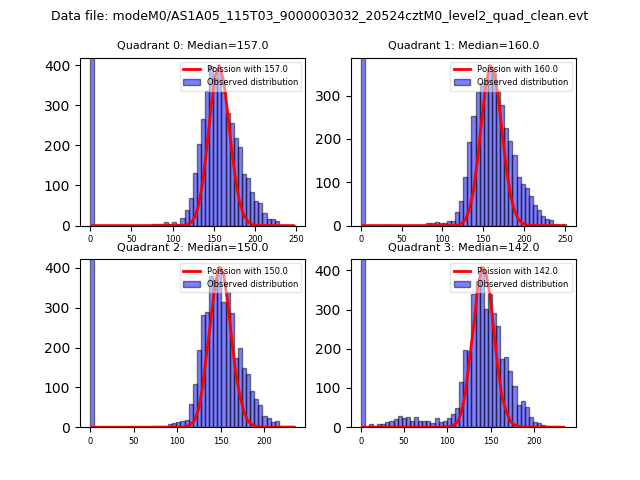 |
 |
| Quadrant-wise count rates Data is divided into 100 sec bins |
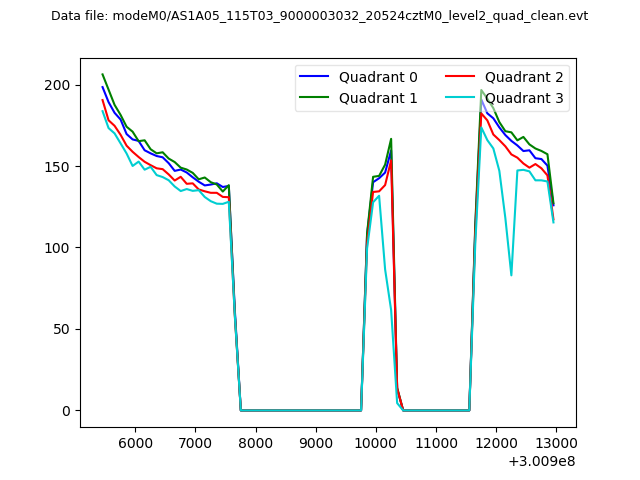 |
|
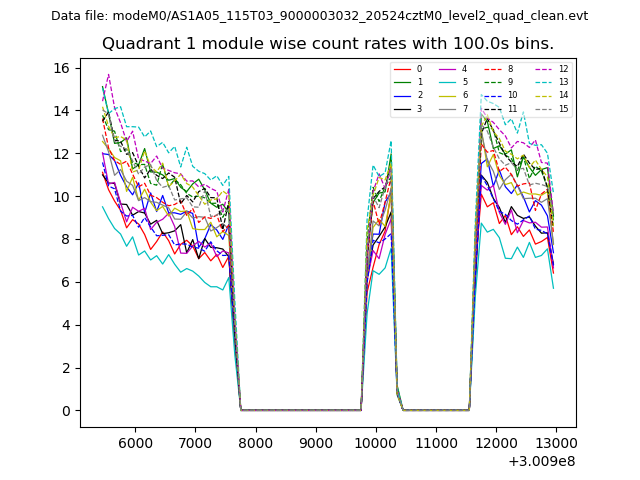
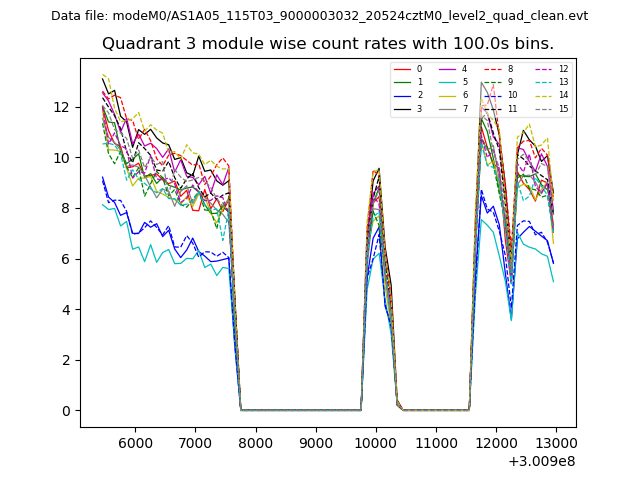
| Module-wise count rates for Quadrant A Data is divided into 100 sec bins |
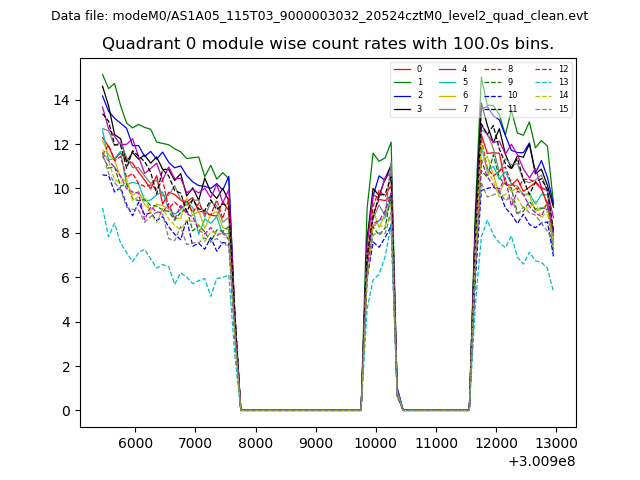 |
 |
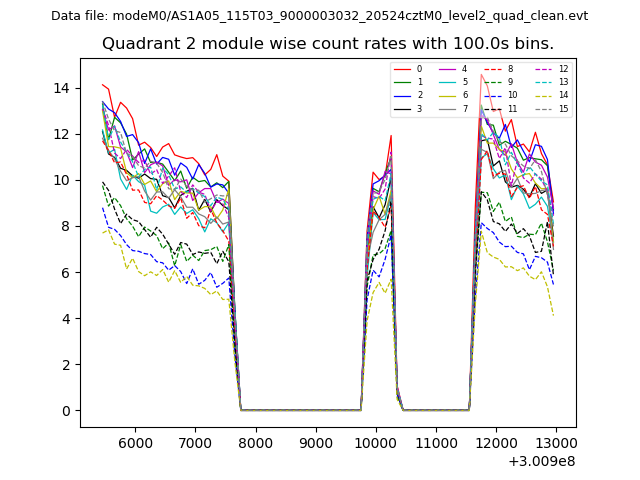
| Module-wise count rates for Quadrant B Data is divided into 100 sec bins |
 |
 |
| Module-wise count rates for Quadrant C Data is divided into 100 sec bins |
 |
 |
| Module-wise count rates for Quadrant D Data is divided into 100 sec bins |
 |
 |
| Parameter | Plot |
|---|---|
| CZT HV Monitor | 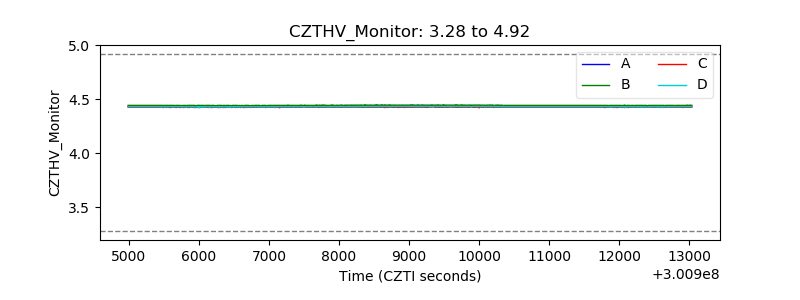 |
| D_VDD | 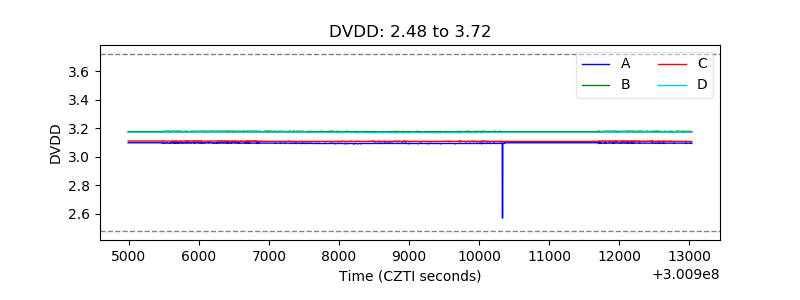 |
| Temperature 1 | 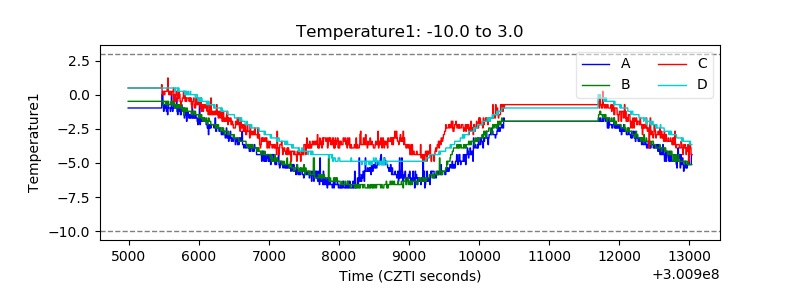 |
| Veto HV Monitor | 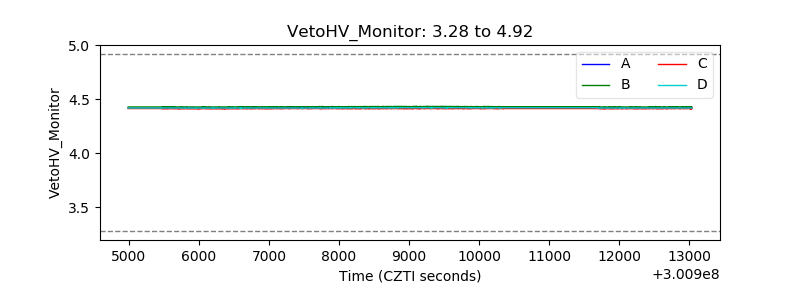 |
| Veto LLD | 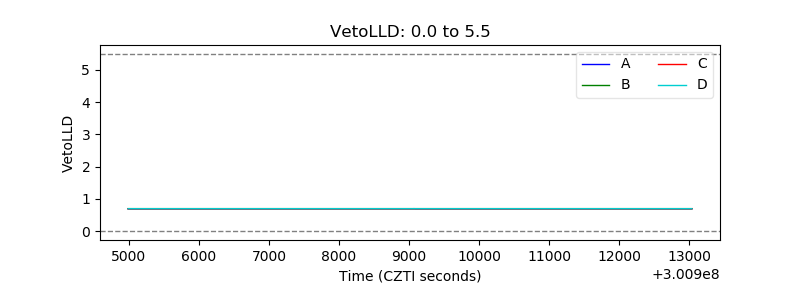 |
| Alpha Counter | 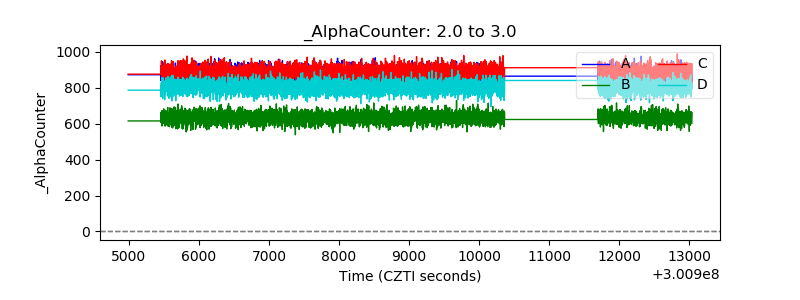 |
| _CPM_Rate | 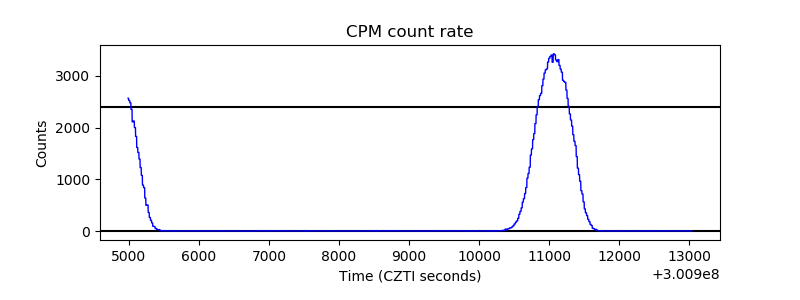 |
| CZT Counter | 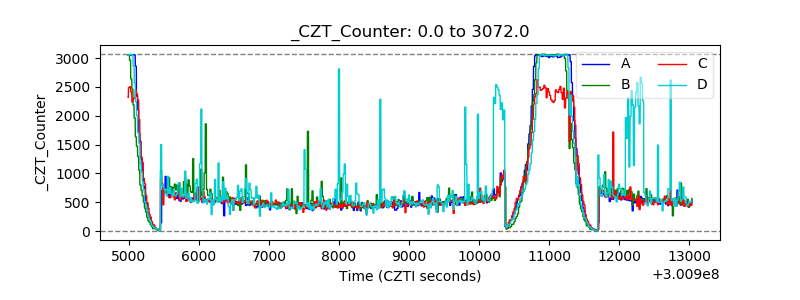 |
| +2.5 Volts monitor |  |
| +5 Volts monitor |  |
| _ROLL_ROT | 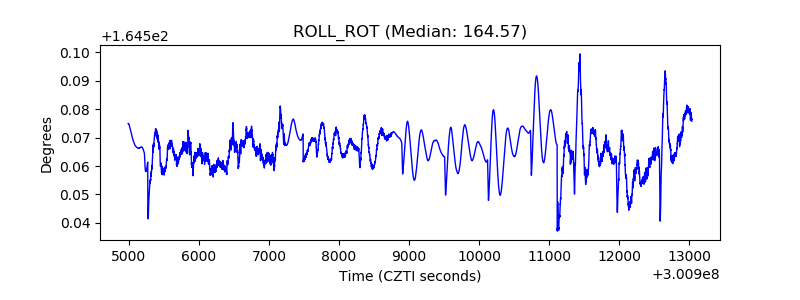 |
| _Roll_DEC | 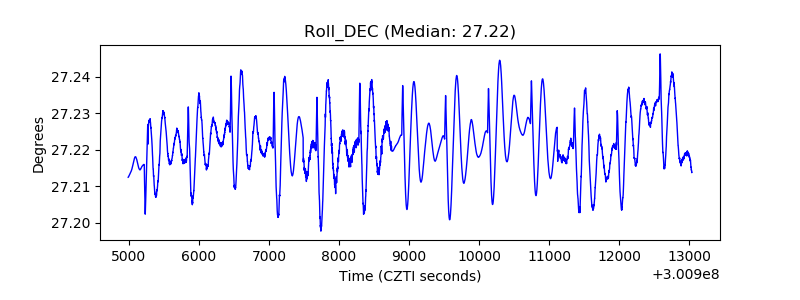 |
| _Roll_RA | 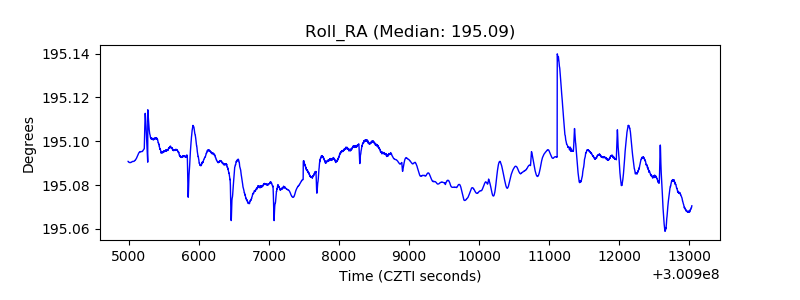 |
| Veto Counter | 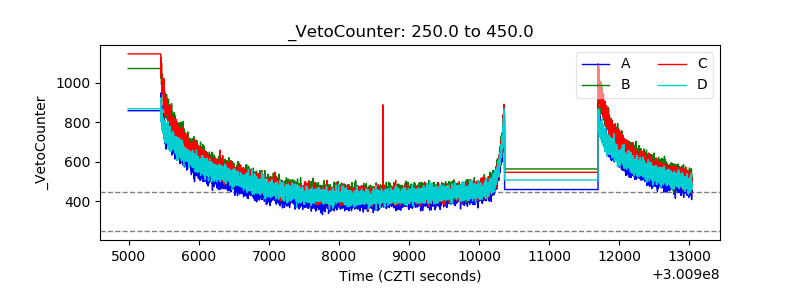 |