| Param | Original file | Final file |
|---|---|---|
| Filename | modeM0/AS1A05_115T03_9000003032_20525cztM0_level2.evt | modeM0/AS1A05_115T03_9000003032_20525cztM0_level2_quad_clean.evt |
| Size (bytes) | 477,933,120 | 92,499,840 |
| Size | 455.8 MB | 88.2 MB |
| Events in quadrant A | 3,075,933 | 617,890 |
| Events in quadrant B | 3,437,243 | 631,216 |
| Events in quadrant C | 3,108,584 | 591,971 |
| Events in quadrant D | 4,437,690 | 533,585 |
| Mode M9 | |||
|---|---|---|---|
| Quadrant | BADHDUFLAG | Total packets | Discarded packets |
| A | 0 | 18 | 0 |
| B | 0 | 19 | 0 |
| C | 0 | 19 | 0 |
| D | 0 | 19 | 0 |
| Mode M0 | |||
|---|---|---|---|
| Quadrant | BADHDUFLAG | Total packets | Discarded packets |
| A | 0 | 12864 | 2 |
| B | 0 | 13977 | 3 |
| C | 0 | 12927 | 2 |
| D | 0 | 17189 | 2 |
| Mode SS | |||
|---|---|---|---|
| Quadrant | BADHDUFLAG | Total packets | Discarded packets |
| A | 0 | 124 | 0 |
| B | 0 | 124 | 0 |
| C | 0 | 124 | 0 |
| D | 0 | 124 | 0 |
| Quadrant | Total seconds | Saturated seconds | Saturation percentage |
|---|---|---|---|
| A | 6110 | 18 | 0.294599% |
| B | 6109 | 66 | 1.080373% |
| C | 6109 | 46 | 0.752987% |
| D | 6109 | 437 | 7.153380% |
Noise dominated data is calculated using 1-second bins in cleaned event files. If a bin has >2000 counts, and if more than 50% of those come from <1% of pixels, then it is considered to be noise-dominated and hence unusable.
| Quadrant | # 1 sec bins | Bins with >0 counts | Bins with >2000 counts | High rate bins dominated by noise | Noise dominated (total time) | Noise dominated (detector-on time) | Marked lightcurve |
|---|---|---|---|---|---|---|---|
| A | 7529 | 6109 | 1 | 1 | 0.01% | 0.02% | 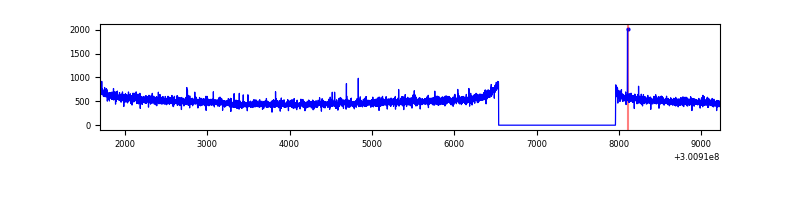 |
| B | 7528 | 6108 | 16 | 16 | 0.21% | 0.26% | 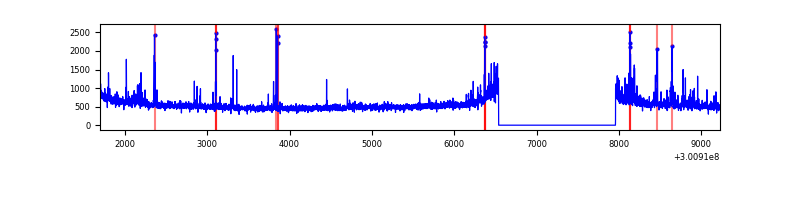 |
| C | 7529 | 6109 | 0 | 0 | 0.00% | 0.00% | 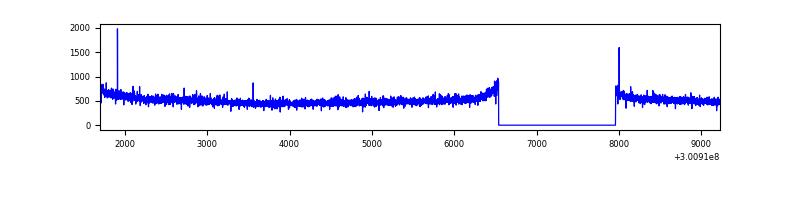 |
| D | 7528 | 6109 | 418 | 418 | 5.55% | 6.84% | 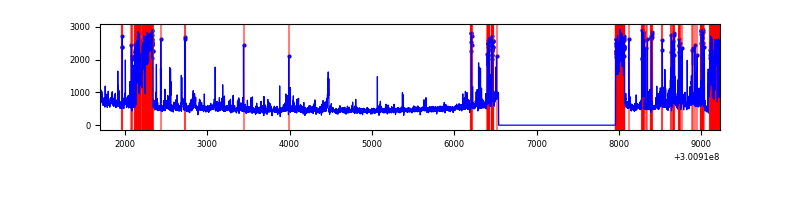 |
Top three noisy pixels from each quadrant. If the there are fewer than three noisy pixels in the level2.evt file, extra rows are filled as -1
| Pixel properties | Quadrant properties | ||||||
|---|---|---|---|---|---|---|---|
| Quadrant | DetID | PixID | Counts | Sigma | Mean | Median | Sigma |
| A | 11 | 29 | 7792 | 43.81 | 794 | 779 | 160.1 |
| A | 0 | 226 | 6998 | 38.85 | 794 | 779 | 160.1 |
| A | 14 | 239 | 6543 | 36.01 | 794 | 779 | 160.1 |
| B | 0 | 189 | 103686 | 700.63 | 798 | 782 | 146.9 |
| B | 7 | 220 | 73372 | 494.24 | 798 | 782 | 146.9 |
| B | 0 | 190 | 39766 | 265.43 | 798 | 782 | 146.9 |
| C | 14 | 238 | 120205 | 669.04 | 763 | 769 | 178.5 |
| C | 8 | 208 | 6189 | 30.36 | 763 | 769 | 178.5 |
| C | 0 | 207 | 5899 | 28.74 | 763 | 769 | 178.5 |
| D | 1 | 52 | 938769 | 5251.84 | 735 | 714 | 178.6 |
| D | 5 | 222 | 415910 | 2324.54 | 735 | 714 | 178.6 |
| D | 2 | 184 | 112273 | 624.58 | 735 | 714 | 178.6 |
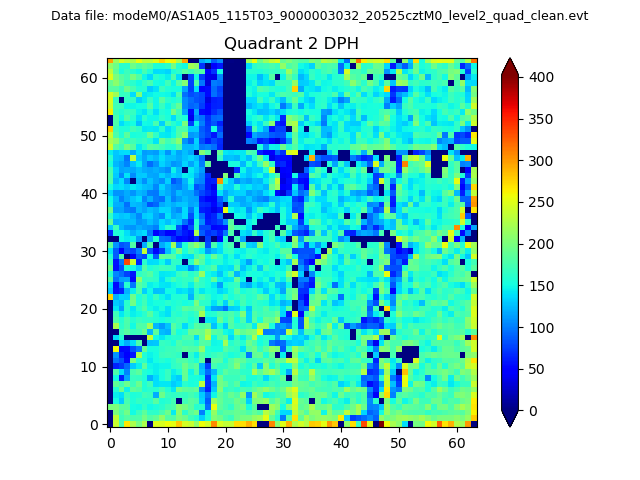
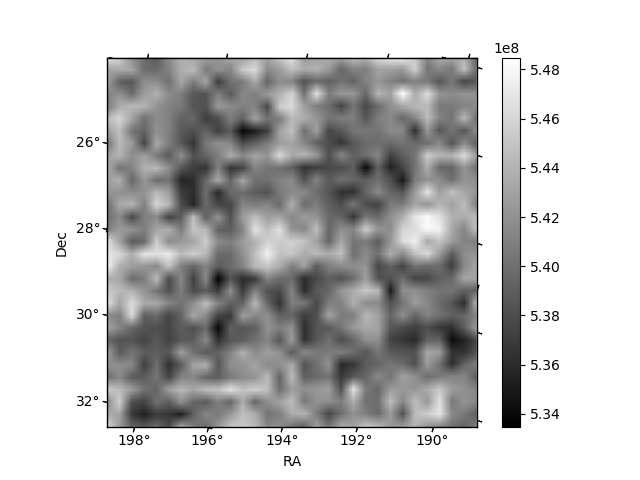
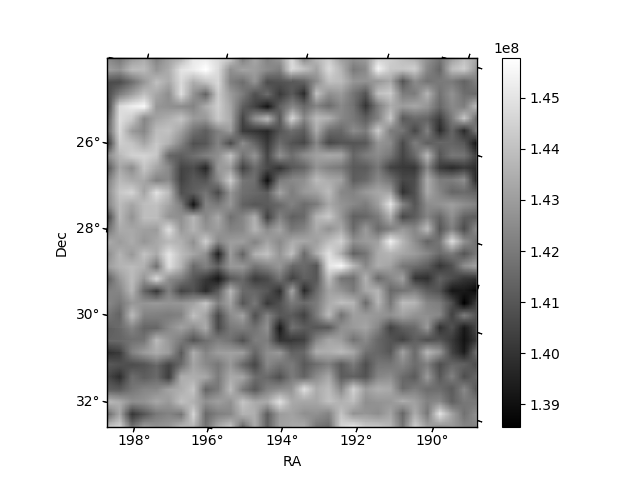
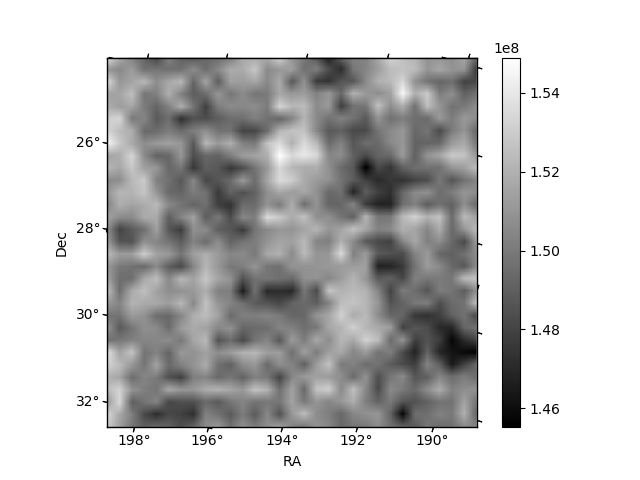
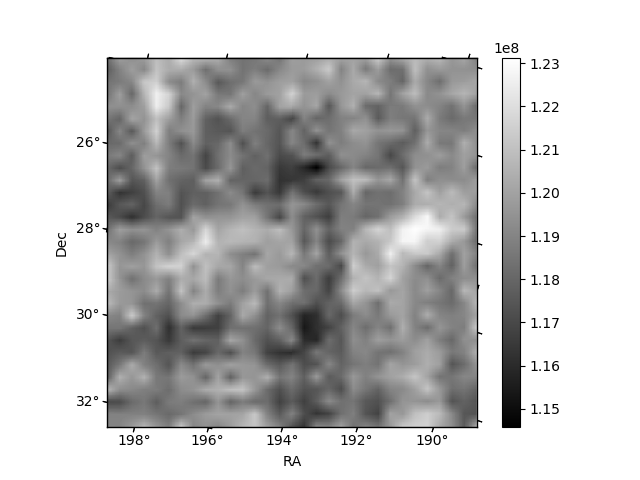
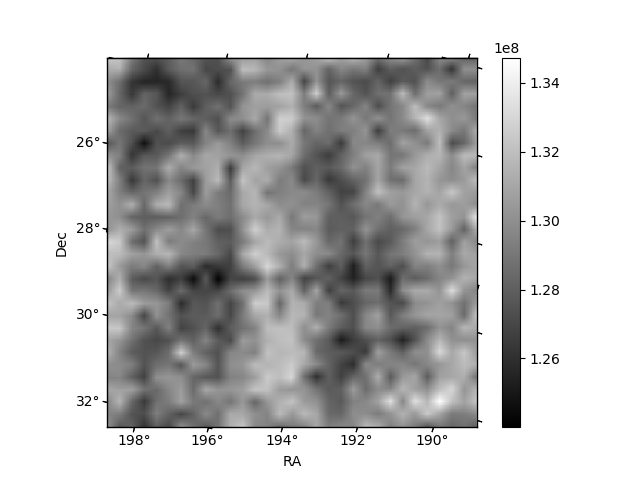
Histogram calculated using DETX and DETY for each event in the final _common_clean file
| Quadrant A | 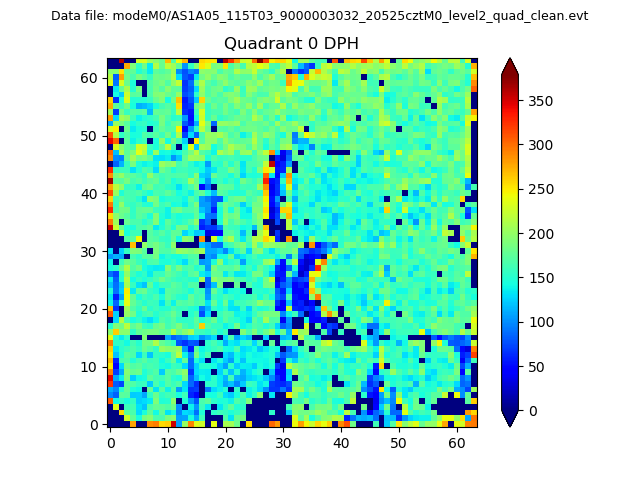 |
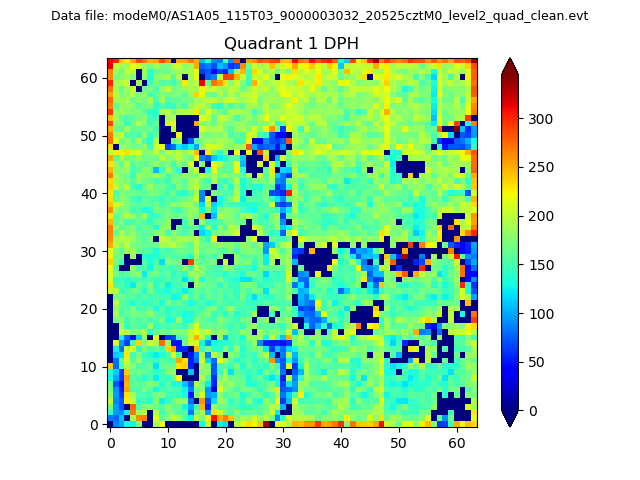 |
Quadrant B |
|---|---|---|---|
| Quadrant D | 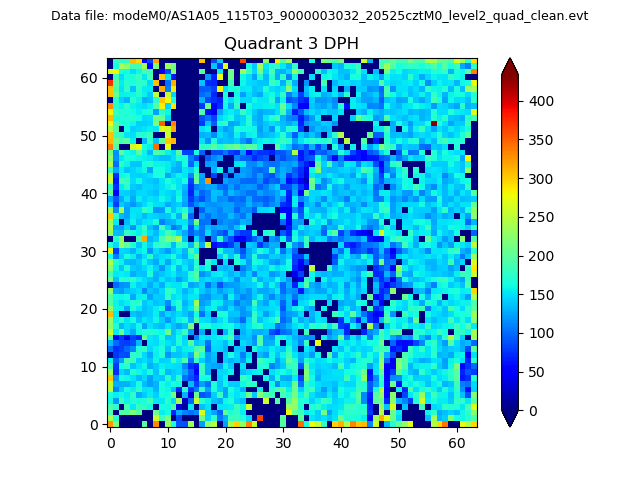 |
 |
Quadrant C |
| Plot type | Count rate plots | Images |
|---|---|---|
| Comparison with Poisson distribution Blue bars denote a histogram of data divided into 1 sec bins. Red curve is a Poisson curve with rate = median count rate of data. |
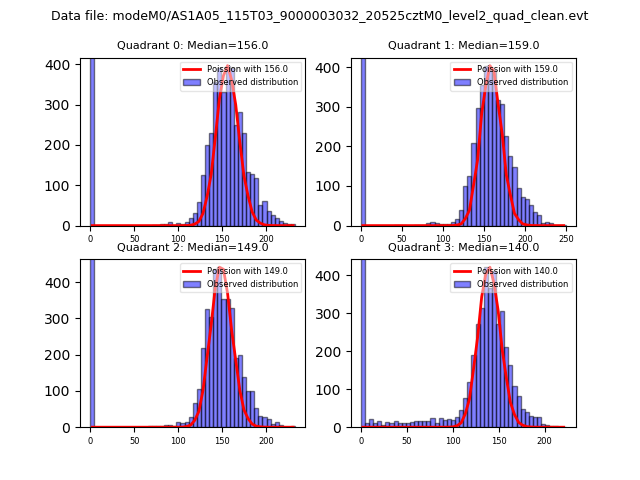 |
 |
| Quadrant-wise count rates Data is divided into 100 sec bins |
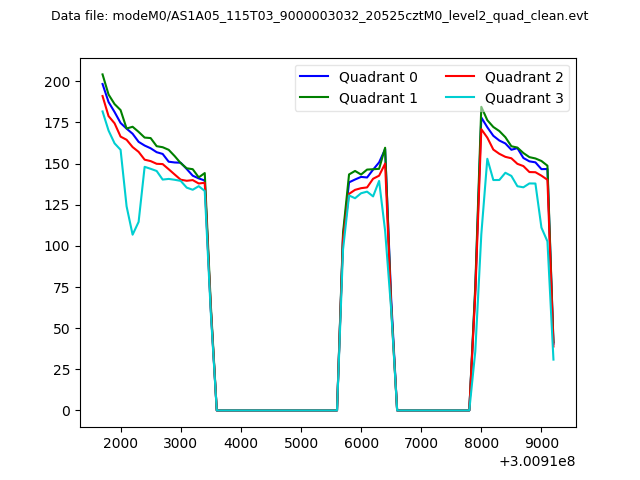 |
|
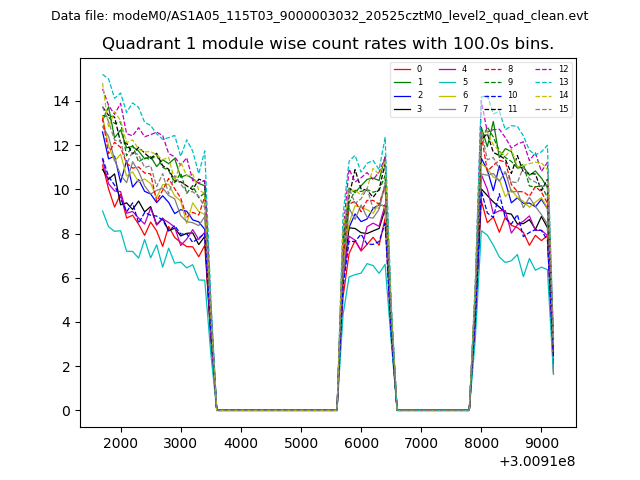
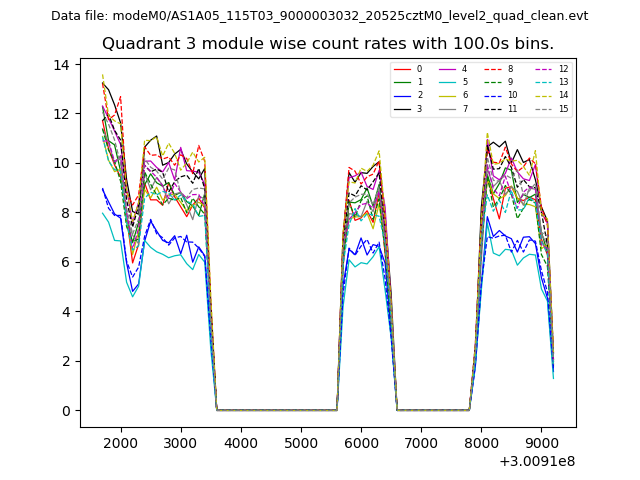
| Module-wise count rates for Quadrant A Data is divided into 100 sec bins |
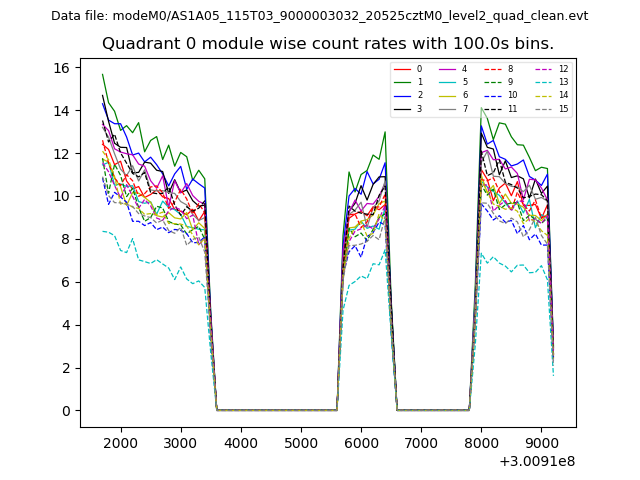 |
 |
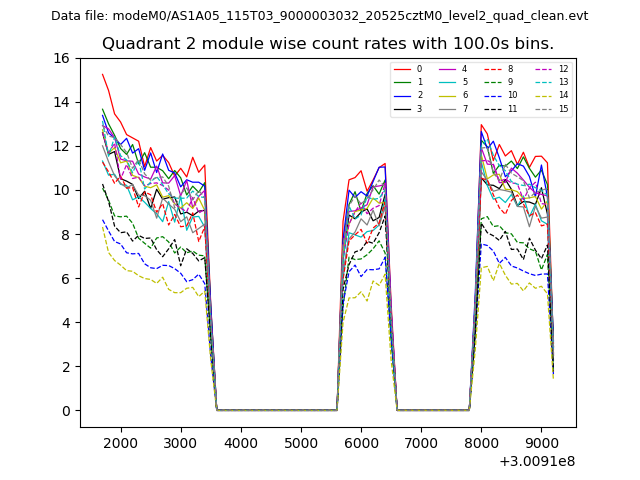
| Module-wise count rates for Quadrant B Data is divided into 100 sec bins |
 |
 |
| Module-wise count rates for Quadrant C Data is divided into 100 sec bins |
 |
 |
| Module-wise count rates for Quadrant D Data is divided into 100 sec bins |
 |
 |
| Parameter | Plot |
|---|---|
| CZT HV Monitor | 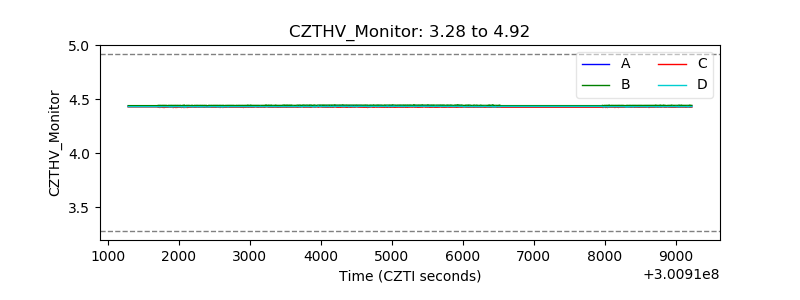 |
| D_VDD | 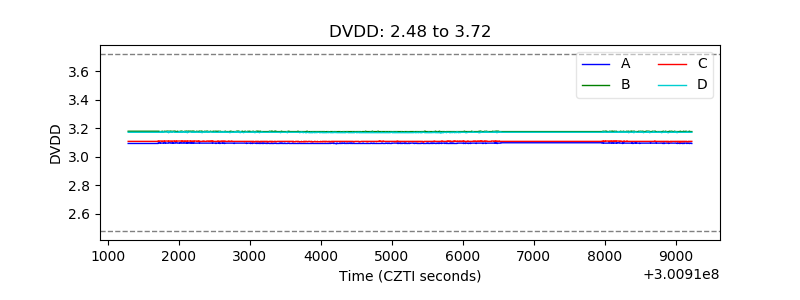 |
| Temperature 1 | 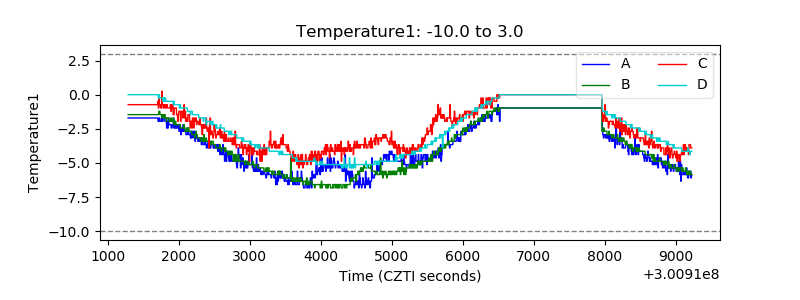 |
| Veto HV Monitor | 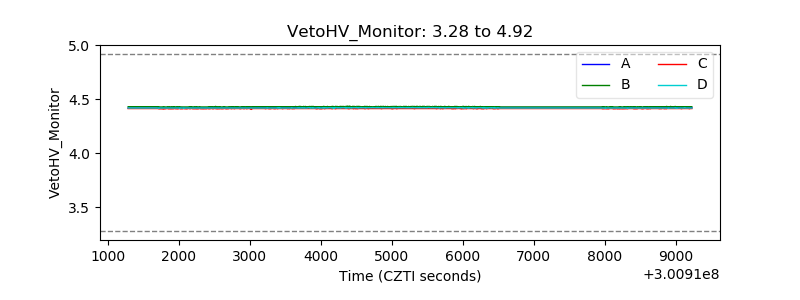 |
| Veto LLD | 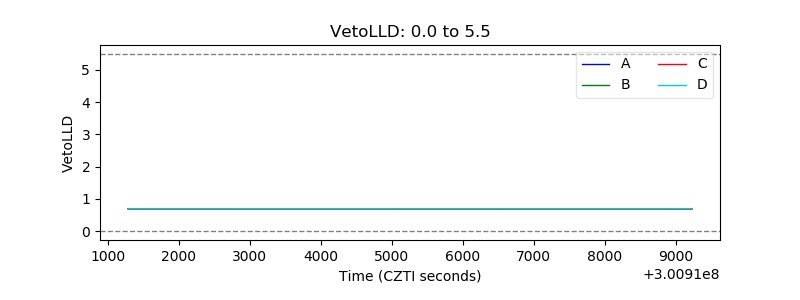 |
| Alpha Counter | 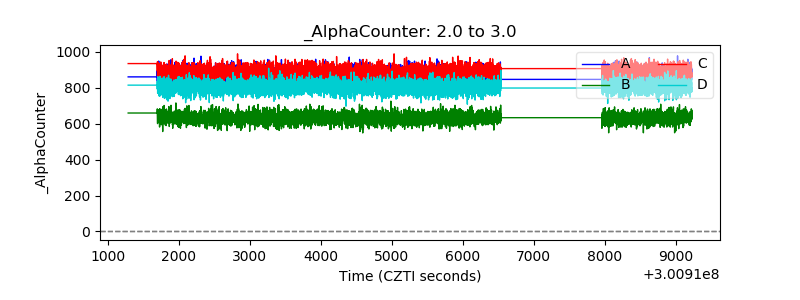 |
| _CPM_Rate | 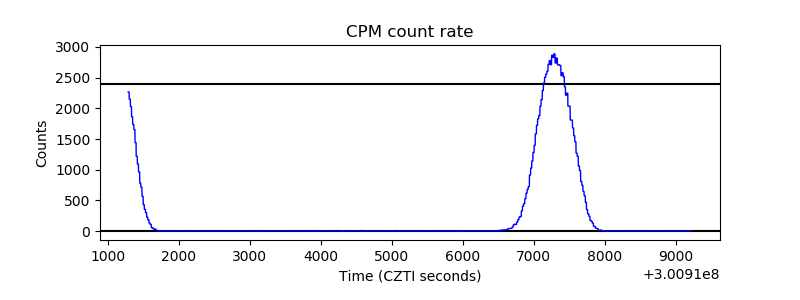 |
| CZT Counter | 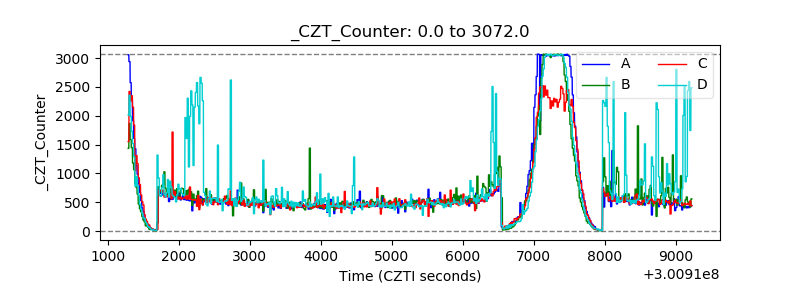 |
| +2.5 Volts monitor |  |
| +5 Volts monitor |  |
| _ROLL_ROT | 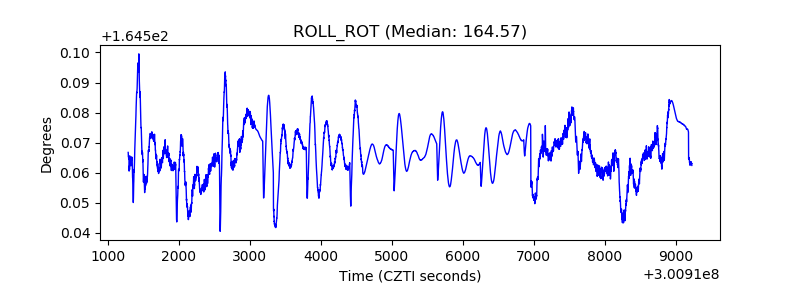 |
| _Roll_DEC | 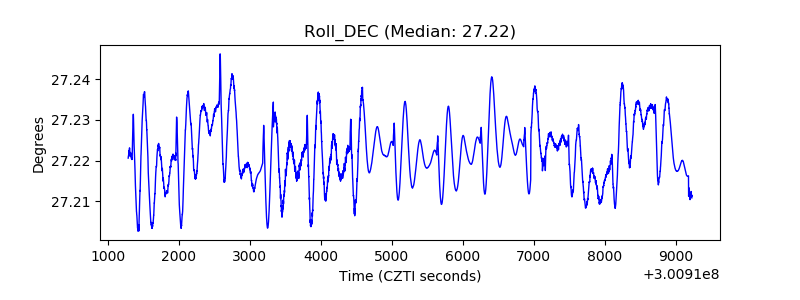 |
| _Roll_RA | 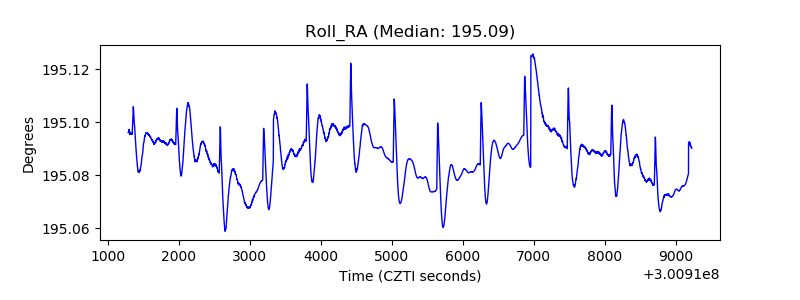 |
| Veto Counter | 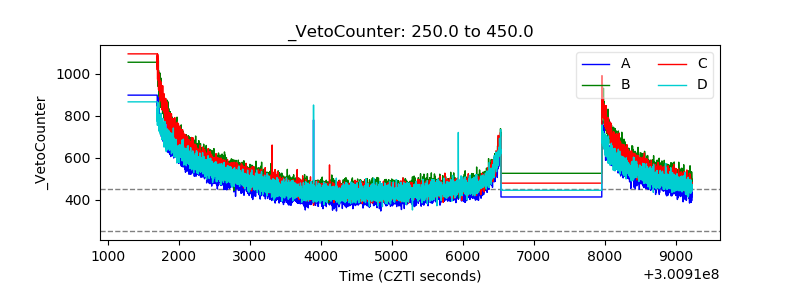 |