| Param | Original file | Final file |
|---|---|---|
| Filename | modeM0/AS1A05_115T03_9000003032_20526cztM0_level2.evt | modeM0/AS1A05_115T03_9000003032_20526cztM0_level2_quad_clean.evt |
| Size (bytes) | 525,493,440 | 84,369,600 |
| Size | 501.1 MB | 80.5 MB |
| Events in quadrant A | 3,011,530 | 560,213 |
| Events in quadrant B | 3,441,557 | 570,782 |
| Events in quadrant C | 3,037,631 | 536,264 |
| Events in quadrant D | 6,007,776 | 459,057 |
| Mode M9 | |||
|---|---|---|---|
| Quadrant | BADHDUFLAG | Total packets | Discarded packets |
| A | 0 | 18 | 0 |
| B | 0 | 19 | 0 |
| C | 0 | 19 | 0 |
| D | 0 | 19 | 0 |
| Mode M0 | |||
|---|---|---|---|
| Quadrant | BADHDUFLAG | Total packets | Discarded packets |
| A | 0 | 12738 | 2 |
| B | 0 | 13972 | 2 |
| C | 0 | 12768 | 2 |
| D | 0 | 22016 | 4 |
| Mode SS | |||
|---|---|---|---|
| Quadrant | BADHDUFLAG | Total packets | Discarded packets |
| A | 0 | 124 | 0 |
| B | 0 | 124 | 0 |
| C | 0 | 124 | 0 |
| D | 0 | 124 | 0 |
| Quadrant | Total seconds | Saturated seconds | Saturation percentage |
|---|---|---|---|
| A | 6136 | 14 | 0.228162% |
| B | 6136 | 69 | 1.124511% |
| C | 6136 | 36 | 0.586701% |
| D | 6135 | 848 | 13.822331% |
Noise dominated data is calculated using 1-second bins in cleaned event files. If a bin has >2000 counts, and if more than 50% of those come from <1% of pixels, then it is considered to be noise-dominated and hence unusable.
| Quadrant | # 1 sec bins | Bins with >0 counts | Bins with >2000 counts | High rate bins dominated by noise | Noise dominated (total time) | Noise dominated (detector-on time) | Marked lightcurve |
|---|---|---|---|---|---|---|---|
| A | 7495 | 6135 | 1 | 1 | 0.01% | 0.02% | 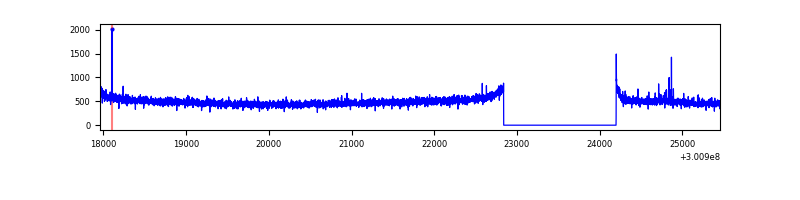 |
| B | 7496 | 6136 | 15 | 15 | 0.20% | 0.24% | 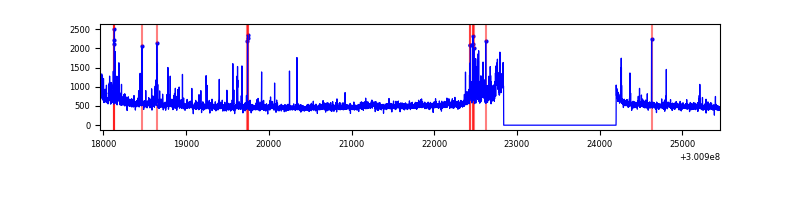 |
| C | 7496 | 6137 | 0 | 0 | 0.00% | 0.00% |  |
| D | 7495 | 6135 | 856 | 856 | 11.42% | 13.95% |  |
Top three noisy pixels from each quadrant. If the there are fewer than three noisy pixels in the level2.evt file, extra rows are filled as -1
| Pixel properties | Quadrant properties | ||||||
|---|---|---|---|---|---|---|---|
| Quadrant | DetID | PixID | Counts | Sigma | Mean | Median | Sigma |
| A | 14 | 254 | 13073 | 78.75 | 778 | 763 | 156.3 |
| A | 0 | 226 | 6789 | 38.55 | 778 | 763 | 156.3 |
| A | 3 | 137 | 5850 | 32.54 | 778 | 763 | 156.3 |
| B | 7 | 220 | 120840 | 823.85 | 784 | 766 | 145.7 |
| B | 0 | 189 | 90580 | 616.23 | 784 | 766 | 145.7 |
| B | 10 | 246 | 60546 | 410.16 | 784 | 766 | 145.7 |
| C | 14 | 238 | 117951 | 670.02 | 747 | 752 | 174.9 |
| C | 13 | 61 | 5185 | 25.34 | 747 | 752 | 174.9 |
| C | 8 | 208 | 3476 | 15.57 | 747 | 752 | 174.9 |
| D | 1 | 52 | 2393900 | 14144.59 | 694 | 674 | 169.2 |
| D | 12 | 238 | 309111 | 1822.94 | 694 | 674 | 169.2 |
| D | 13 | 153 | 298299 | 1759.04 | 694 | 674 | 169.2 |
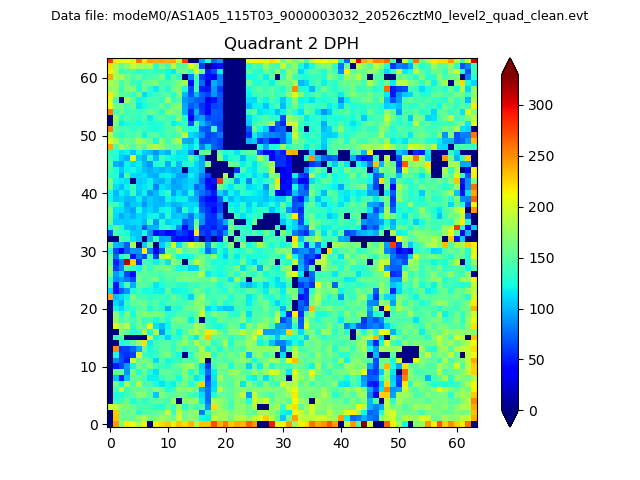
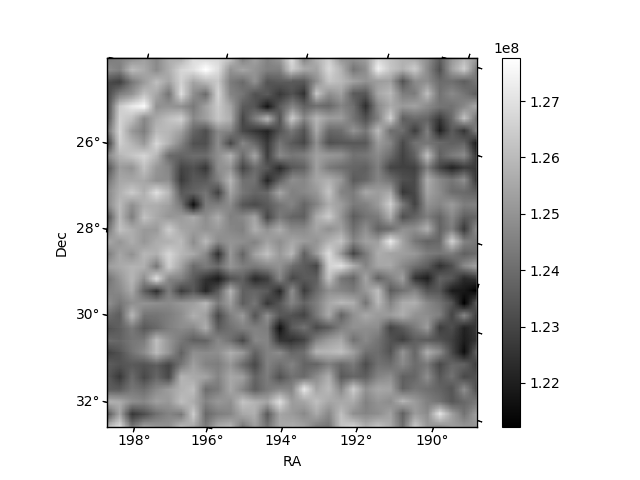
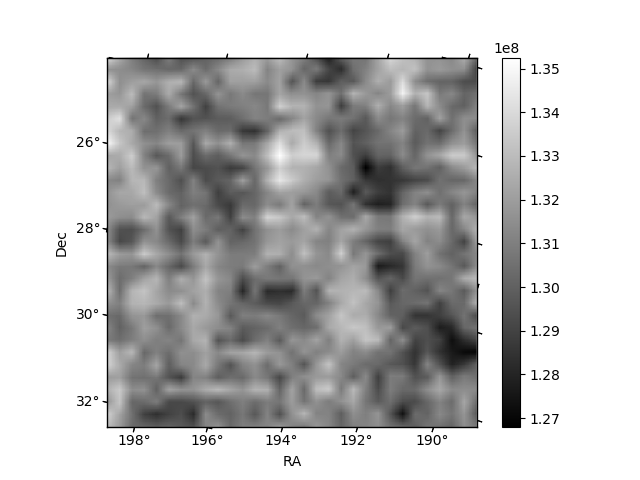
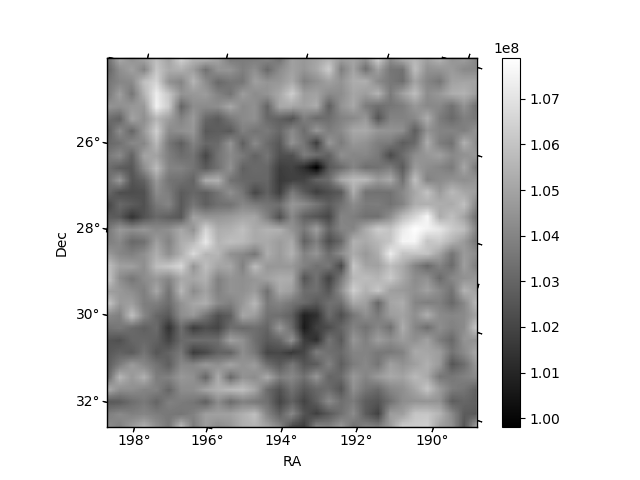
Histogram calculated using DETX and DETY for each event in the final _common_clean file
| Quadrant A | 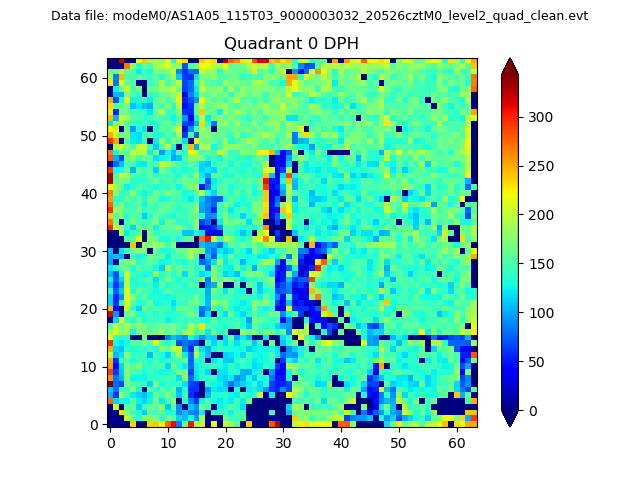 |
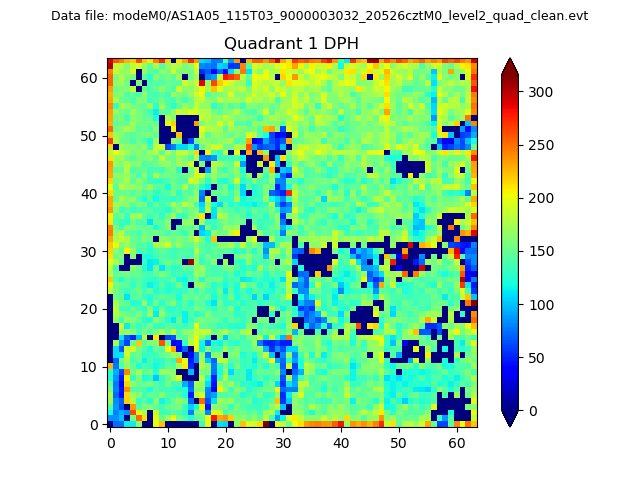 |
Quadrant B |
|---|---|---|---|
| Quadrant D | 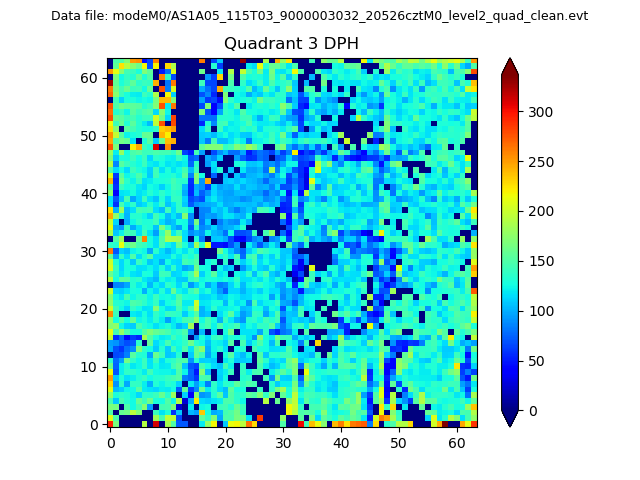 |
 |
Quadrant C |
| Plot type | Count rate plots | Images |
|---|---|---|
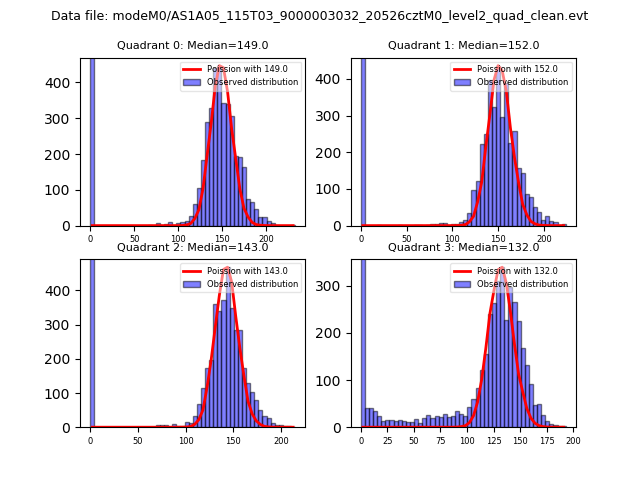
| Comparison with Poisson distribution Blue bars denote a histogram of data divided into 1 sec bins. Red curve is a Poisson curve with rate = median count rate of data. |
 |
 |
| Quadrant-wise count rates Data is divided into 100 sec bins |
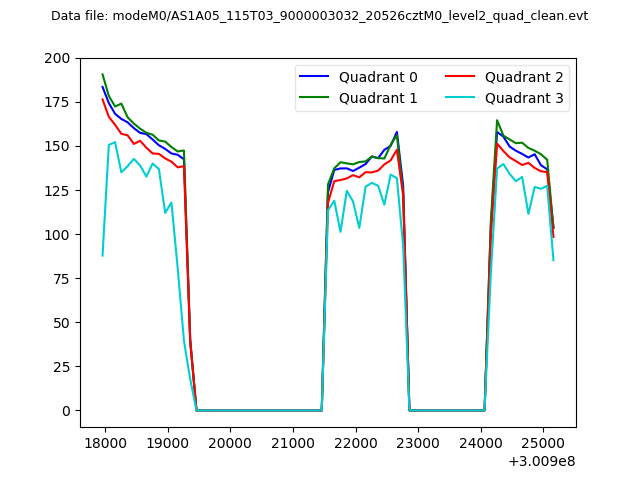 |
|
| Module-wise count rates for Quadrant A Data is divided into 100 sec bins |
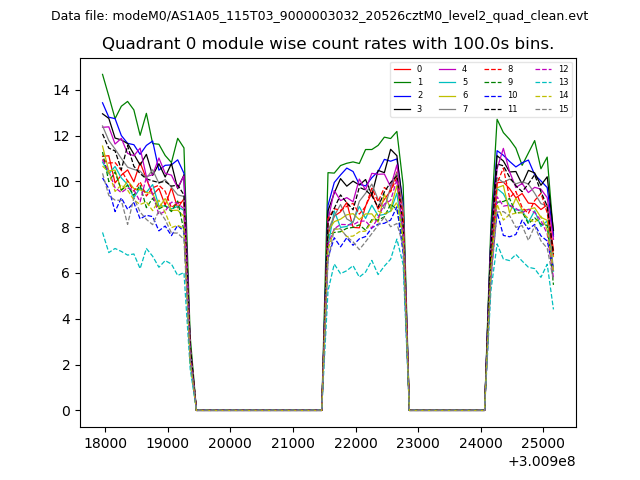 |
 |
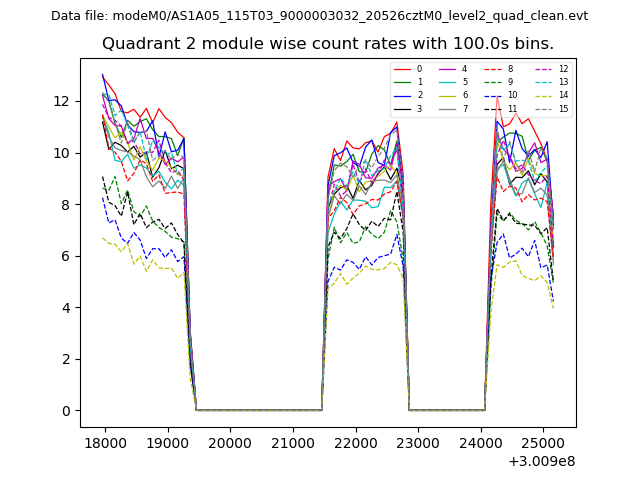
| Module-wise count rates for Quadrant B Data is divided into 100 sec bins |
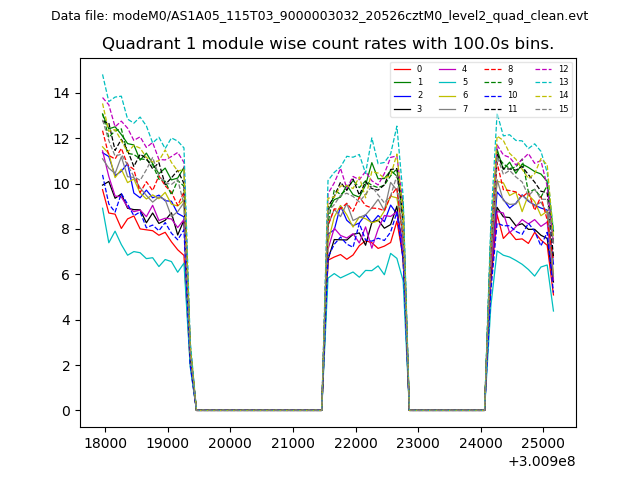 |
 |
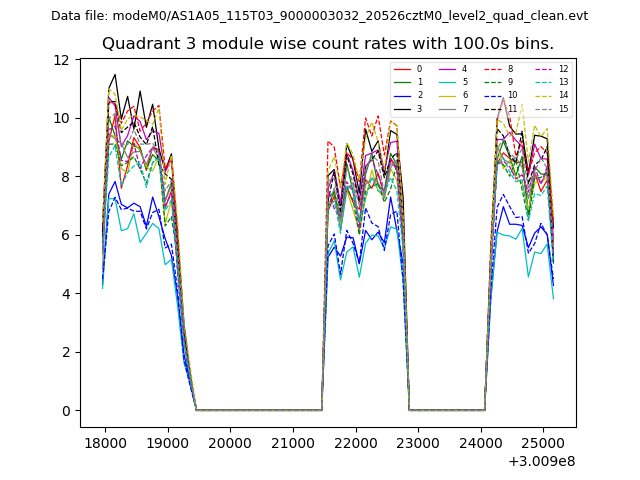
| Module-wise count rates for Quadrant C Data is divided into 100 sec bins |
 |
 |
| Module-wise count rates for Quadrant D Data is divided into 100 sec bins |
 |
 |
| Parameter | Plot |
|---|---|
| CZT HV Monitor | 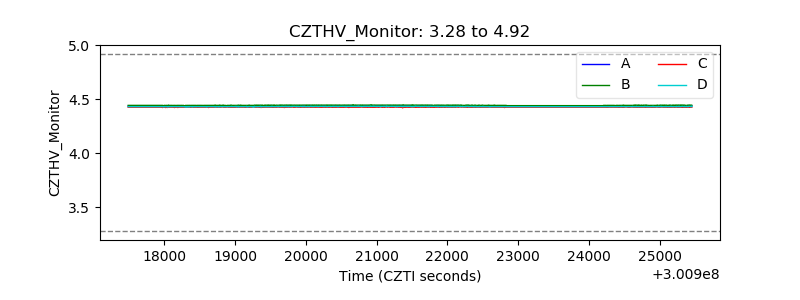 |
| D_VDD | 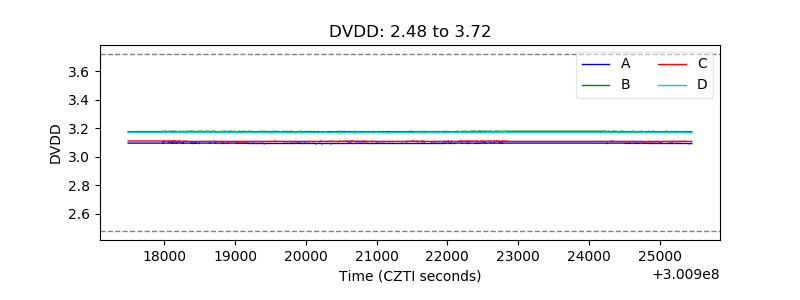 |
| Temperature 1 | 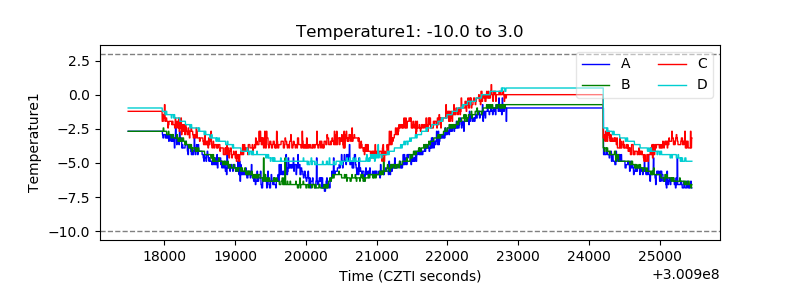 |
| Veto HV Monitor | 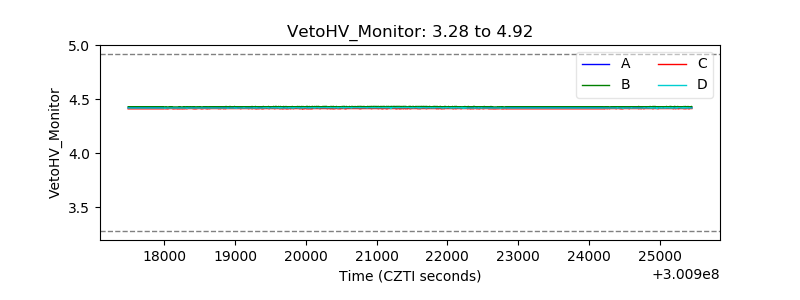 |
| Veto LLD | 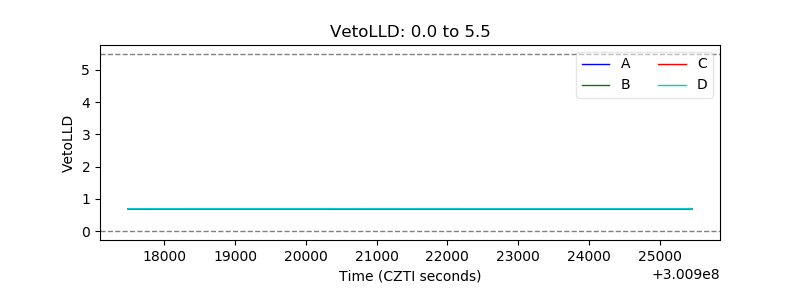 |
| Alpha Counter | 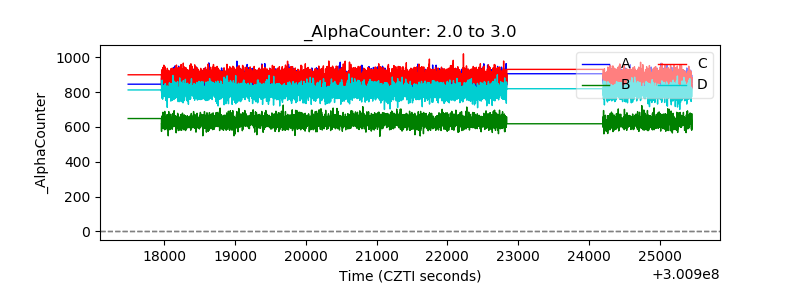 |
| _CPM_Rate | 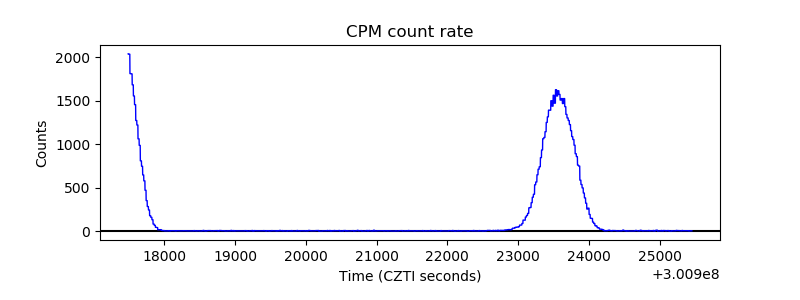 |
| CZT Counter | 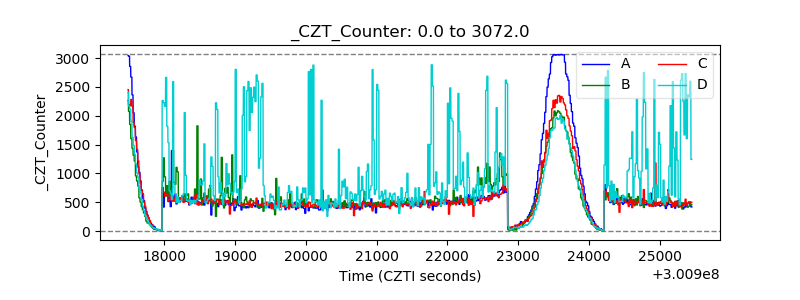 |
| +2.5 Volts monitor |  |
| +5 Volts monitor |  |
| _ROLL_ROT | 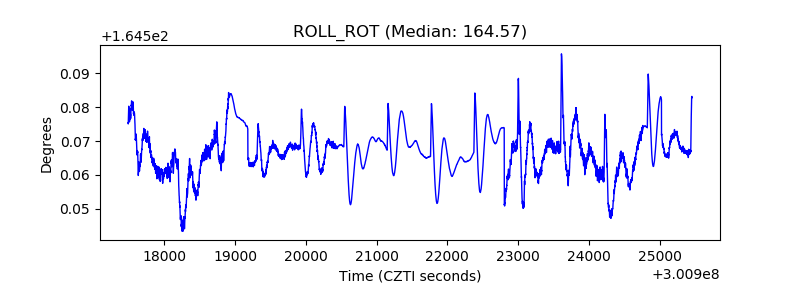 |
| _Roll_DEC | 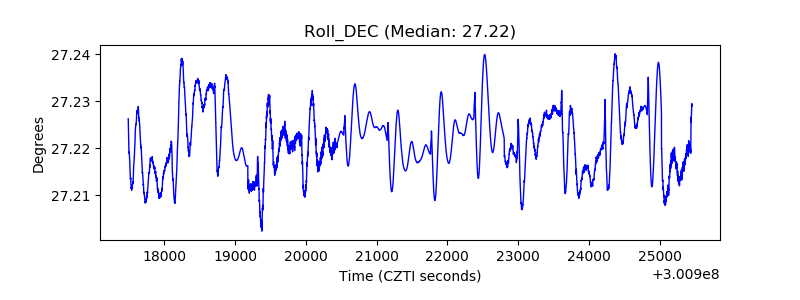 |
| _Roll_RA | 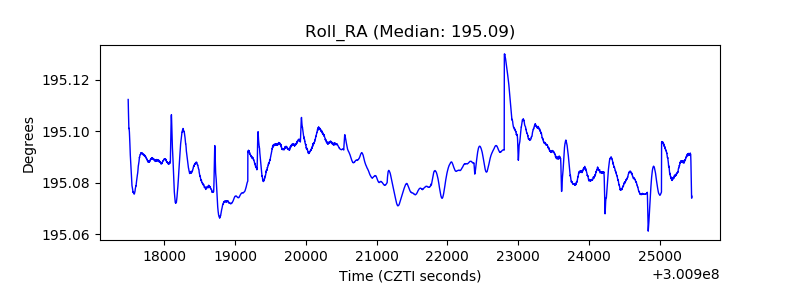 |
| Veto Counter | 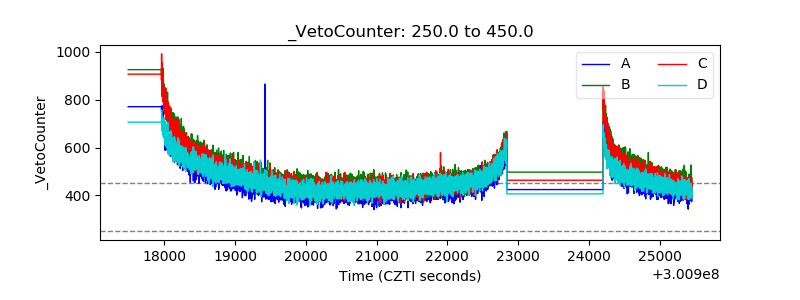 |