| Param | Original file | Final file |
|---|---|---|
| Filename | modeM0/AS1A05_115T03_9000003032_20529cztM0_level2.evt | modeM0/AS1A05_115T03_9000003032_20529cztM0_level2_quad_clean.evt |
| Size (bytes) | 536,544,000 | 74,727,360 |
| Size | 511.7 MB | 71.3 MB |
| Events in quadrant A | 3,570,772 | 449,932 |
| Events in quadrant B | 3,795,416 | 450,796 |
| Events in quadrant C | 3,466,222 | 432,180 |
| Events in quadrant D | 4,920,084 | 420,380 |
| Mode M9 | |||
|---|---|---|---|
| Quadrant | BADHDUFLAG | Total packets | Discarded packets |
| A | 0 | 3 | 0 |
| B | 0 | 3 | 0 |
| C | 0 | 3 | 0 |
| D | 0 | 3 | 0 |
| Mode M0 | |||
|---|---|---|---|
| Quadrant | BADHDUFLAG | Total packets | Discarded packets |
| A | 0 | 15463 | 1 |
| B | 0 | 15915 | 1 |
| C | 0 | 15072 | 1 |
| D | 0 | 19521 | 1 |
| Mode SS | |||
|---|---|---|---|
| Quadrant | BADHDUFLAG | Total packets | Discarded packets |
| A | 0 | 146 | 0 |
| B | 0 | 146 | 0 |
| C | 0 | 146 | 0 |
| D | 0 | 146 | 0 |
| Quadrant | Total seconds | Saturated seconds | Saturation percentage |
|---|---|---|---|
| A | 7323 | 177 | 2.417042% |
| B | 7324 | 166 | 2.266521% |
| C | 7324 | 150 | 2.048061% |
| D | 7324 | 463 | 6.321682% |
Noise dominated data is calculated using 1-second bins in cleaned event files. If a bin has >2000 counts, and if more than 50% of those come from <1% of pixels, then it is considered to be noise-dominated and hence unusable.
| Quadrant | # 1 sec bins | Bins with >0 counts | Bins with >2000 counts | High rate bins dominated by noise | Noise dominated (total time) | Noise dominated (detector-on time) | Marked lightcurve |
|---|---|---|---|---|---|---|---|
| A | 7573 | 7323 | 19 | 19 | 0.25% | 0.26% |  |
| B | 7573 | 7323 | 3 | 3 | 0.04% | 0.04% |  |
| C | 7573 | 7323 | 0 | 0 | 0.00% | 0.00% | 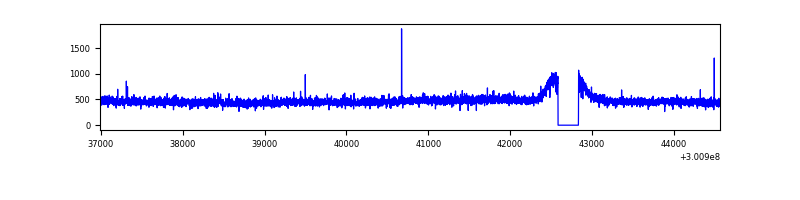 |
| D | 7574 | 7324 | 290 | 290 | 3.83% | 3.96% | 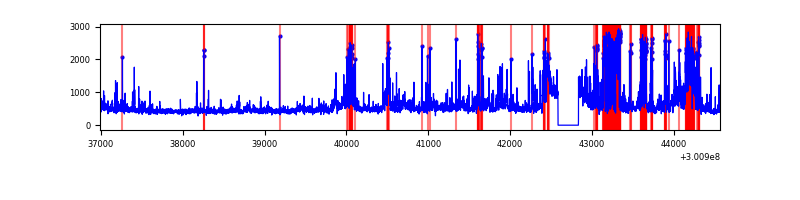 |
Top three noisy pixels from each quadrant. If the there are fewer than three noisy pixels in the level2.evt file, extra rows are filled as -1
| Pixel properties | Quadrant properties | ||||||
|---|---|---|---|---|---|---|---|
| Quadrant | DetID | PixID | Counts | Sigma | Mean | Median | Sigma |
| A | 14 | 254 | 149946 | 830.43 | 884 | 862 | 179.5 |
| A | 5 | 16 | 7625 | 37.67 | 884 | 862 | 179.5 |
| A | 0 | 226 | 7542 | 37.21 | 884 | 862 | 179.5 |
| B | 7 | 220 | 169348 | 987.95 | 887 | 864 | 170.5 |
| B | 0 | 189 | 44358 | 255.04 | 887 | 864 | 170.5 |
| B | 0 | 197 | 39482 | 226.45 | 887 | 864 | 170.5 |
| C | 14 | 238 | 131154 | 650.42 | 850 | 853 | 200.3 |
| C | 3 | 9 | 8039 | 35.87 | 850 | 853 | 200.3 |
| C | 3 | 233 | 7446 | 32.91 | 850 | 853 | 200.3 |
| D | 1 | 52 | 825736 | 3971.3 | 842 | 814 | 207.7 |
| D | 7 | 238 | 352175 | 1691.51 | 842 | 814 | 207.7 |
| D | 7 | 38 | 125451 | 600.02 | 842 | 814 | 207.7 |
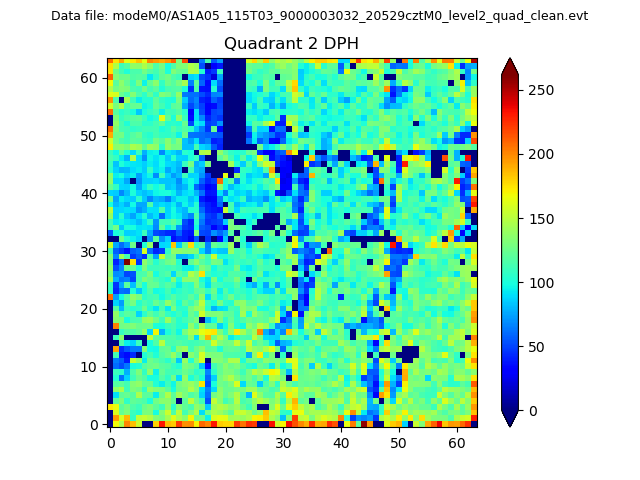
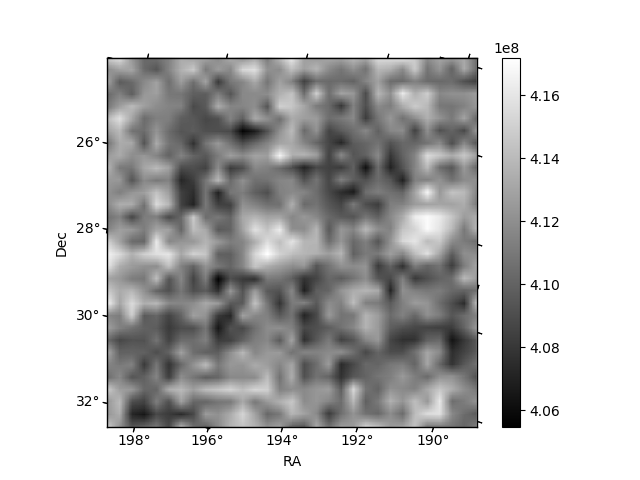
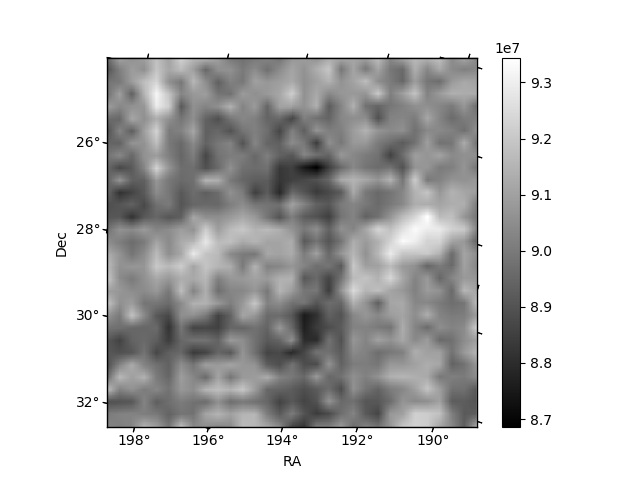
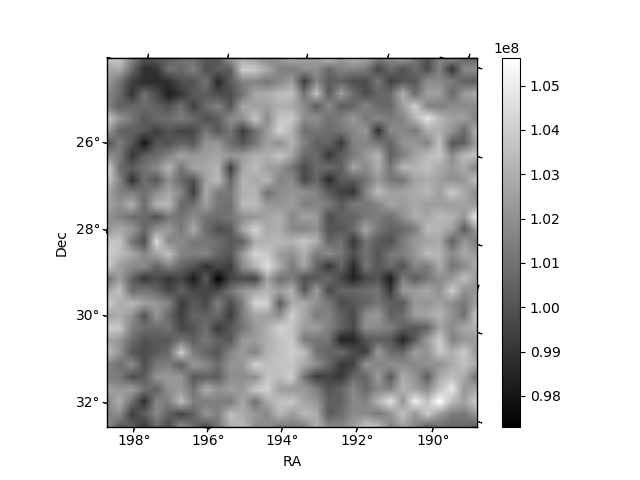
Histogram calculated using DETX and DETY for each event in the final _common_clean file
| Quadrant A |  |
 |
Quadrant B |
|---|---|---|---|
| Quadrant D | 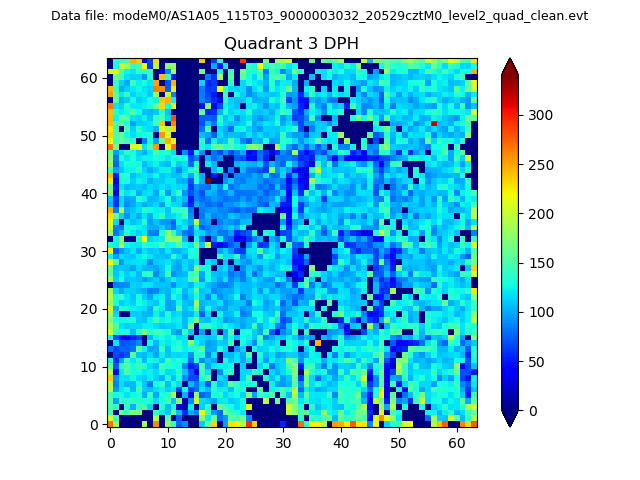 |
 |
Quadrant C |
| Plot type | Count rate plots | Images |
|---|---|---|
| Comparison with Poisson distribution Blue bars denote a histogram of data divided into 1 sec bins. Red curve is a Poisson curve with rate = median count rate of data. |
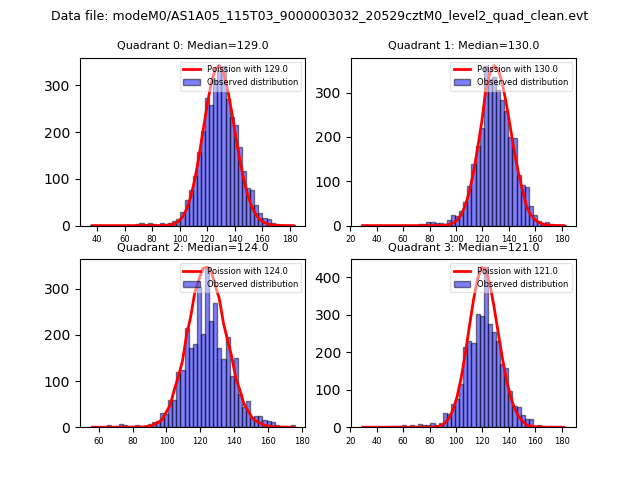 |
 |
| Quadrant-wise count rates Data is divided into 100 sec bins |
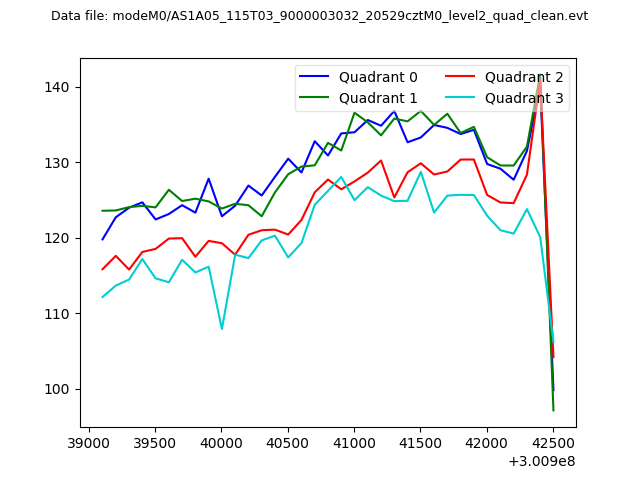 |
|
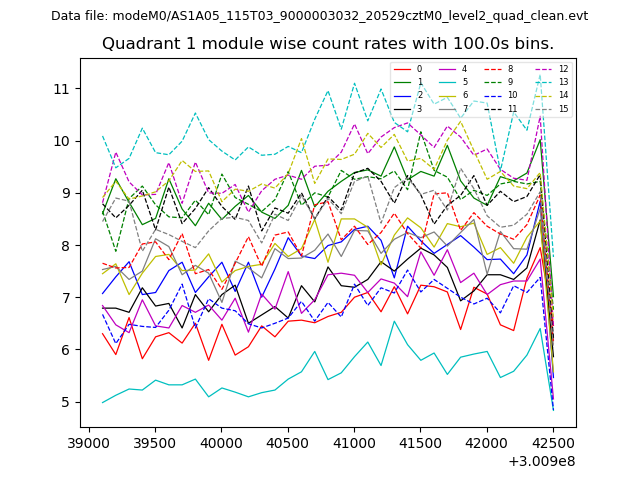
| Module-wise count rates for Quadrant A Data is divided into 100 sec bins |
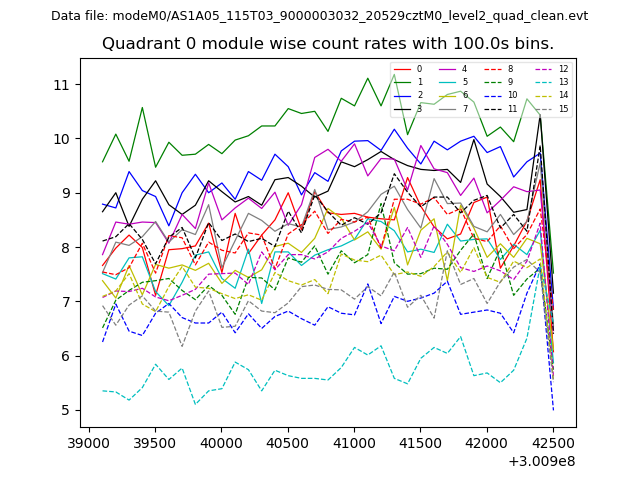 |
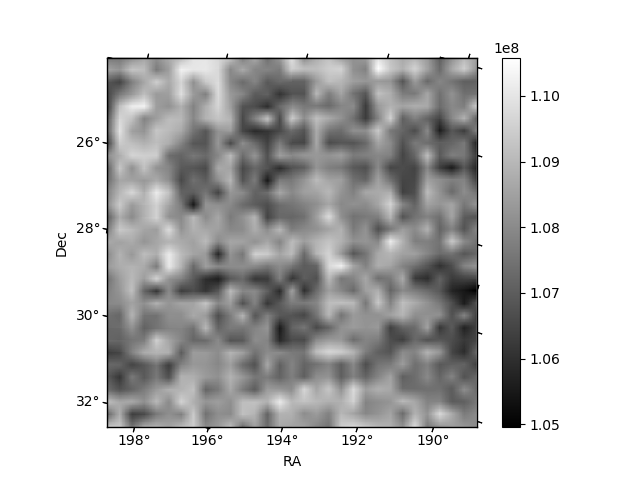 |
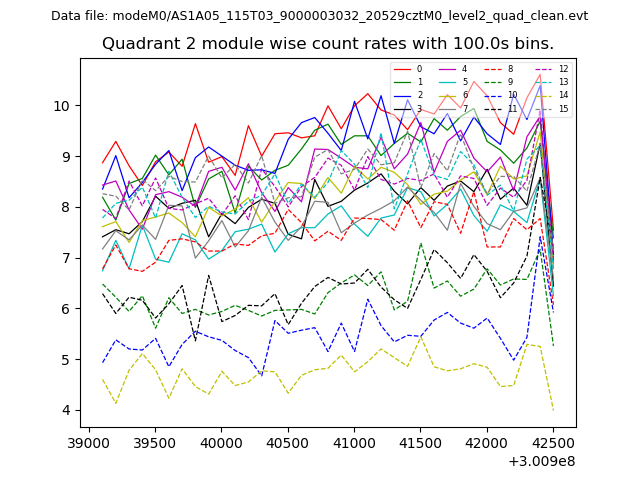
| Module-wise count rates for Quadrant B Data is divided into 100 sec bins |
 |
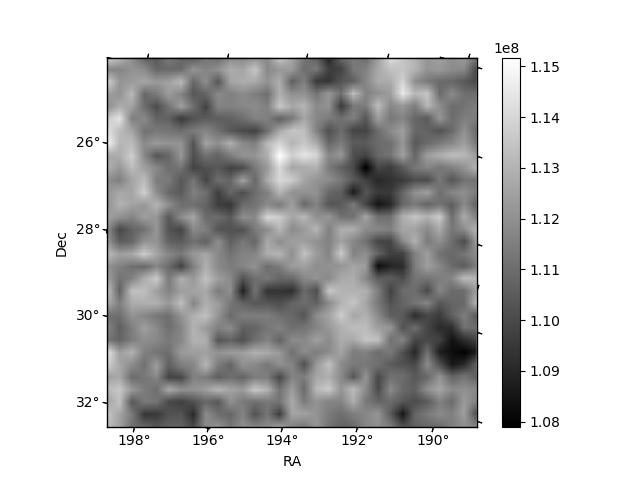 |
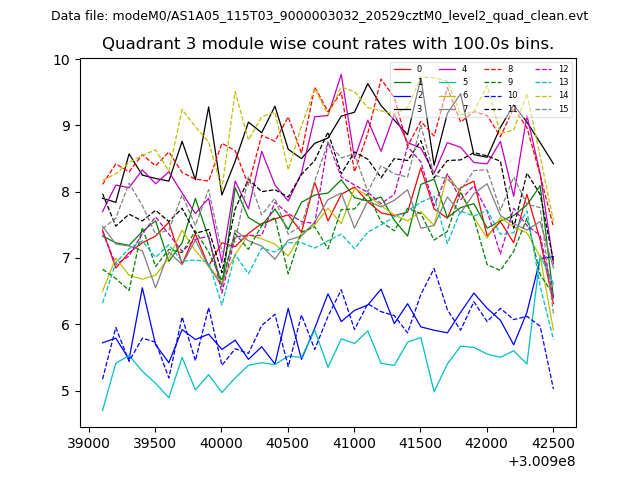
| Module-wise count rates for Quadrant C Data is divided into 100 sec bins |
 |
 |
| Module-wise count rates for Quadrant D Data is divided into 100 sec bins |
 |
 |
| Parameter | Plot |
|---|---|
| CZT HV Monitor | 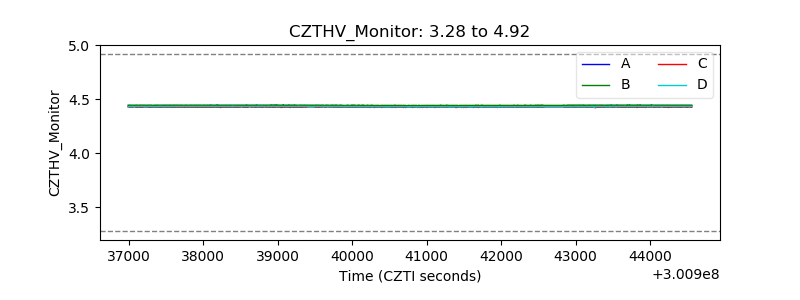 |
| D_VDD | 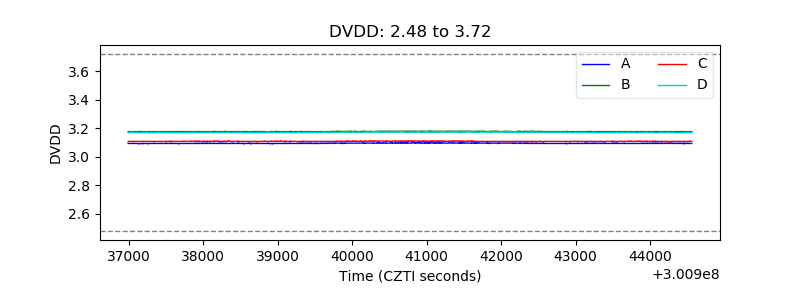 |
| Temperature 1 | 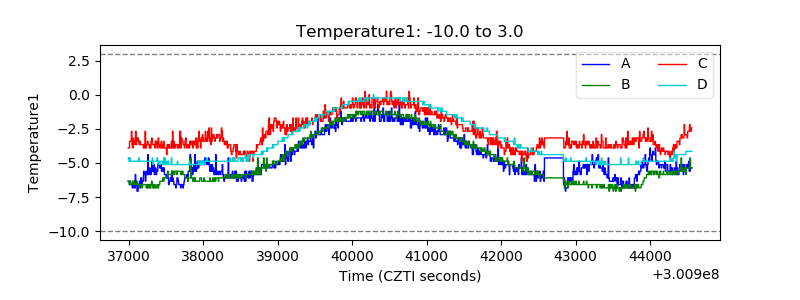 |
| Veto HV Monitor | 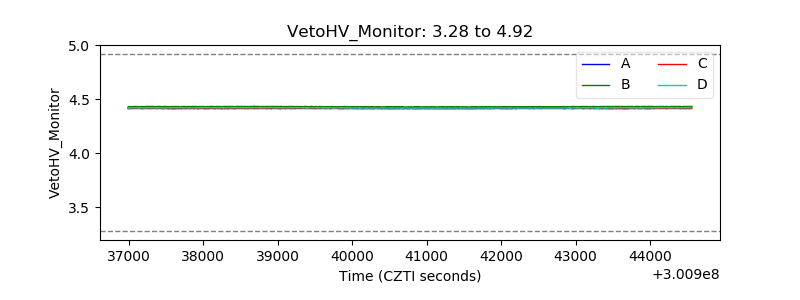 |
| Veto LLD | 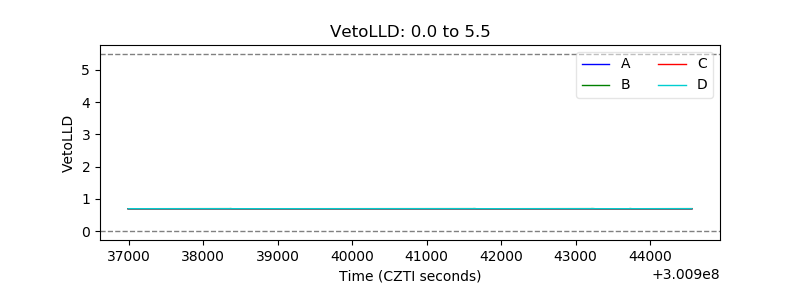 |
| Alpha Counter | 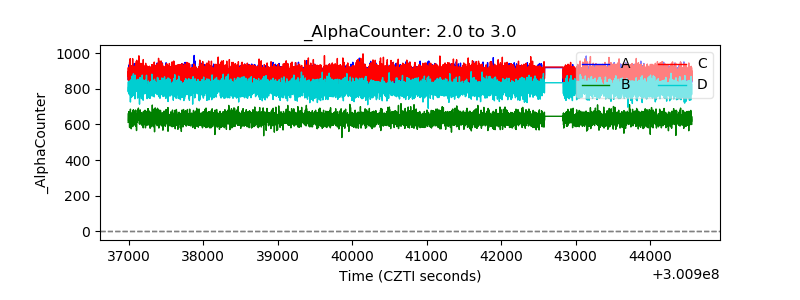 |
| _CPM_Rate | 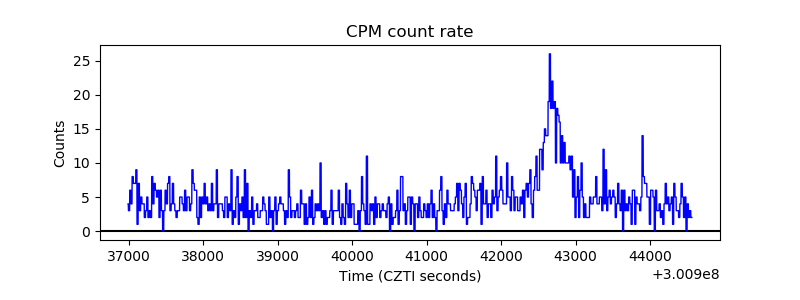 |
| CZT Counter | 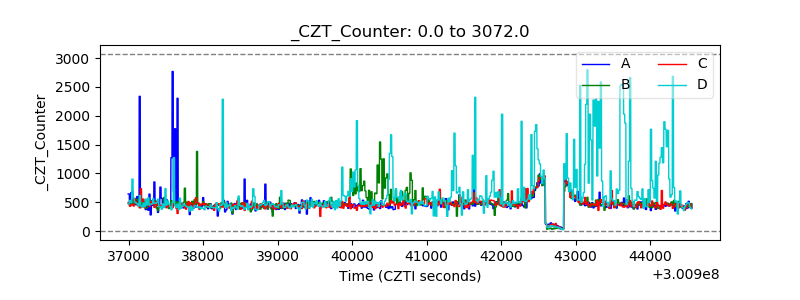 |
| +2.5 Volts monitor | 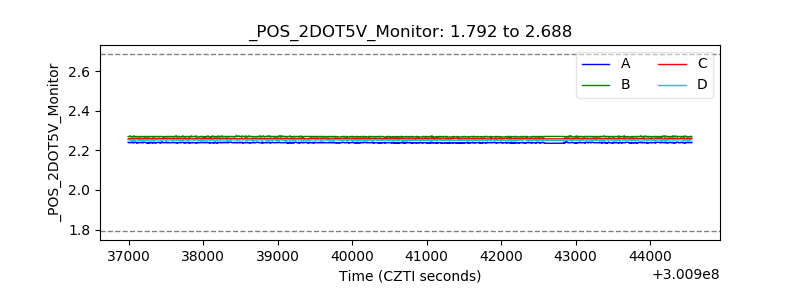 |
| +5 Volts monitor |  |
| _ROLL_ROT | 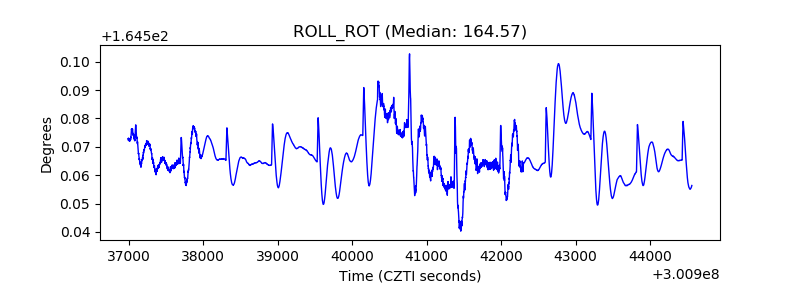 |
| _Roll_DEC | 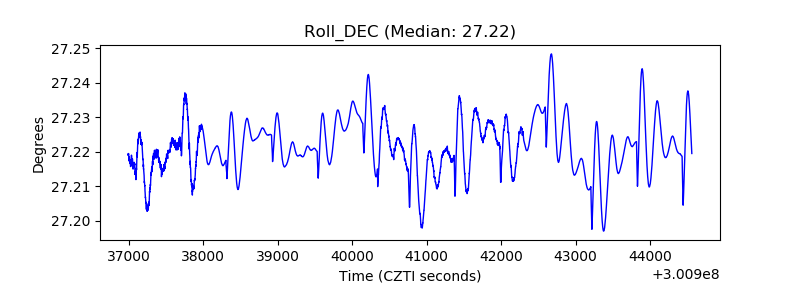 |
| _Roll_RA | 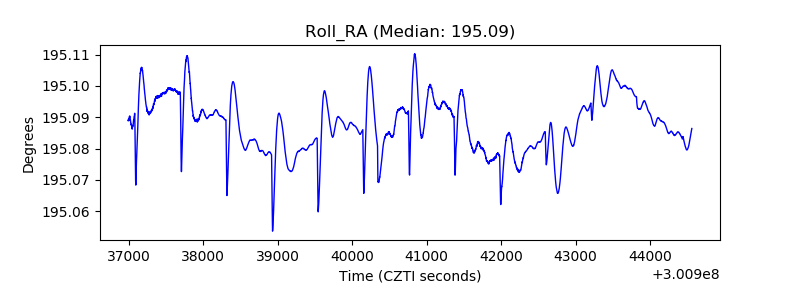 |
| Veto Counter | 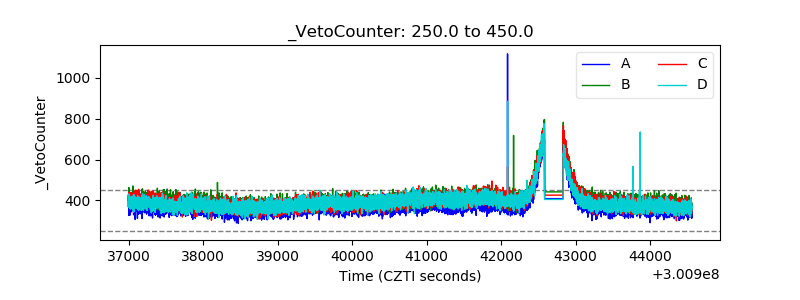 |