| Param | Original file | Final file |
|---|---|---|
| Filename | modeM0/AS1A05_115T03_9000003032_20530cztM0_level2.evt | modeM0/AS1A05_115T03_9000003032_20530cztM0_level2_quad_clean.evt |
| Size (bytes) | 597,240,000 | 76,714,560 |
| Size | 569.6 MB | 73.2 MB |
| Events in quadrant A | 3,561,685 | 462,930 |
| Events in quadrant B | 3,901,034 | 465,233 |
| Events in quadrant C | 3,627,877 | 445,595 |
| Events in quadrant D | 6,478,410 | 417,334 |
| Mode M9 | |||
|---|---|---|---|
| Quadrant | BADHDUFLAG | Total packets | Discarded packets |
| A | 0 | 2 | 0 |
| B | 0 | 2 | 0 |
| C | 0 | 2 | 0 |
| D | 0 | 2 | 0 |
| Mode M0 | |||
|---|---|---|---|
| Quadrant | BADHDUFLAG | Total packets | Discarded packets |
| A | 0 | 15658 | 1 |
| B | 0 | 16415 | 1 |
| C | 0 | 15732 | 1 |
| D | 0 | 24399 | 1 |
| Mode SS | |||
|---|---|---|---|
| Quadrant | BADHDUFLAG | Total packets | Discarded packets |
| A | 0 | 156 | 0 |
| B | 0 | 156 | 0 |
| C | 0 | 156 | 0 |
| D | 0 | 156 | 0 |
| Quadrant | Total seconds | Saturated seconds | Saturation percentage |
|---|---|---|---|
| A | 7640 | 187 | 2.447644% |
| B | 7641 | 214 | 2.800681% |
| C | 7641 | 204 | 2.669808% |
| D | 7641 | 762 | 9.972517% |
Noise dominated data is calculated using 1-second bins in cleaned event files. If a bin has >2000 counts, and if more than 50% of those come from <1% of pixels, then it is considered to be noise-dominated and hence unusable.
| Quadrant | # 1 sec bins | Bins with >0 counts | Bins with >2000 counts | High rate bins dominated by noise | Noise dominated (total time) | Noise dominated (detector-on time) | Marked lightcurve |
|---|---|---|---|---|---|---|---|
| A | 7819 | 7640 | 0 | 0 | 0.00% | 0.00% | 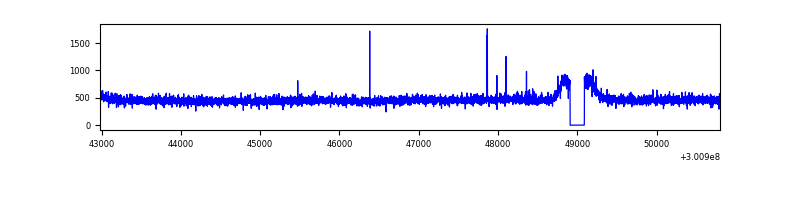 |
| B | 7821 | 7642 | 7 | 7 | 0.09% | 0.09% | 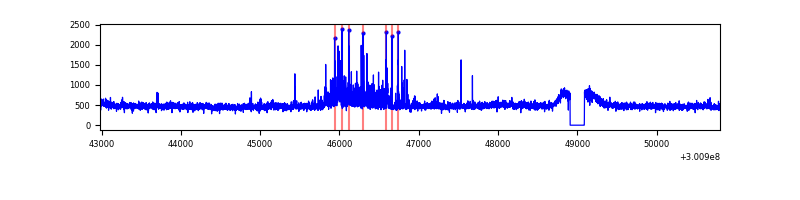 |
| C | 7820 | 7641 | 1 | 1 | 0.01% | 0.01% | 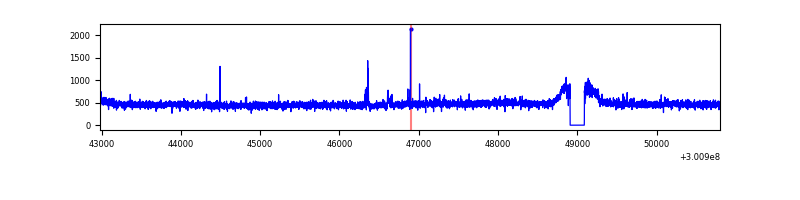 |
| D | 7821 | 7641 | 609 | 609 | 7.79% | 7.97% | 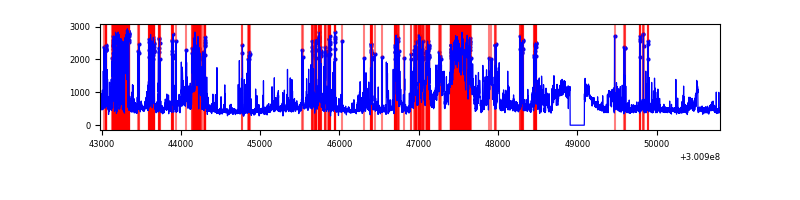 |
Top three noisy pixels from each quadrant. If the there are fewer than three noisy pixels in the level2.evt file, extra rows are filled as -1
| Pixel properties | Quadrant properties | ||||||
|---|---|---|---|---|---|---|---|
| Quadrant | DetID | PixID | Counts | Sigma | Mean | Median | Sigma |
| A | 5 | 16 | 11966 | 58.7 | 921 | 898 | 188.5 |
| A | 0 | 226 | 7884 | 37.05 | 921 | 898 | 188.5 |
| A | 3 | 137 | 7727 | 36.22 | 921 | 898 | 188.5 |
| B | 7 | 220 | 179800 | 1001.54 | 922 | 895 | 178.6 |
| B | 0 | 197 | 31315 | 170.3 | 922 | 895 | 178.6 |
| B | 12 | 111 | 21378 | 114.67 | 922 | 895 | 178.6 |
| C | 14 | 238 | 135737 | 644.75 | 885 | 886 | 209.2 |
| C | 8 | 208 | 13209 | 58.92 | 885 | 886 | 209.2 |
| C | 0 | 207 | 12619 | 56.1 | 885 | 886 | 209.2 |
| D | 1 | 52 | 1323274 | 6173.55 | 867 | 840 | 214.2 |
| D | 12 | 227 | 550252 | 2564.83 | 867 | 840 | 214.2 |
| D | 7 | 238 | 448447 | 2089.57 | 867 | 840 | 214.2 |
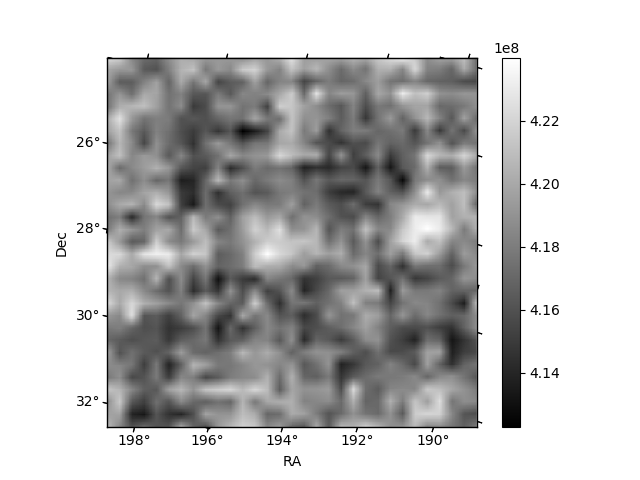
Histogram calculated using DETX and DETY for each event in the final _common_clean file
| Quadrant A | 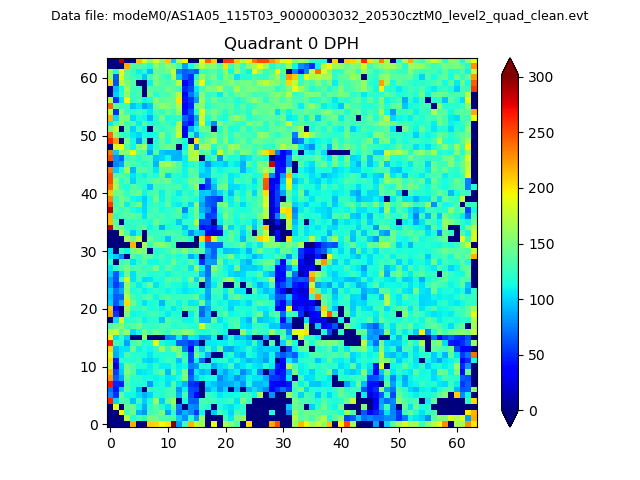 |
 |
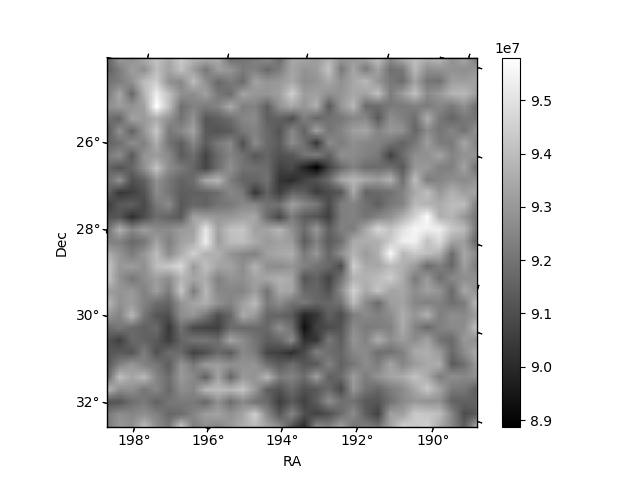
Quadrant B |
|---|---|---|---|
| Quadrant D | 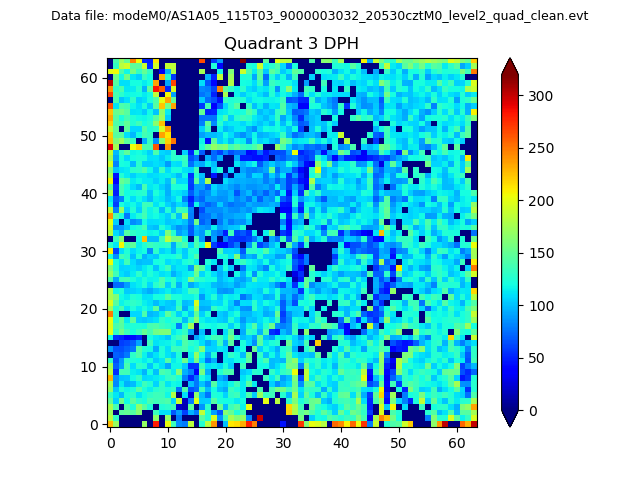 |
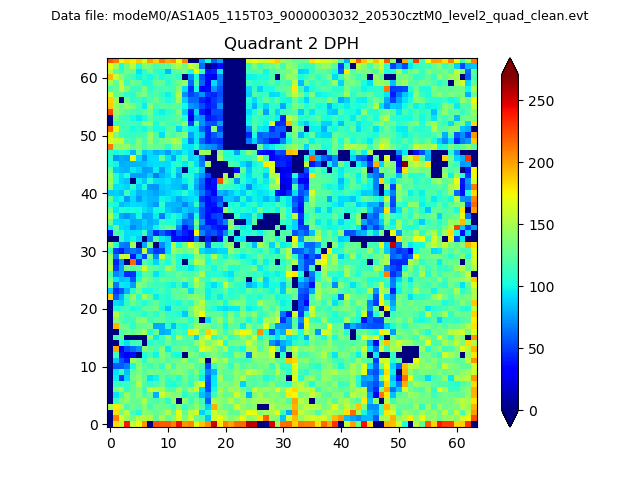 |
Quadrant C |
| Plot type | Count rate plots | Images |
|---|---|---|
| Comparison with Poisson distribution Blue bars denote a histogram of data divided into 1 sec bins. Red curve is a Poisson curve with rate = median count rate of data. |
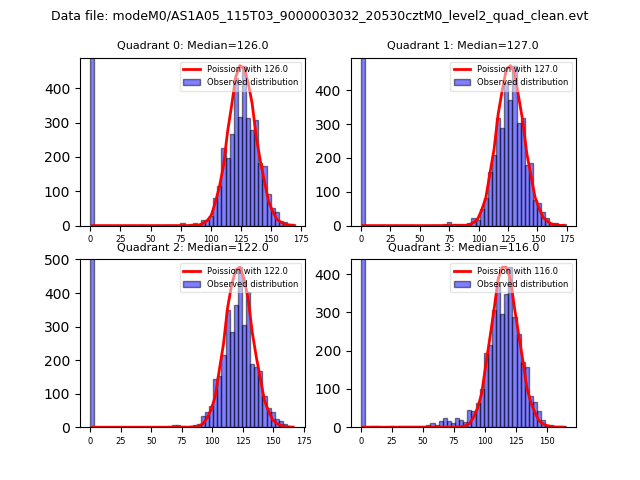 |
 |
| Quadrant-wise count rates Data is divided into 100 sec bins |
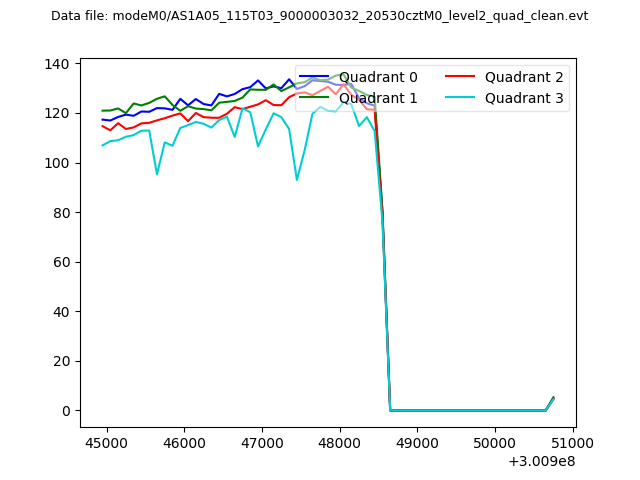 |
|
| Module-wise count rates for Quadrant A Data is divided into 100 sec bins |
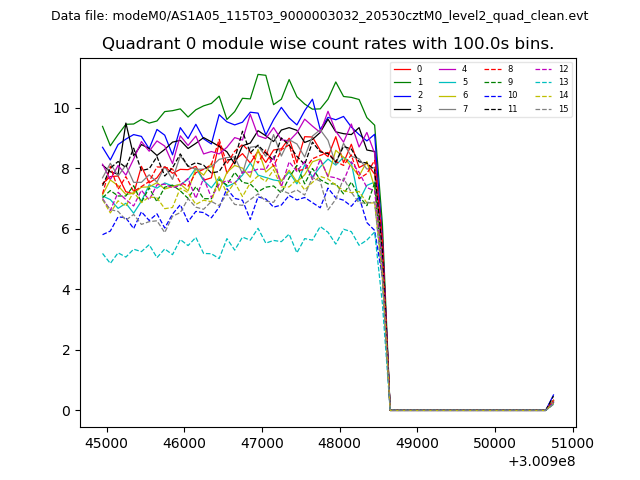 |
 |
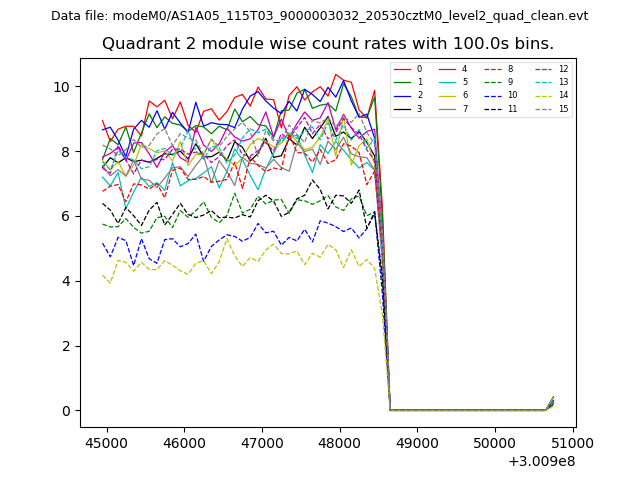
| Module-wise count rates for Quadrant B Data is divided into 100 sec bins |
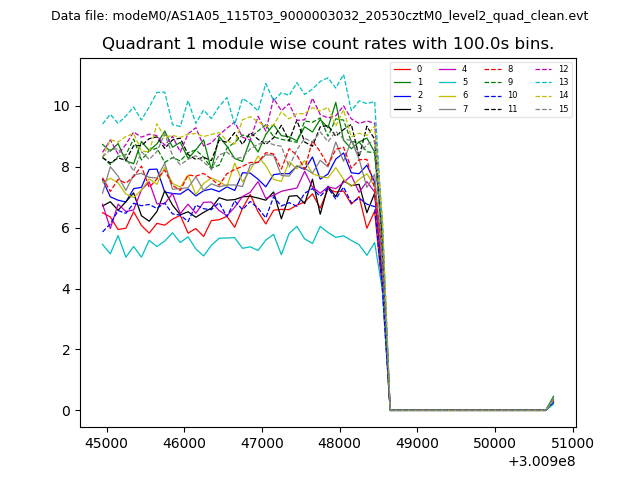 |
 |
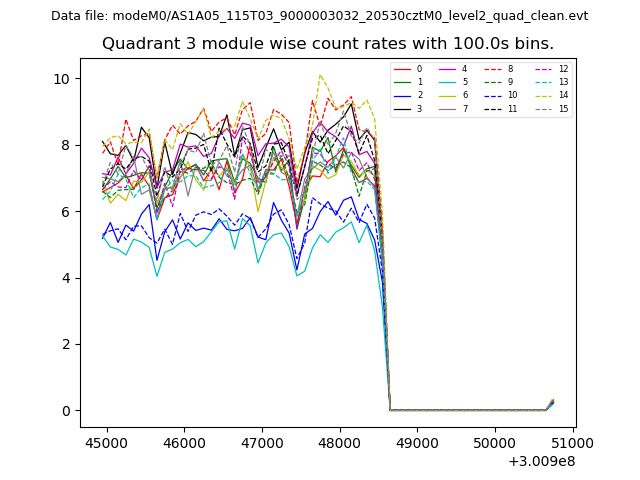
| Module-wise count rates for Quadrant C Data is divided into 100 sec bins |
 |
 |
| Module-wise count rates for Quadrant D Data is divided into 100 sec bins |
 |
 |
| Parameter | Plot |
|---|---|
| CZT HV Monitor | 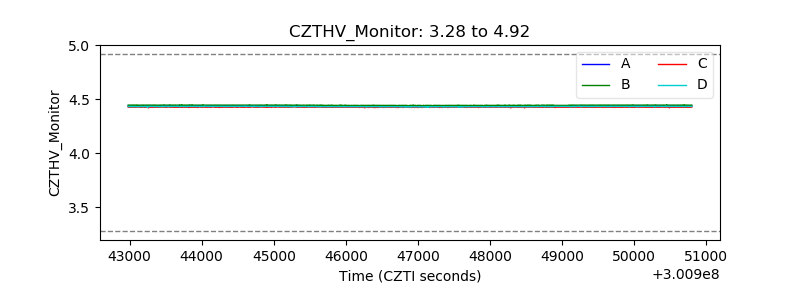 |
| D_VDD | 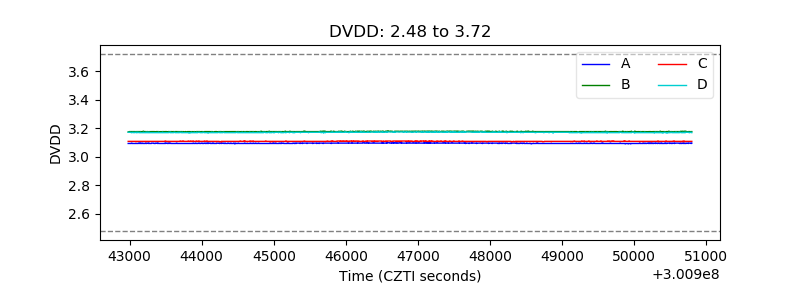 |
| Temperature 1 | 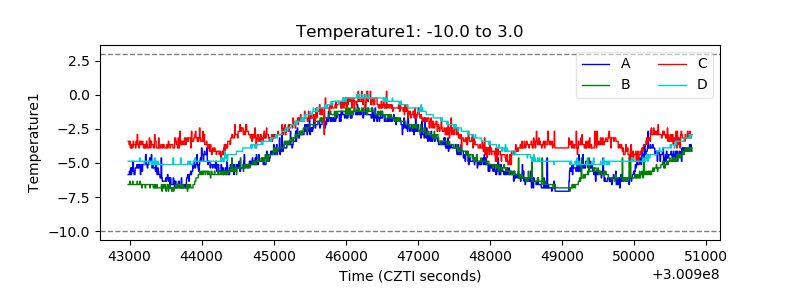 |
| Veto HV Monitor | 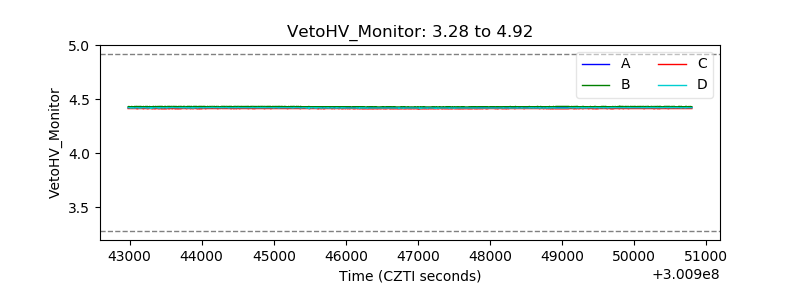 |
| Veto LLD | 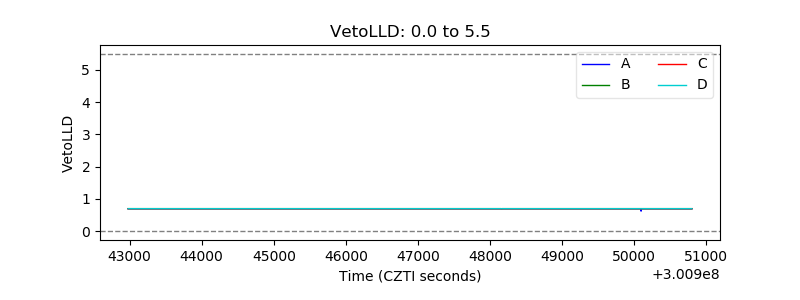 |
| Alpha Counter | 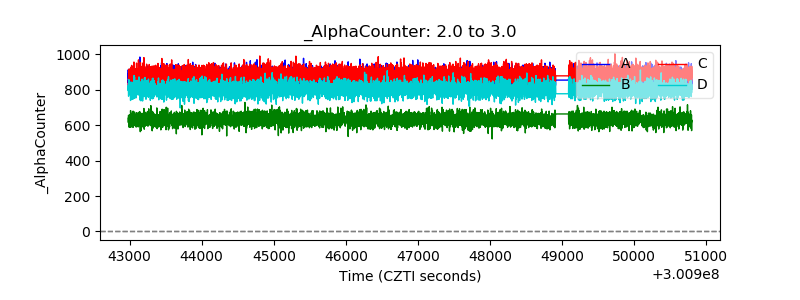 |
| _CPM_Rate | 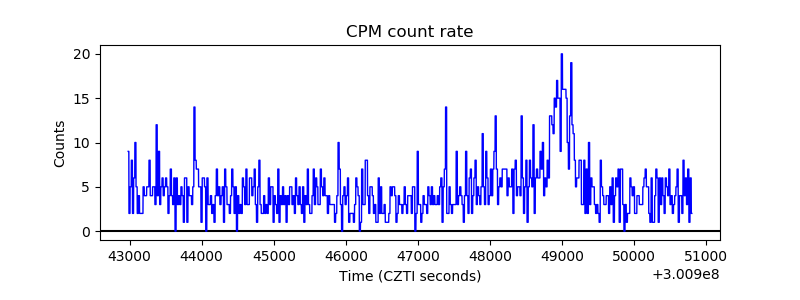 |
| CZT Counter | 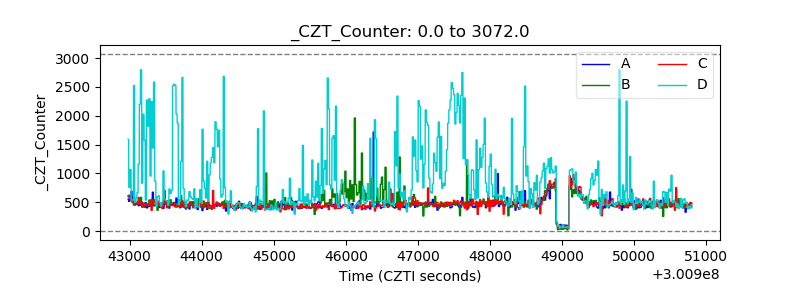 |
| +2.5 Volts monitor | 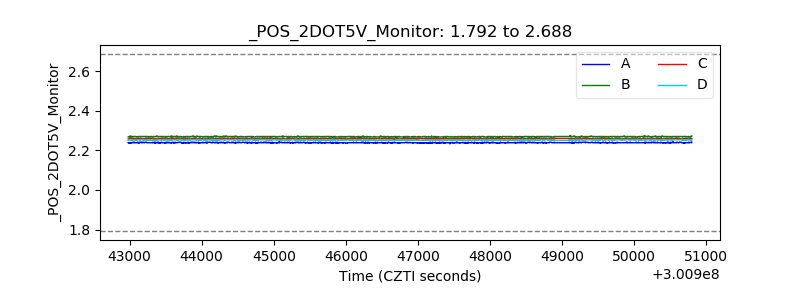 |
| +5 Volts monitor |  |
| _ROLL_ROT | 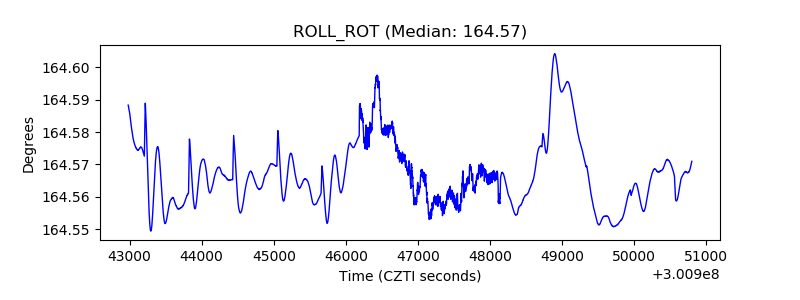 |
| _Roll_DEC | 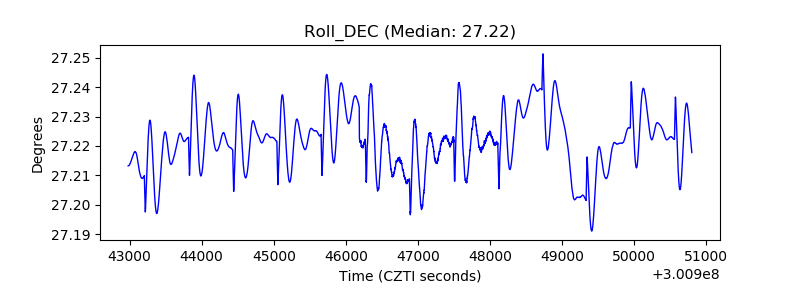 |
| _Roll_RA |  |
| Veto Counter | 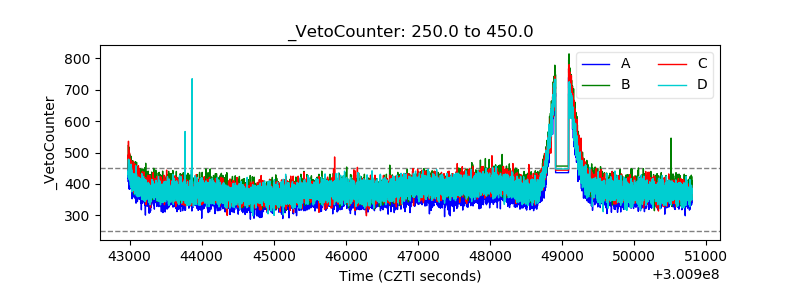 |