| Param | Original file | Final file |
|---|---|---|
| Filename | modeM0/AS1A05_115T03_9000003032_20533cztM0_level2.evt | modeM0/AS1A05_115T03_9000003032_20533cztM0_level2_quad_clean.evt |
| Size (bytes) | 1,562,339,520 | 236,983,680 |
| Size | 1.5 GB | 226.0 MB |
| Events in quadrant A | 9,918,874 | 1,529,600 |
| Events in quadrant B | 10,403,365 | 1,538,802 |
| Events in quadrant C | 9,085,500 | 1,473,873 |
| Events in quadrant D | 16,617,261 | 1,317,515 |
| Mode M9 | |||
|---|---|---|---|
| Quadrant | BADHDUFLAG | Total packets | Discarded packets |
| A | 0 | 17 | 0 |
| B | 0 | 17 | 0 |
| C | 0 | 17 | 0 |
| D | 0 | 17 | 0 |
| Mode M0 | |||
|---|---|---|---|
| Quadrant | BADHDUFLAG | Total packets | Discarded packets |
| A | 0 | 41882 | 4 |
| B | 0 | 42888 | 4 |
| C | 0 | 39366 | 4 |
| D | 0 | 62140 | 4 |
| Mode SS | |||
|---|---|---|---|
| Quadrant | BADHDUFLAG | Total packets | Discarded packets |
| A | 0 | 394 | 0 |
| B | 0 | 394 | 0 |
| C | 0 | 394 | 0 |
| D | 0 | 394 | 0 |
| Quadrant | Total seconds | Saturated seconds | Saturation percentage |
|---|---|---|---|
| A | 19104 | 530 | 2.774288% |
| B | 19104 | 545 | 2.852806% |
| C | 19104 | 460 | 2.407873% |
| D | 19104 | 2525 | 13.217127% |
Noise dominated data is calculated using 1-second bins in cleaned event files. If a bin has >2000 counts, and if more than 50% of those come from <1% of pixels, then it is considered to be noise-dominated and hence unusable.
| Quadrant | # 1 sec bins | Bins with >0 counts | Bins with >2000 counts | High rate bins dominated by noise | Noise dominated (total time) | Noise dominated (detector-on time) | Marked lightcurve |
|---|---|---|---|---|---|---|---|
| A | 20984 | 19108 | 110 | 110 | 0.52% | 0.58% | 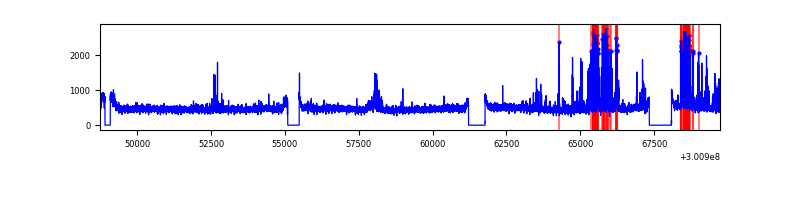 |
| B | 20984 | 19108 | 63 | 63 | 0.30% | 0.33% | 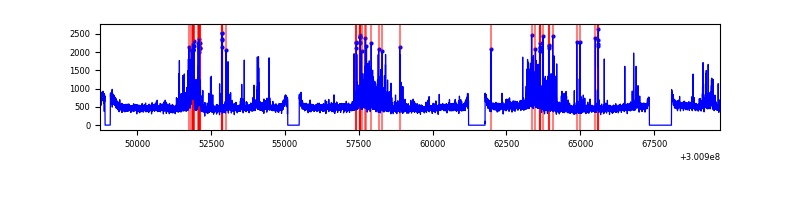 |
| C | 20984 | 19108 | 3 | 3 | 0.01% | 0.02% | 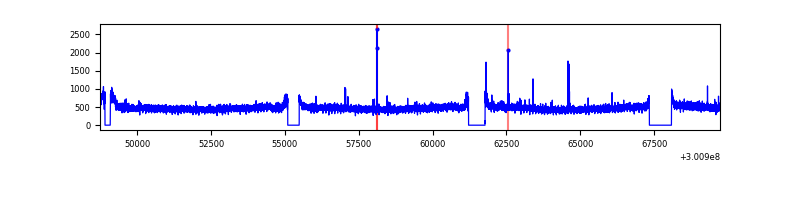 |
| D | 20984 | 19107 | 2159 | 2159 | 10.29% | 11.30% | 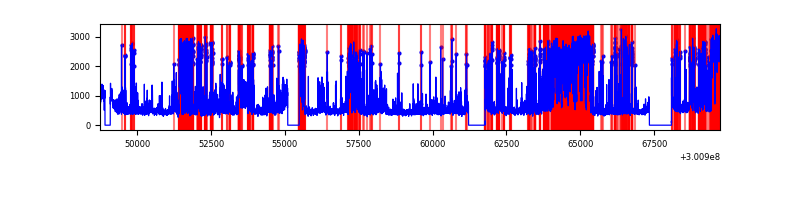 |
Top three noisy pixels from each quadrant. If the there are fewer than three noisy pixels in the level2.evt file, extra rows are filled as -1
| Pixel properties | Quadrant properties | ||||||
|---|---|---|---|---|---|---|---|
| Quadrant | DetID | PixID | Counts | Sigma | Mean | Median | Sigma |
| A | 6 | 16 | 930531 | 1989.85 | 2305 | 2247 | 466.5 |
| A | 5 | 203 | 41240 | 83.58 | 2305 | 2247 | 466.5 |
| A | 11 | 29 | 28467 | 56.2 | 2305 | 2247 | 466.5 |
| B | 7 | 220 | 638133 | 1443.52 | 2300 | 2242 | 440.5 |
| B | 0 | 197 | 215455 | 484.01 | 2300 | 2242 | 440.5 |
| B | 0 | 189 | 138658 | 309.68 | 2300 | 2242 | 440.5 |
| C | 14 | 238 | 338887 | 649.57 | 2211 | 2215 | 518.3 |
| C | 9 | 221 | 47239 | 86.87 | 2211 | 2215 | 518.3 |
| C | 8 | 208 | 28290 | 50.31 | 2211 | 2215 | 518.3 |
| D | 1 | 52 | 3307921 | 6392.63 | 2125 | 2065 | 517.1 |
| D | 12 | 238 | 2564039 | 4954.16 | 2125 | 2065 | 517.1 |
| D | 7 | 238 | 918260 | 1771.67 | 2125 | 2065 | 517.1 |
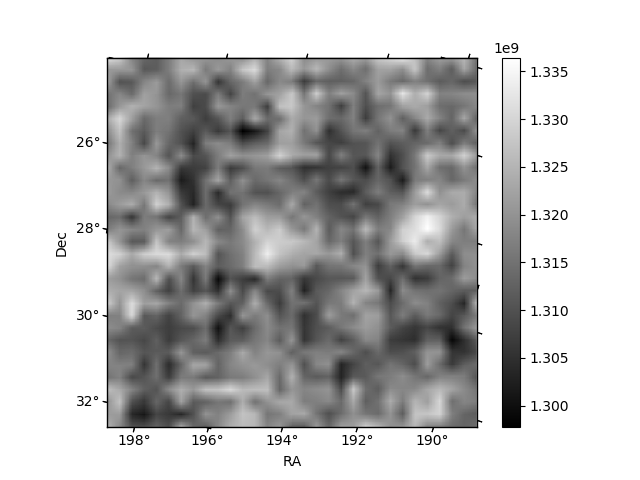
Histogram calculated using DETX and DETY for each event in the final _common_clean file
| Quadrant A | 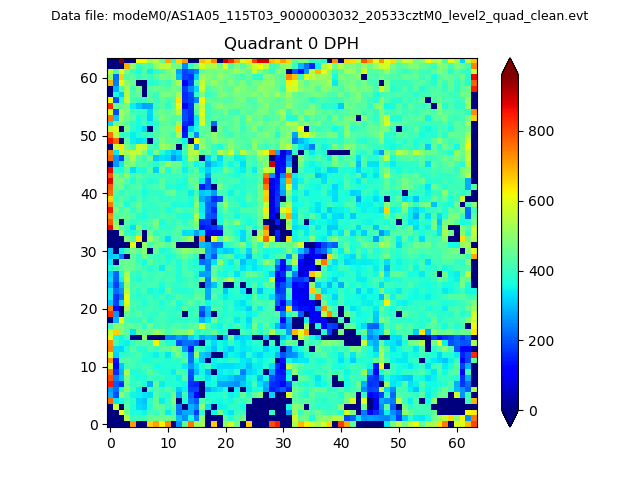 |
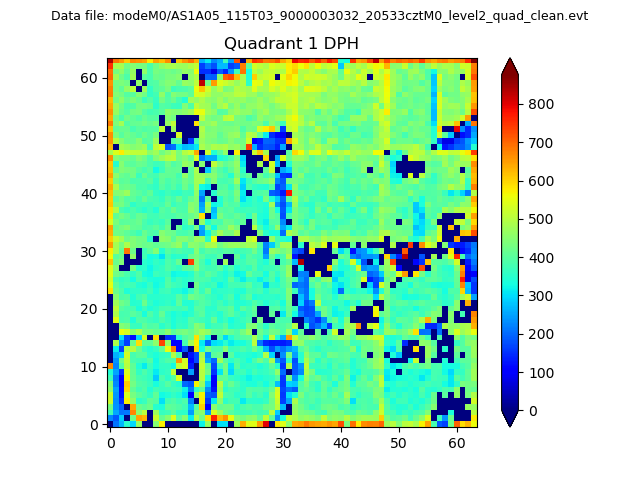 |
Quadrant B |
|---|---|---|---|
| Quadrant D |  |
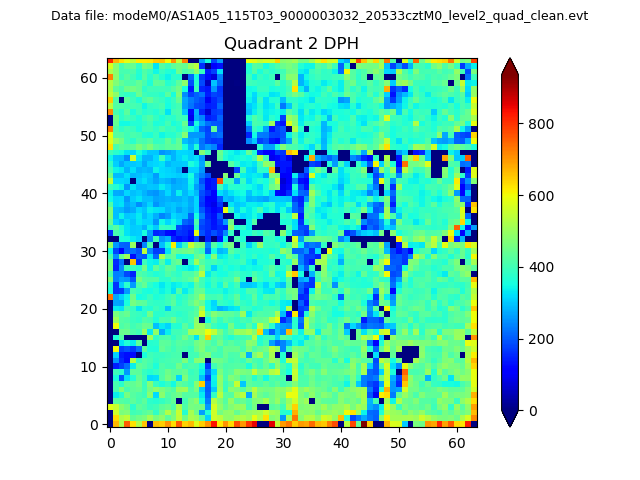 |
Quadrant C |
| Plot type | Count rate plots | Images |
|---|---|---|
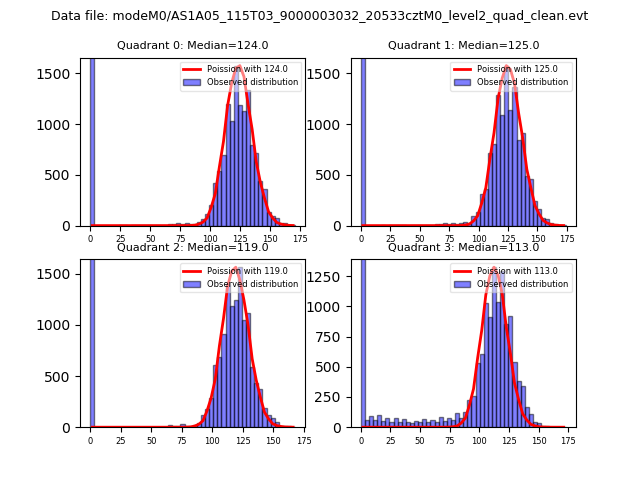
| Comparison with Poisson distribution Blue bars denote a histogram of data divided into 1 sec bins. Red curve is a Poisson curve with rate = median count rate of data. |
 |
 |
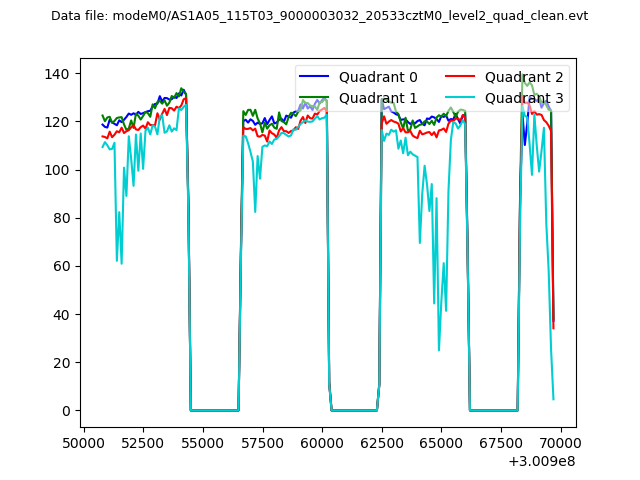
| Quadrant-wise count rates Data is divided into 100 sec bins |
 |
|
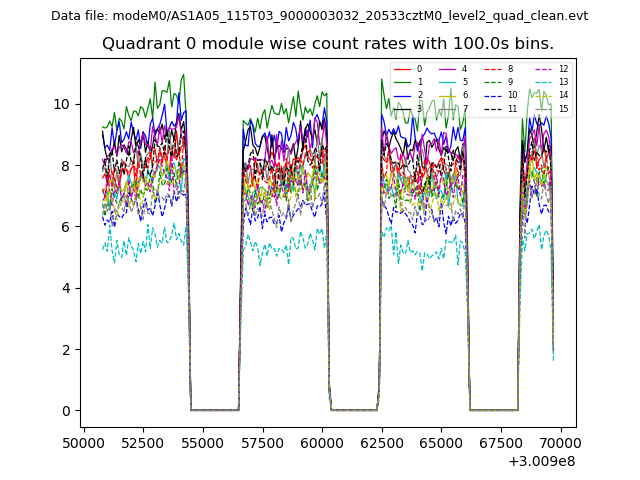
| Module-wise count rates for Quadrant A Data is divided into 100 sec bins |
 |
 |
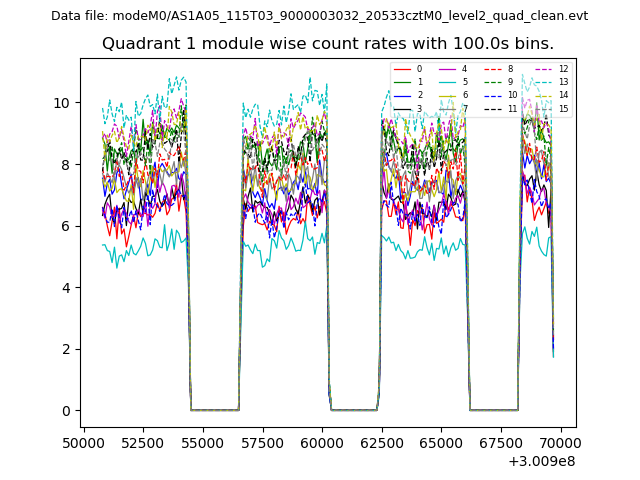
| Module-wise count rates for Quadrant B Data is divided into 100 sec bins |
 |
 |
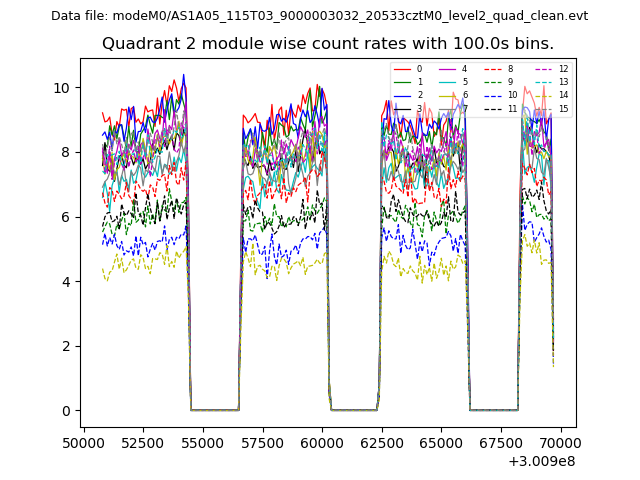
| Module-wise count rates for Quadrant C Data is divided into 100 sec bins |
 |
 |
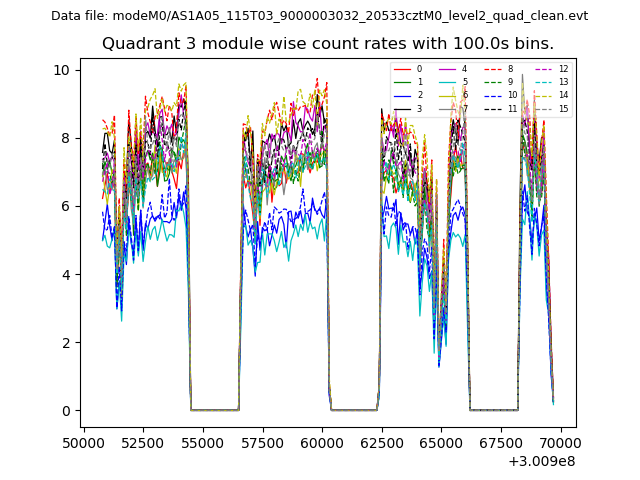
| Module-wise count rates for Quadrant D Data is divided into 100 sec bins |
 |
 |
| Parameter | Plot |
|---|---|
| CZT HV Monitor | 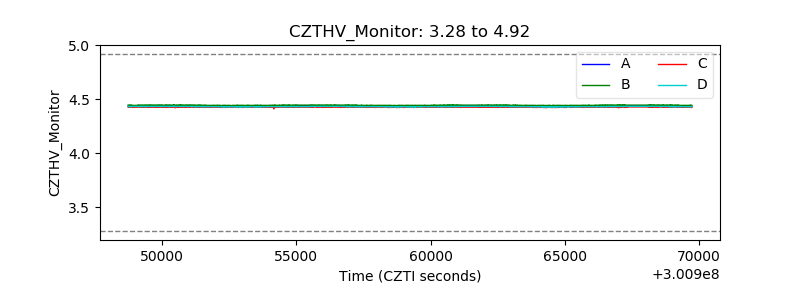 |
| D_VDD |  |
| Temperature 1 | 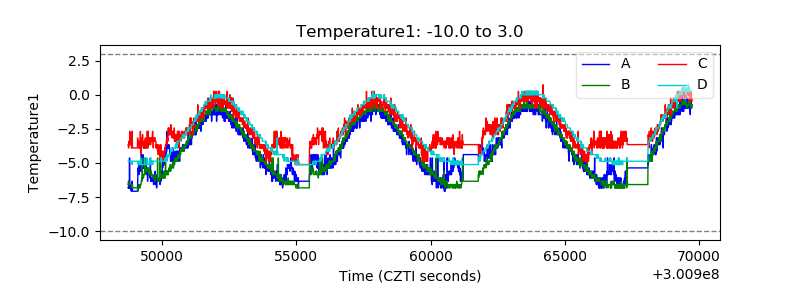 |
| Veto HV Monitor | 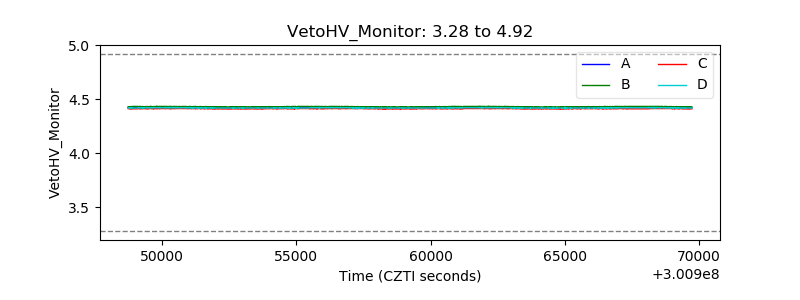 |
| Veto LLD | 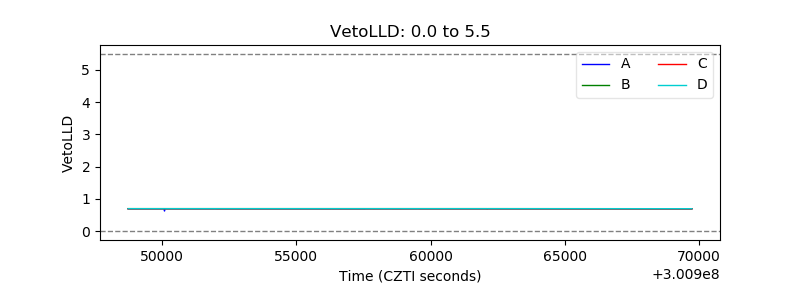 |
| Alpha Counter | 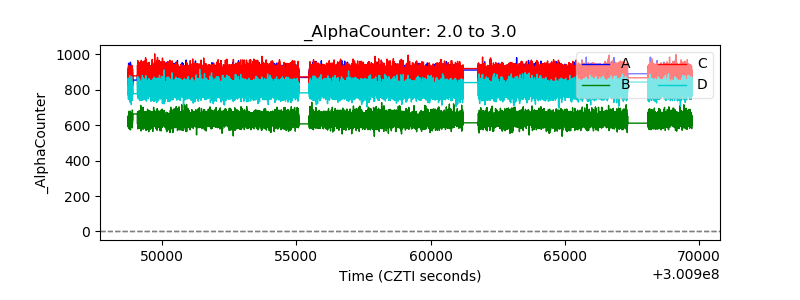 |
| _CPM_Rate | 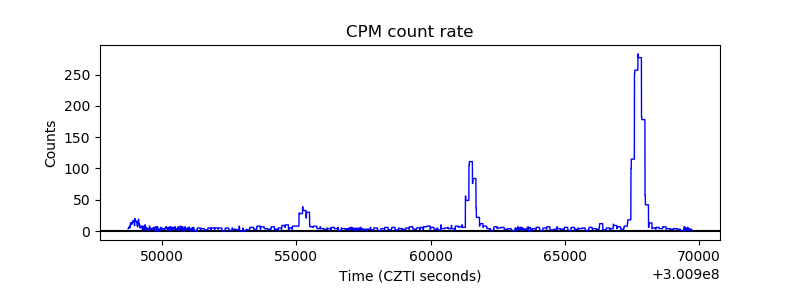 |
| CZT Counter | 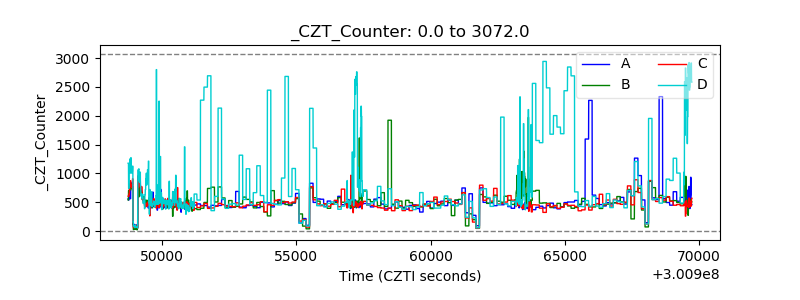 |
| +2.5 Volts monitor |  |
| +5 Volts monitor |  |
| _ROLL_ROT | 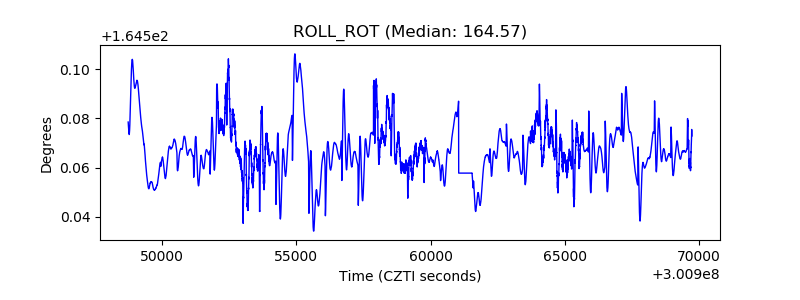 |
| _Roll_DEC | 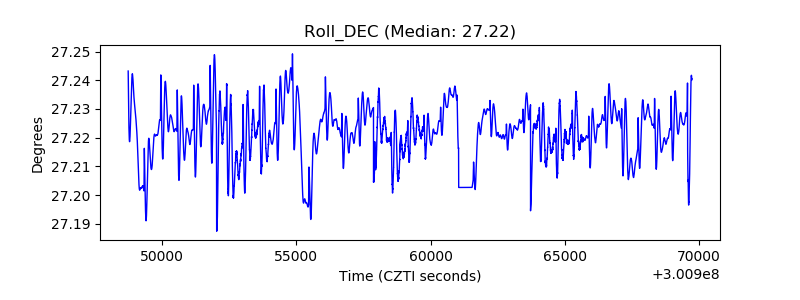 |
| _Roll_RA | 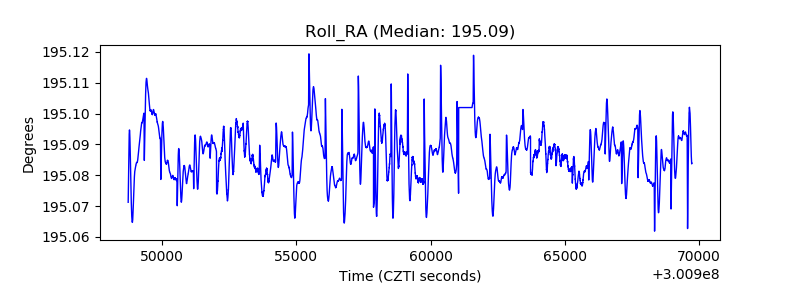 |
| Veto Counter | 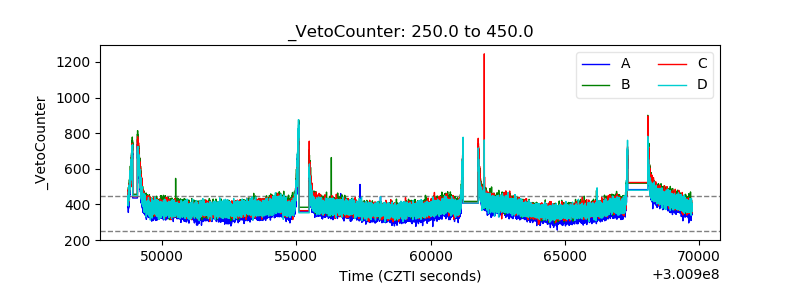 |