| Param | Original file | Final file |
|---|---|---|
| Filename | modeM0/AS1A05_115T03_9000003032_20534cztM0_level2.evt | modeM0/AS1A05_115T03_9000003032_20534cztM0_level2_quad_clean.evt |
| Size (bytes) | 297,671,040 | 39,640,320 |
| Size | 283.9 MB | 37.8 MB |
| Events in quadrant A | 1,364,207 | 298,605 |
| Events in quadrant B | 1,233,990 | 299,785 |
| Events in quadrant C | 1,197,023 | 284,918 |
| Events in quadrant D | 5,053,028 | 141,186 |
| Mode M0 | |||
|---|---|---|---|
| Quadrant | BADHDUFLAG | Total packets | Discarded packets |
| A | 0 | 5715 | 0 |
| B | 0 | 5252 | 0 |
| C | 0 | 5198 | 0 |
| D | 0 | 16641 | 0 |
| Mode SS | |||
|---|---|---|---|
| Quadrant | BADHDUFLAG | Total packets | Discarded packets |
| A | 0 | 48 | 0 |
| B | 0 | 48 | 0 |
| C | 0 | 48 | 0 |
| D | 0 | 48 | 0 |
| Quadrant | Total seconds | Saturated seconds | Saturation percentage |
|---|---|---|---|
| A | 2431 | 29 | 1.192925% |
| B | 2431 | 1 | 0.041135% |
| C | 2432 | 5 | 0.205592% |
| D | 2432 | 1618 | 66.529605% |
Noise dominated data is calculated using 1-second bins in cleaned event files. If a bin has >2000 counts, and if more than 50% of those come from <1% of pixels, then it is considered to be noise-dominated and hence unusable.
| Quadrant | # 1 sec bins | Bins with >0 counts | Bins with >2000 counts | High rate bins dominated by noise | Noise dominated (total time) | Noise dominated (detector-on time) | Marked lightcurve |
|---|---|---|---|---|---|---|---|
| A | 2431 | 2431 | 31 | 31 | 1.28% | 1.28% | 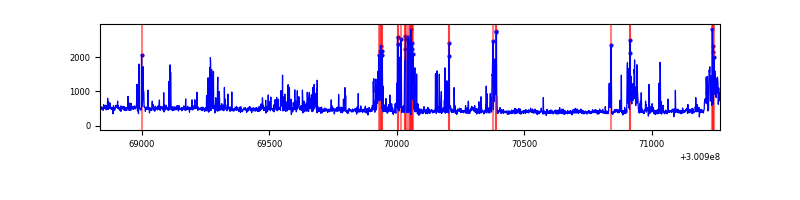 |
| B | 2431 | 2431 | 0 | 0 | 0.00% | 0.00% | 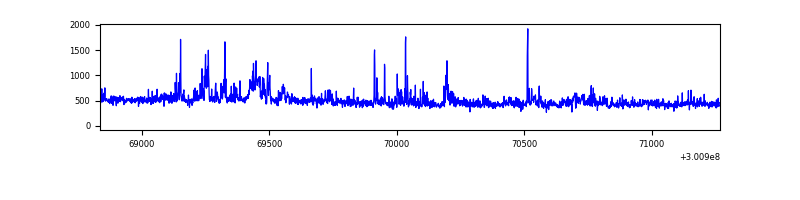 |
| C | 2432 | 2432 | 0 | 0 | 0.00% | 0.00% | 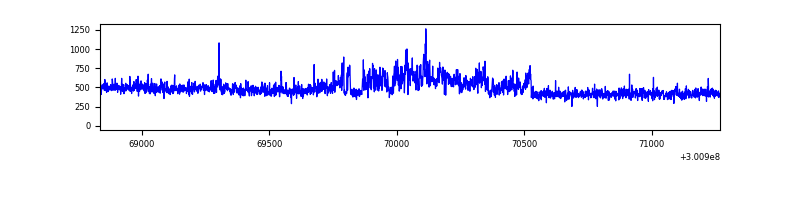 |
| D | 2432 | 2432 | 1597 | 1597 | 65.67% | 65.67% | 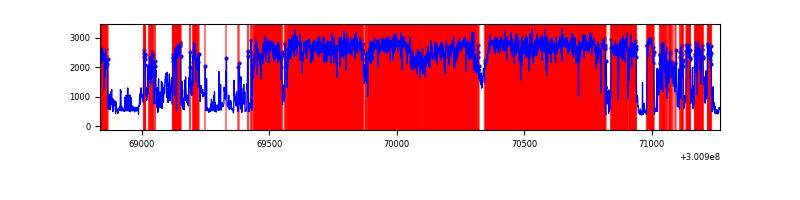 |
Top three noisy pixels from each quadrant. If the there are fewer than three noisy pixels in the level2.evt file, extra rows are filled as -1
| Pixel properties | Quadrant properties | ||||||
|---|---|---|---|---|---|---|---|
| Quadrant | DetID | PixID | Counts | Sigma | Mean | Median | Sigma |
| A | 6 | 16 | 305186 | 5287.9 | 274 | 268 | 57.7 |
| A | 0 | 226 | 2454 | 37.91 | 274 | 268 | 57.7 |
| A | 12 | 194 | 2017 | 30.33 | 274 | 268 | 57.7 |
| B | 0 | 197 | 51783 | 953.72 | 271 | 265 | 54.0 |
| B | 0 | 189 | 48049 | 884.6 | 271 | 265 | 54.0 |
| B | 0 | 190 | 45797 | 842.91 | 271 | 265 | 54.0 |
| C | 8 | 208 | 129182 | 2046.17 | 262 | 263 | 63.0 |
| C | 14 | 238 | 40231 | 634.36 | 262 | 263 | 63.0 |
| C | 0 | 207 | 3456 | 50.68 | 262 | 263 | 63.0 |
| D | 12 | 238 | 4165949 | 106710.23 | 151 | 146 | 39.0 |
| D | 2 | 165 | 72063 | 1842.21 | 151 | 146 | 39.0 |
| D | 7 | 238 | 71111 | 1817.82 | 151 | 146 | 39.0 |
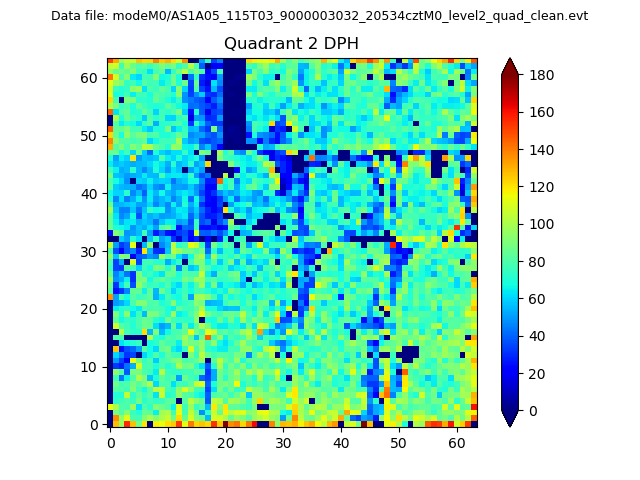
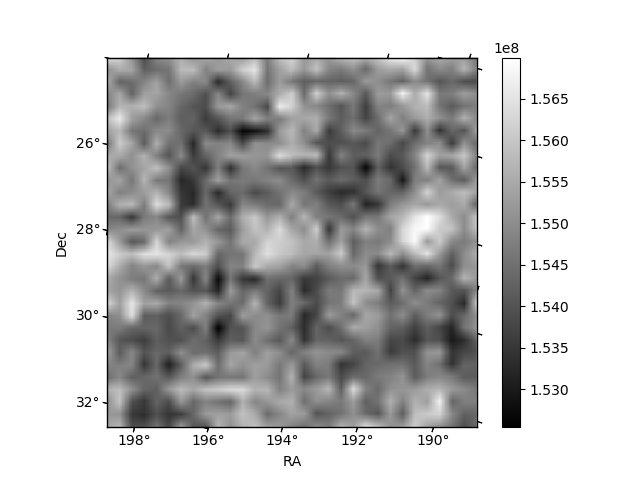
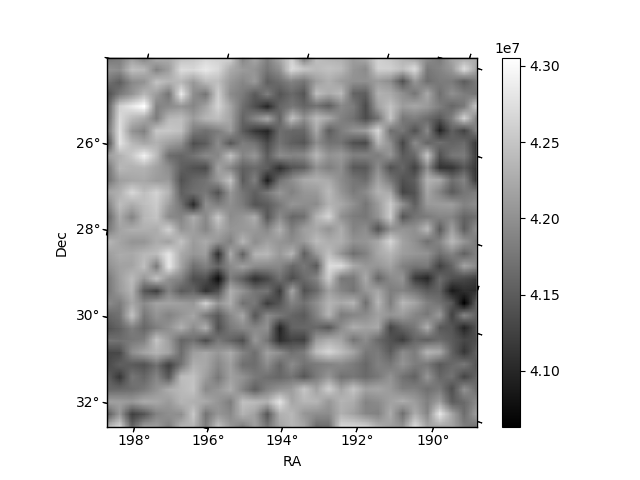
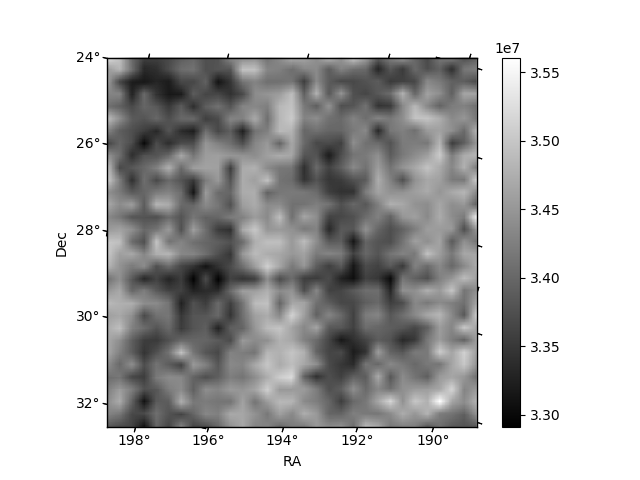
Histogram calculated using DETX and DETY for each event in the final _common_clean file
| Quadrant A | 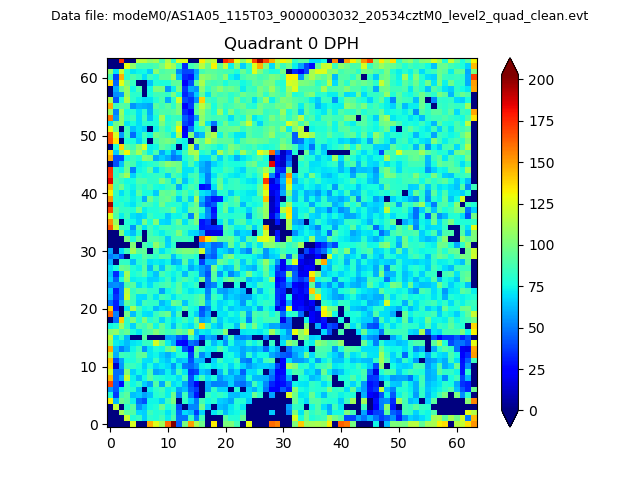 |
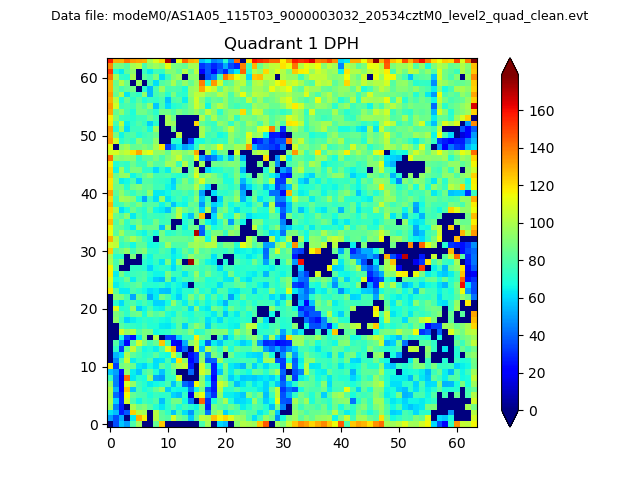 |
Quadrant B |
|---|---|---|---|
| Quadrant D | 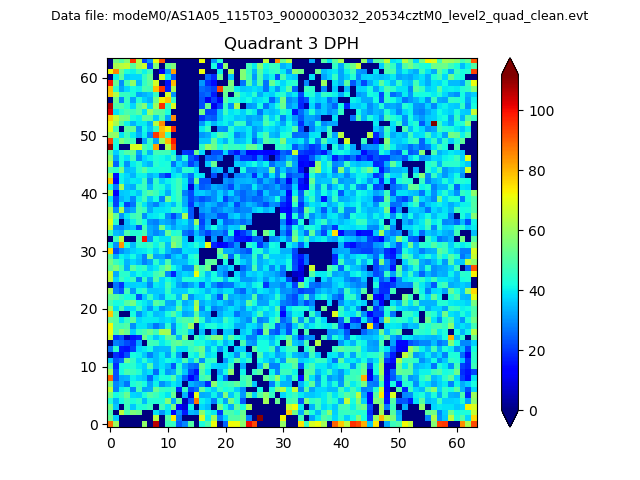 |
 |
Quadrant C |
| Plot type | Count rate plots | Images |
|---|---|---|
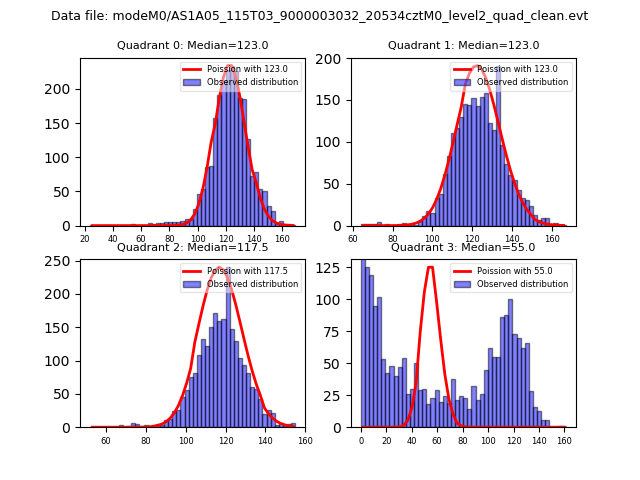
| Comparison with Poisson distribution Blue bars denote a histogram of data divided into 1 sec bins. Red curve is a Poisson curve with rate = median count rate of data. |
 |
 |
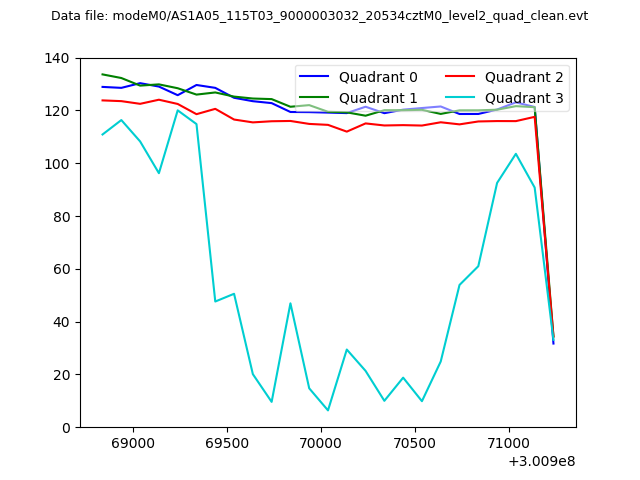
| Quadrant-wise count rates Data is divided into 100 sec bins |
 |
|
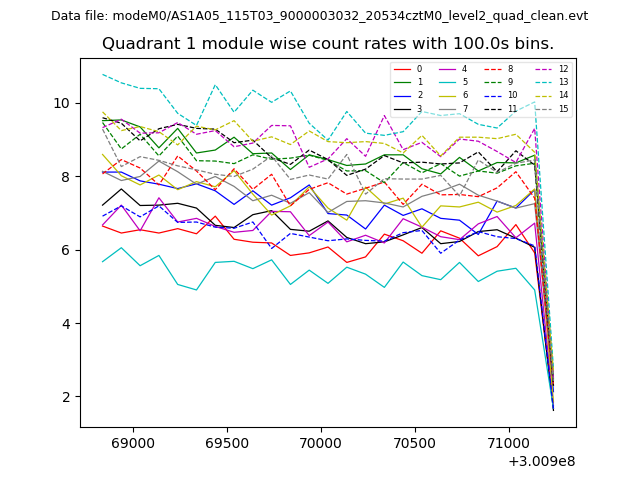
| Module-wise count rates for Quadrant A Data is divided into 100 sec bins |
 |
 |
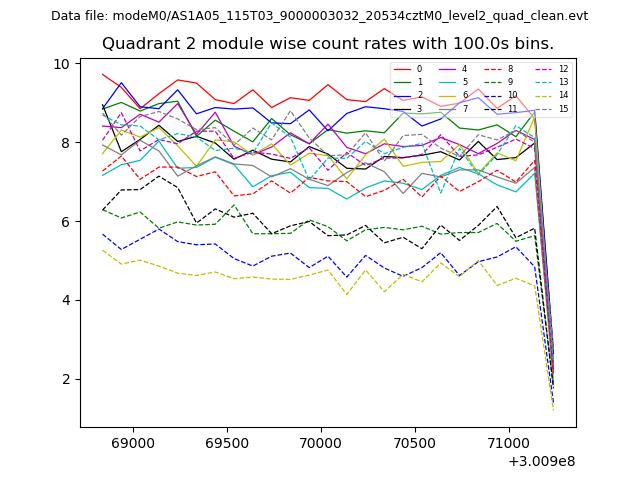
| Module-wise count rates for Quadrant B Data is divided into 100 sec bins |
 |
 |
| Module-wise count rates for Quadrant C Data is divided into 100 sec bins |
 |
 |
| Module-wise count rates for Quadrant D Data is divided into 100 sec bins |
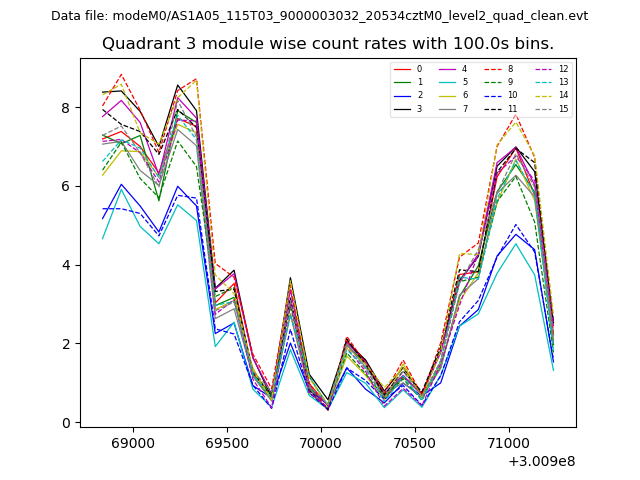 |
 |
| Parameter | Plot |
|---|---|
| CZT HV Monitor | 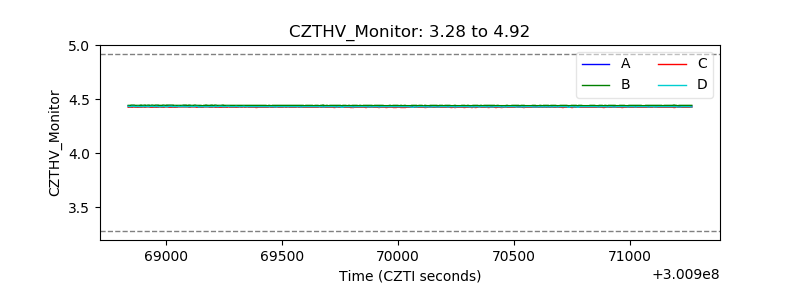 |
| D_VDD | 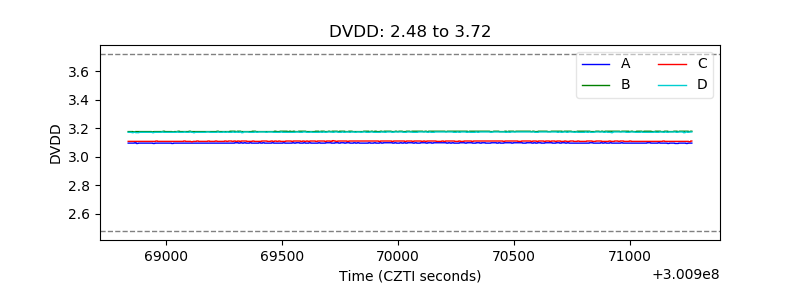 |
| Temperature 1 | 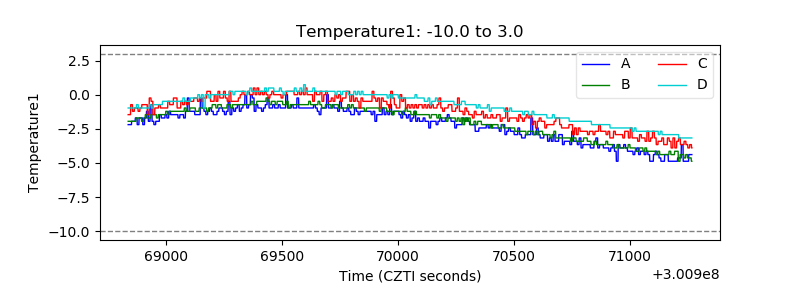 |
| Veto HV Monitor | 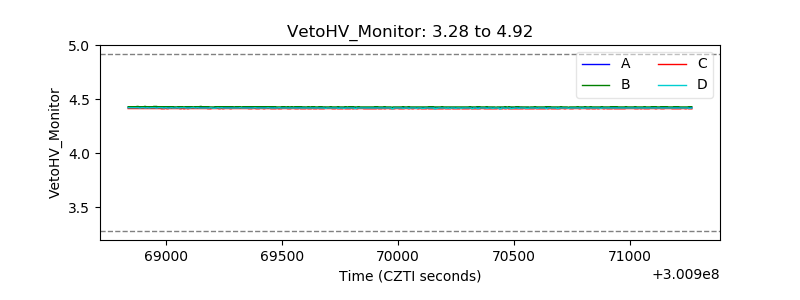 |
| Veto LLD | 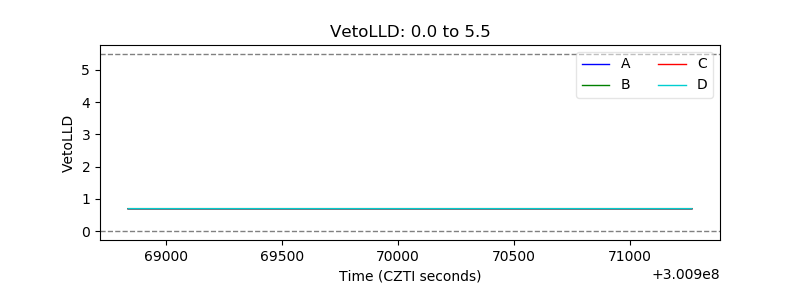 |
| Alpha Counter | 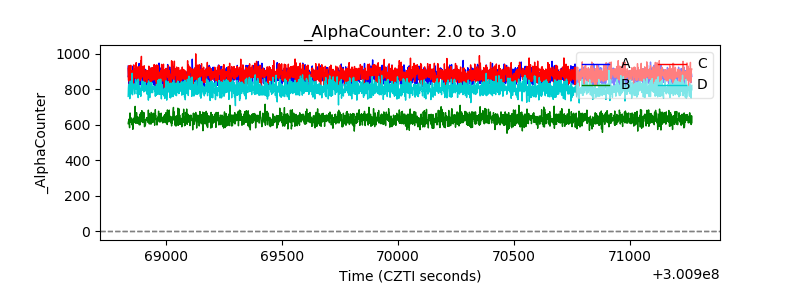 |
| _CPM_Rate | 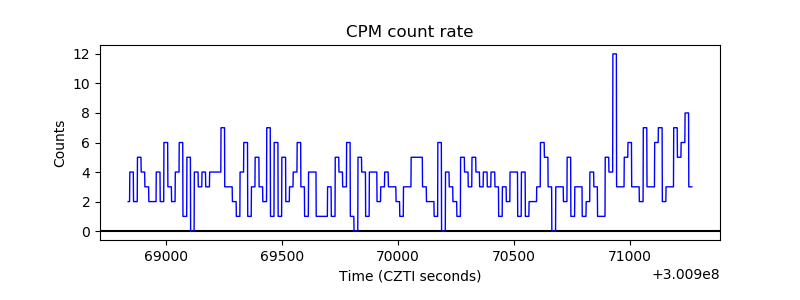 |
| CZT Counter | 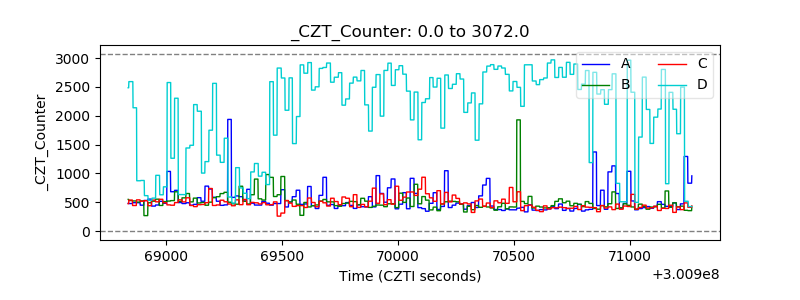 |
| +2.5 Volts monitor |  |
| +5 Volts monitor |  |
| _ROLL_ROT | 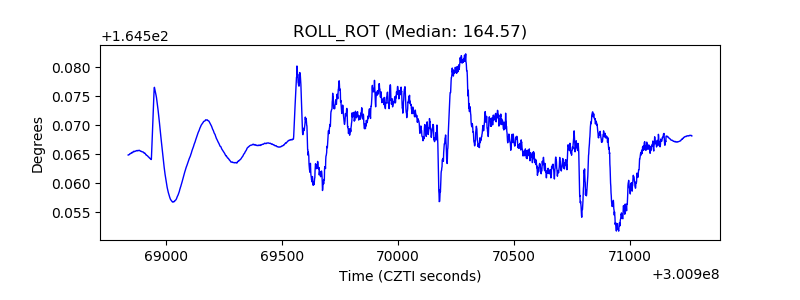 |
| _Roll_DEC | 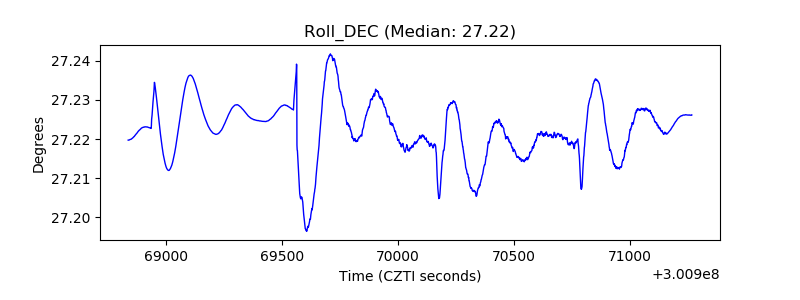 |
| _Roll_RA | 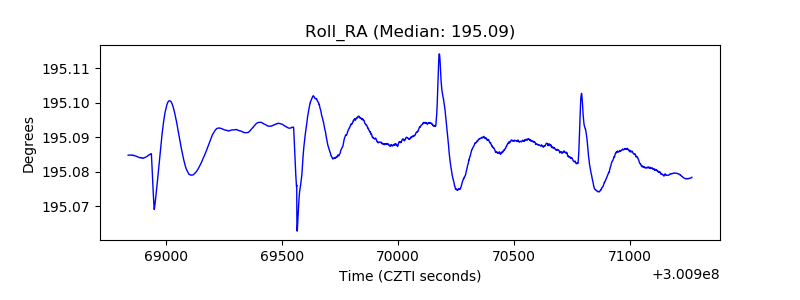 |
| Veto Counter |  |