| Param | Original file | Final file |
|---|---|---|
| Filename | modeM0/AS1A05_115T03_9000003032_20537cztM0_level2.evt | modeM0/AS1A05_115T03_9000003032_20537cztM0_level2_quad_clean.evt |
| Size (bytes) | 1,694,836,800 | 258,842,880 |
| Size | 1.6 GB | 246.9 MB |
| Events in quadrant A | 10,326,368 | 1,714,932 |
| Events in quadrant B | 10,654,121 | 1,723,757 |
| Events in quadrant C | 9,377,682 | 1,651,227 |
| Events in quadrant D | 19,629,287 | 1,379,744 |
| Mode M9 | |||
|---|---|---|---|
| Quadrant | BADHDUFLAG | Total packets | Discarded packets |
| A | 0 | 15 | 0 |
| B | 0 | 15 | 0 |
| C | 0 | 15 | 0 |
| D | 0 | 15 | 0 |
| Mode M0 | |||
|---|---|---|---|
| Quadrant | BADHDUFLAG | Total packets | Discarded packets |
| A | 0 | 43721 | 3 |
| B | 0 | 44193 | 3 |
| C | 0 | 40838 | 3 |
| D | 0 | 71582 | 3 |
| Mode SS | |||
|---|---|---|---|
| Quadrant | BADHDUFLAG | Total packets | Discarded packets |
| A | 0 | 406 | 0 |
| B | 0 | 406 | 0 |
| C | 0 | 406 | 0 |
| D | 0 | 406 | 0 |
| Quadrant | Total seconds | Saturated seconds | Saturation percentage |
|---|---|---|---|
| A | 19865 | 373 | 1.877674% |
| B | 19865 | 349 | 1.756859% |
| C | 19866 | 279 | 1.404410% |
| D | 19866 | 3588 | 18.061009% |
Noise dominated data is calculated using 1-second bins in cleaned event files. If a bin has >2000 counts, and if more than 50% of those come from <1% of pixels, then it is considered to be noise-dominated and hence unusable.
| Quadrant | # 1 sec bins | Bins with >0 counts | Bins with >2000 counts | High rate bins dominated by noise | Noise dominated (total time) | Noise dominated (detector-on time) | Marked lightcurve |
|---|---|---|---|---|---|---|---|
| A | 21564 | 19867 | 140 | 140 | 0.65% | 0.70% | 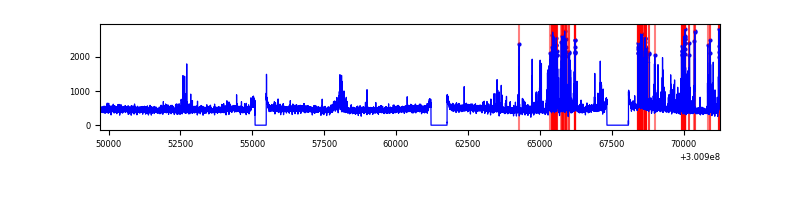 |
| B | 21565 | 19868 | 63 | 63 | 0.29% | 0.32% | 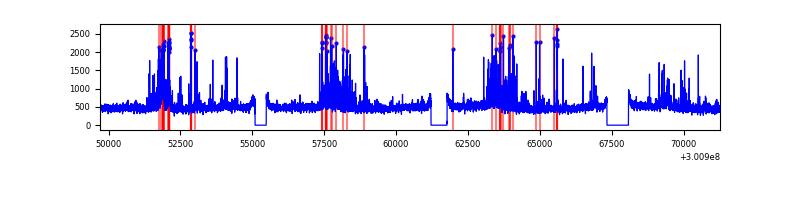 |
| C | 21566 | 19869 | 3 | 3 | 0.01% | 0.02% | 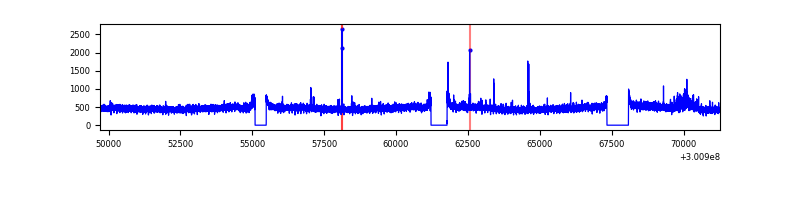 |
| D | 21566 | 19869 | 3387 | 3387 | 15.71% | 17.05% |  |
Top three noisy pixels from each quadrant. If the there are fewer than three noisy pixels in the level2.evt file, extra rows are filled as -1
| Pixel properties | Quadrant properties | ||||||
|---|---|---|---|---|---|---|---|
| Quadrant | DetID | PixID | Counts | Sigma | Mean | Median | Sigma |
| A | 6 | 16 | 1167681 | 2454.26 | 2350 | 2295 | 474.8 |
| A | 5 | 203 | 41461 | 82.48 | 2350 | 2295 | 474.8 |
| A | 11 | 29 | 28107 | 54.36 | 2350 | 2295 | 474.8 |
| B | 7 | 220 | 638151 | 1423.17 | 2346 | 2289 | 446.8 |
| B | 0 | 197 | 215476 | 477.15 | 2346 | 2289 | 446.8 |
| B | 0 | 189 | 174679 | 385.84 | 2346 | 2289 | 446.8 |
| C | 14 | 238 | 346932 | 652.27 | 2254 | 2261 | 528.4 |
| C | 8 | 208 | 152743 | 284.78 | 2254 | 2261 | 528.4 |
| C | 9 | 221 | 37866 | 67.38 | 2254 | 2261 | 528.4 |
| D | 12 | 238 | 5839685 | 11543.7 | 2077 | 2019 | 505.7 |
| D | 1 | 52 | 3189949 | 6303.98 | 2077 | 2019 | 505.7 |
| D | 7 | 238 | 924315 | 1823.8 | 2077 | 2019 | 505.7 |
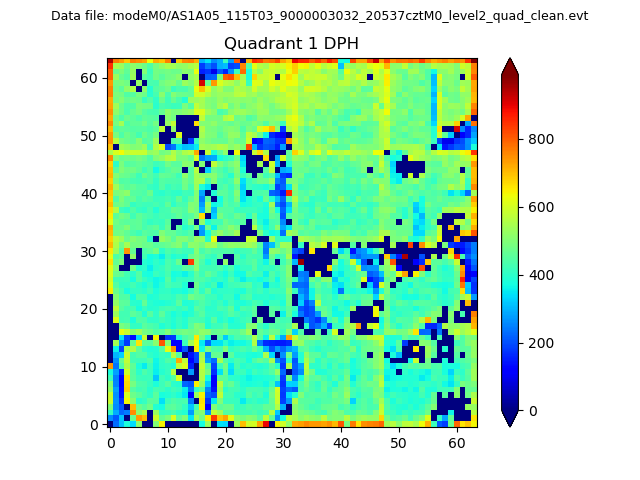
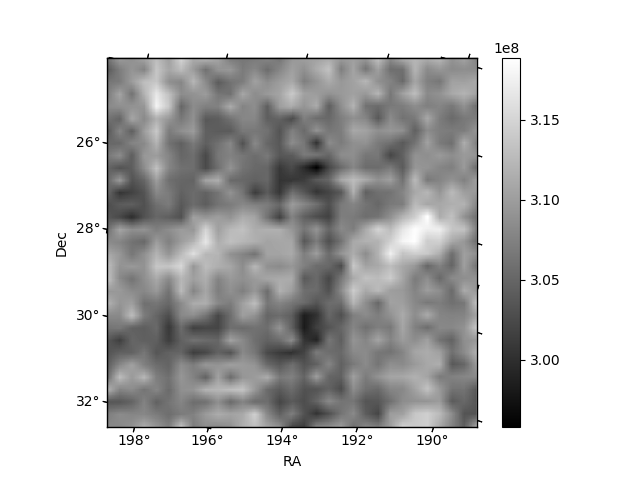
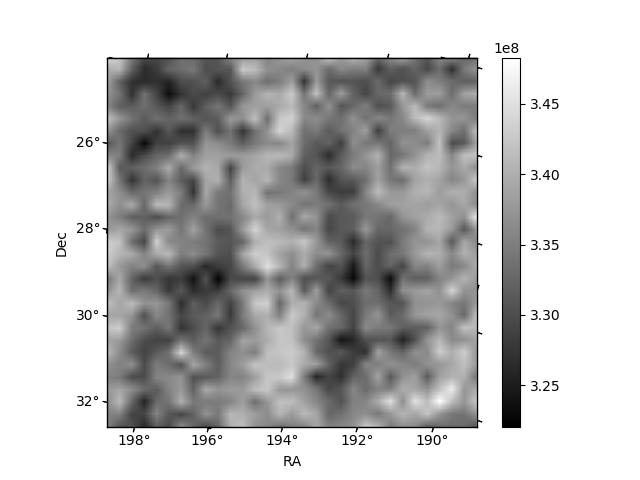
Histogram calculated using DETX and DETY for each event in the final _common_clean file
| Quadrant A | 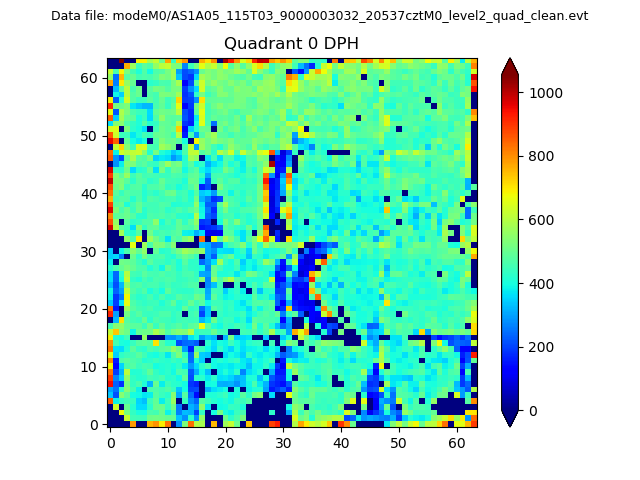 |
 |
Quadrant B |
|---|---|---|---|
| Quadrant D | 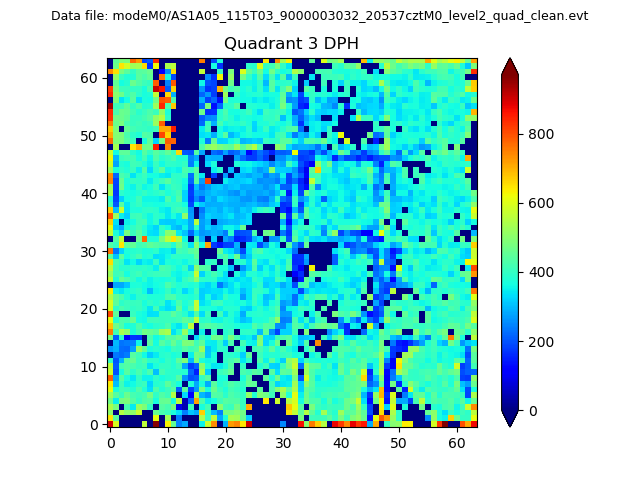 |
 |
Quadrant C |
| Plot type | Count rate plots | Images |
|---|---|---|
| Comparison with Poisson distribution Blue bars denote a histogram of data divided into 1 sec bins. Red curve is a Poisson curve with rate = median count rate of data. |
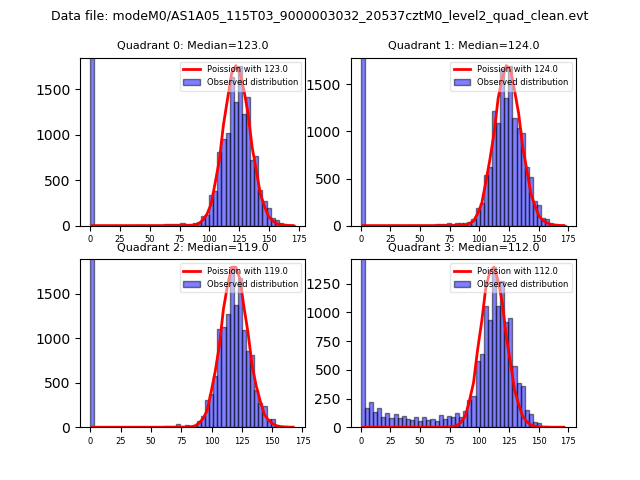 |
 |
| Quadrant-wise count rates Data is divided into 100 sec bins |
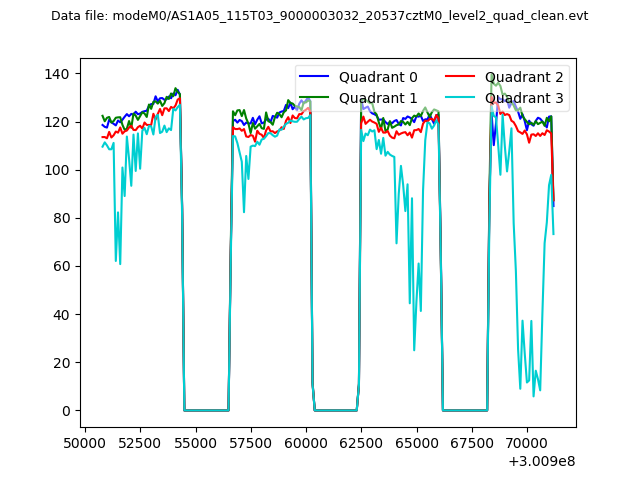 |
|
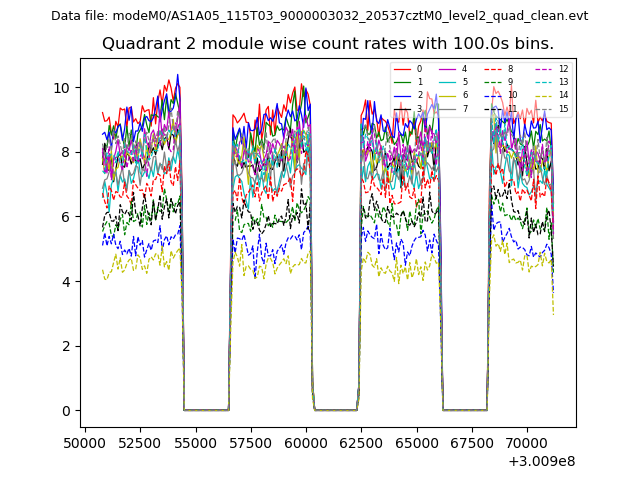
| Module-wise count rates for Quadrant A Data is divided into 100 sec bins |
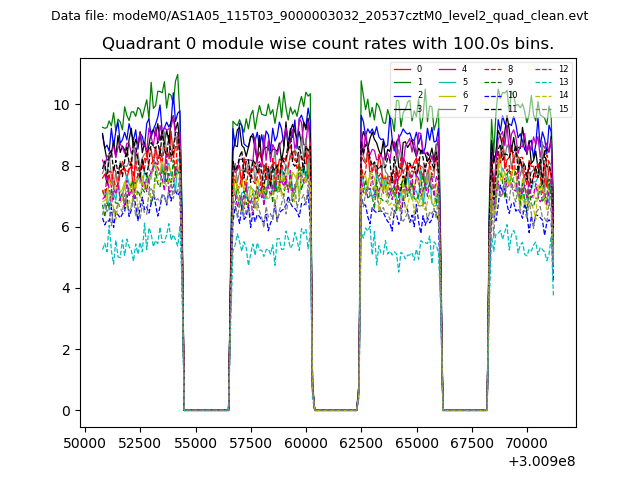 |
 |
| Module-wise count rates for Quadrant B Data is divided into 100 sec bins |
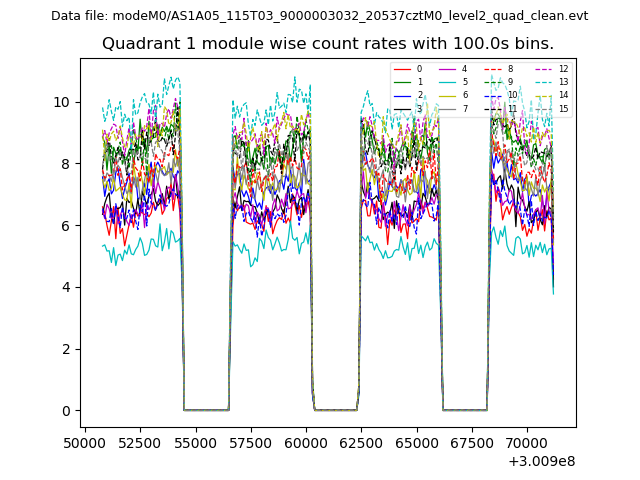 |
 |
| Module-wise count rates for Quadrant C Data is divided into 100 sec bins |
 |
 |
| Module-wise count rates for Quadrant D Data is divided into 100 sec bins |
 |
 |
| Parameter | Plot |
|---|---|
| CZT HV Monitor | 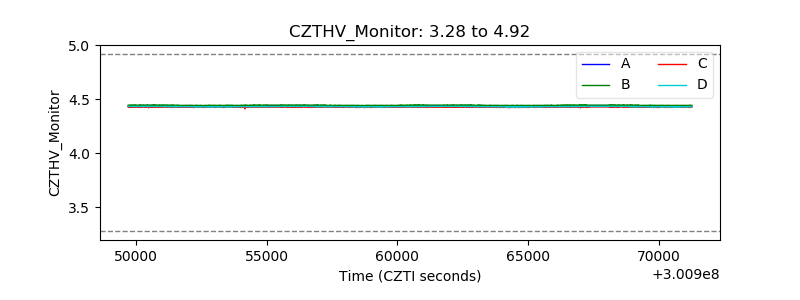 |
| D_VDD | 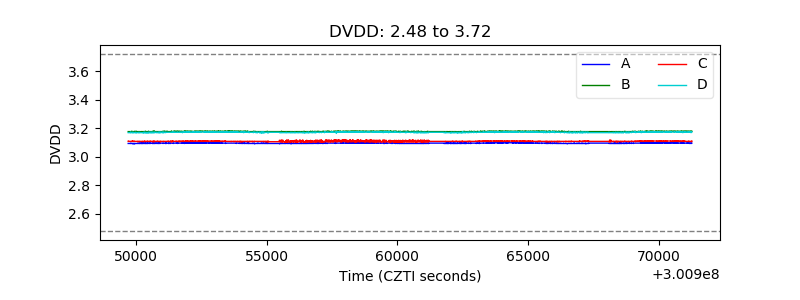 |
| Temperature 1 | 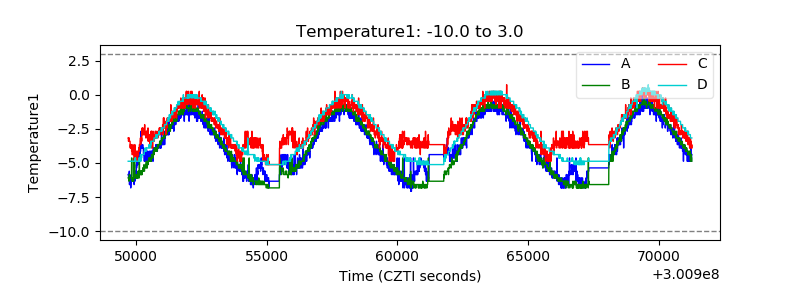 |
| Veto HV Monitor | 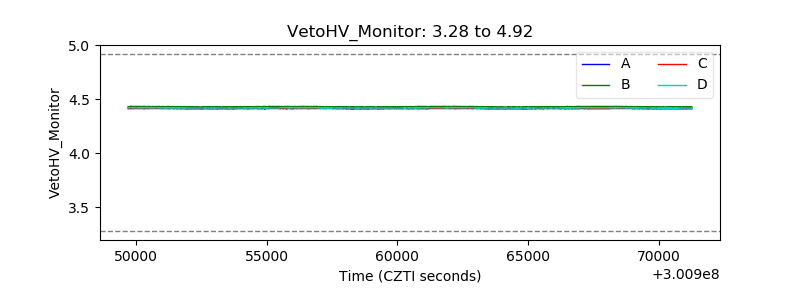 |
| Veto LLD | 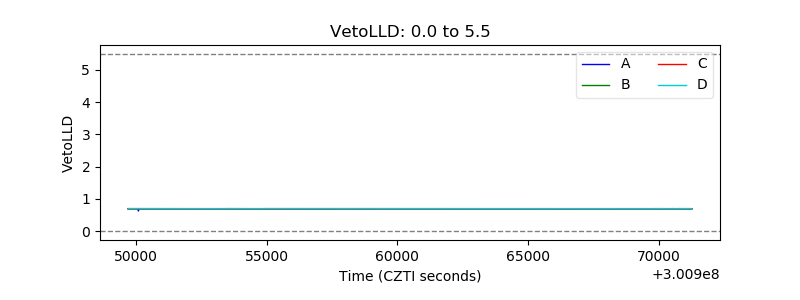 |
| Alpha Counter | 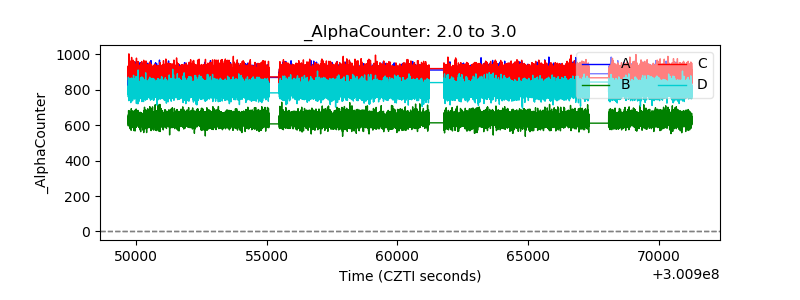 |
| _CPM_Rate | 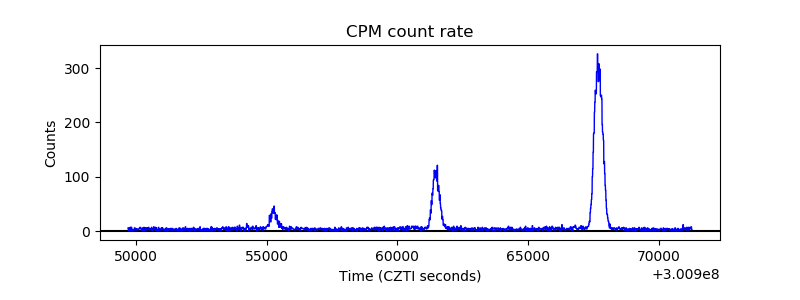 |
| CZT Counter | 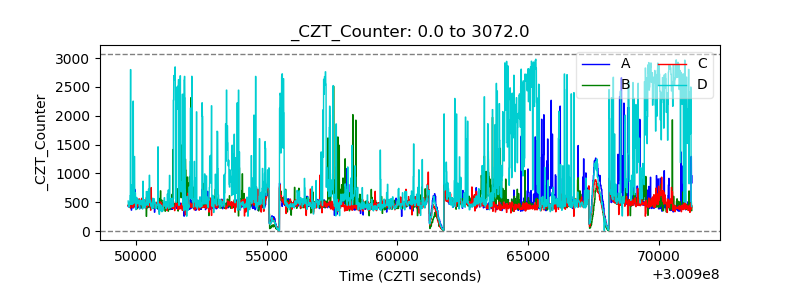 |
| +2.5 Volts monitor |  |
| +5 Volts monitor |  |
| _ROLL_ROT | 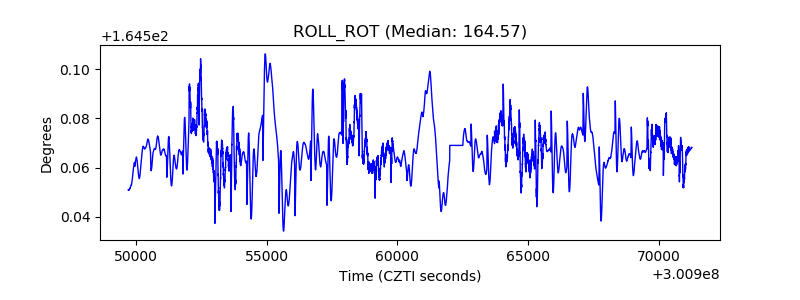 |
| _Roll_DEC | 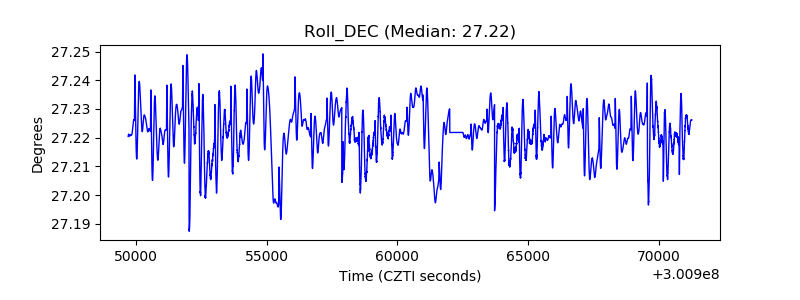 |
| _Roll_RA | 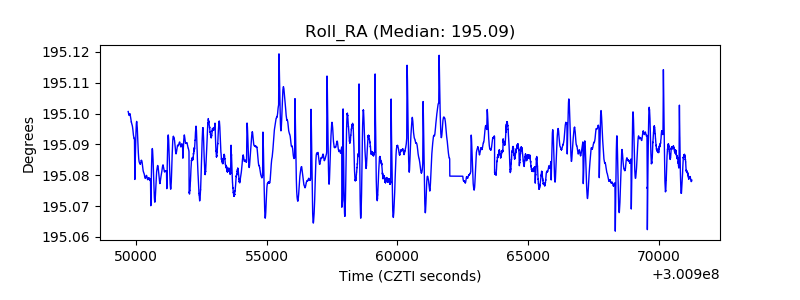 |
| Veto Counter | 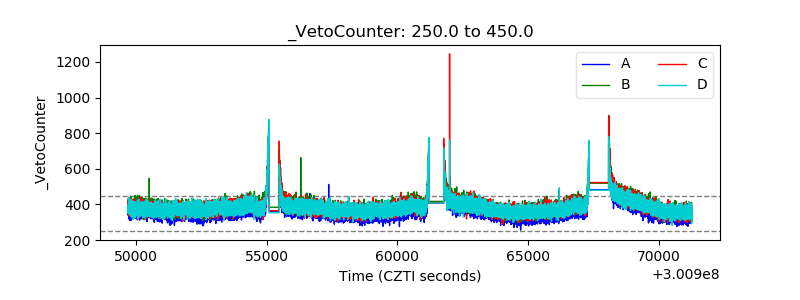 |