| Param | Original file | Final file |
|---|---|---|
| Filename | modeM0/AS1A05_115T03_9000003032_20703cztM0_level2.evt | modeM0/AS1A05_115T03_9000003032_20703cztM0_level2_quad_clean.evt |
| Size (bytes) | 155,805,120 | 36,371,520 |
| Size | 148.6 MB | 34.7 MB |
| Events in quadrant A | 1,036,509 | 242,447 |
| Events in quadrant B | 1,201,455 | 239,670 |
| Events in quadrant C | 1,033,360 | 229,915 |
| Events in quadrant D | 1,290,419 | 225,024 |
| Mode M9 | |||
|---|---|---|---|
| Quadrant | BADHDUFLAG | Total packets | Discarded packets |
| A | 1 | 140196704062344 | 46 |
| B | 1 | -1 | -1 |
| C | 1 | -1 | -1 |
| D | 1 | -1 | -1 |
| Mode M0 | |||
|---|---|---|---|
| Quadrant | BADHDUFLAG | Total packets | Discarded packets |
| A | 0 | 5975 | 1387 |
| B | 0 | 6568 | 1509 |
| C | 0 | 5961 | 1360 |
| D | 0 | 6972 | 1626 |
| Mode SS | |||
|---|---|---|---|
| Quadrant | BADHDUFLAG | Total packets | Discarded packets |
| A | 0 | 59 | 13 |
| B | 0 | 60 | 14 |
| C | 0 | 60 | 16 |
| D | 0 | 57 | 13 |
| Quadrant | Total seconds | Saturated seconds | Saturation percentage |
|---|---|---|---|
| A | 2280 | 2 | 0.087719% |
| B | 2266 | 32 | 1.412180% |
| C | 2289 | 9 | 0.393185% |
| D | 2256 | 21 | 0.930851% |
Noise dominated data is calculated using 1-second bins in cleaned event files. If a bin has >2000 counts, and if more than 50% of those come from <1% of pixels, then it is considered to be noise-dominated and hence unusable.
| Quadrant | # 1 sec bins | Bins with >0 counts | Bins with >2000 counts | High rate bins dominated by noise | Noise dominated (total time) | Noise dominated (detector-on time) | Marked lightcurve |
|---|---|---|---|---|---|---|---|
| A | 6836 | 2356 | 0 | 0 | 0.00% | 0.00% | 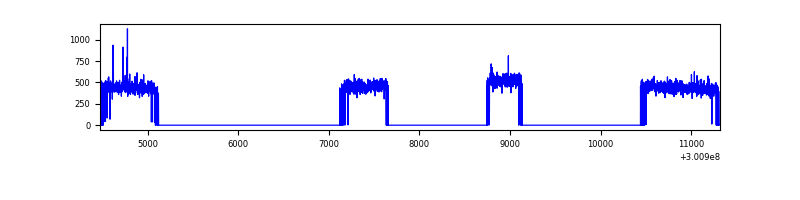 |
| B | 6824 | 2338 | 20 | 20 | 0.29% | 0.86% | 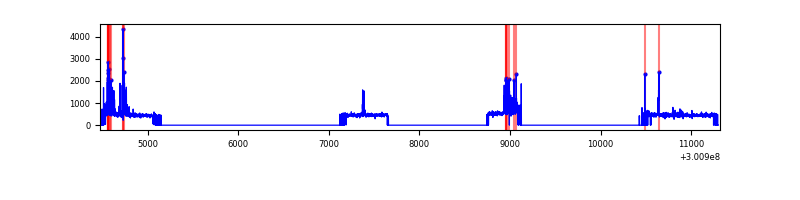 |
| C | 6845 | 2362 | 0 | 0 | 0.00% | 0.00% |  |
| D | 6820 | 2329 | 18 | 18 | 0.26% | 0.77% |  |
Top three noisy pixels from each quadrant. If the there are fewer than three noisy pixels in the level2.evt file, extra rows are filled as -1
| Pixel properties | Quadrant properties | ||||||
|---|---|---|---|---|---|---|---|
| Quadrant | DetID | PixID | Counts | Sigma | Mean | Median | Sigma |
| A | 9 | 143 | 3991 | 66.54 | 268 | 263 | 56.0 |
| A | 0 | 226 | 2291 | 36.19 | 268 | 263 | 56.0 |
| A | 3 | 137 | 2242 | 35.32 | 268 | 263 | 56.0 |
| B | 7 | 220 | 151739 | 2880.59 | 263 | 257 | 52.6 |
| B | 12 | 111 | 6037 | 109.91 | 263 | 257 | 52.6 |
| B | 3 | 64 | 5786 | 105.14 | 263 | 257 | 52.6 |
| C | 14 | 238 | 38993 | 633.25 | 252 | 254 | 61.2 |
| C | 3 | 233 | 3972 | 60.78 | 252 | 254 | 61.2 |
| C | 8 | 128 | 2155 | 31.07 | 252 | 254 | 61.2 |
| D | 1 | 20 | 110712 | 1729.77 | 254 | 247 | 63.9 |
| D | 5 | 222 | 84327 | 1316.61 | 254 | 247 | 63.9 |
| D | 13 | 153 | 47895 | 746.12 | 254 | 247 | 63.9 |
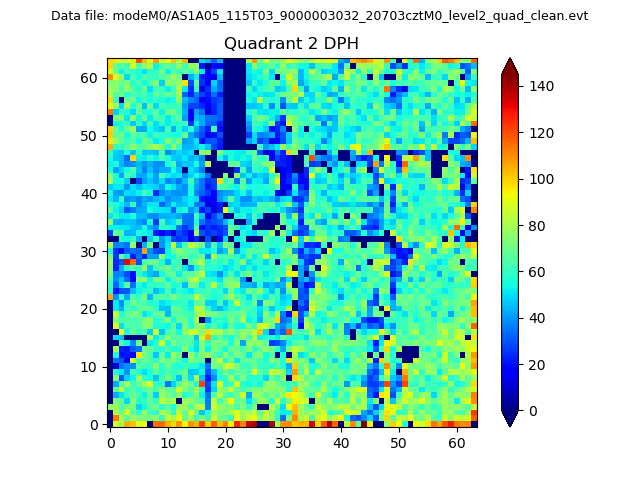
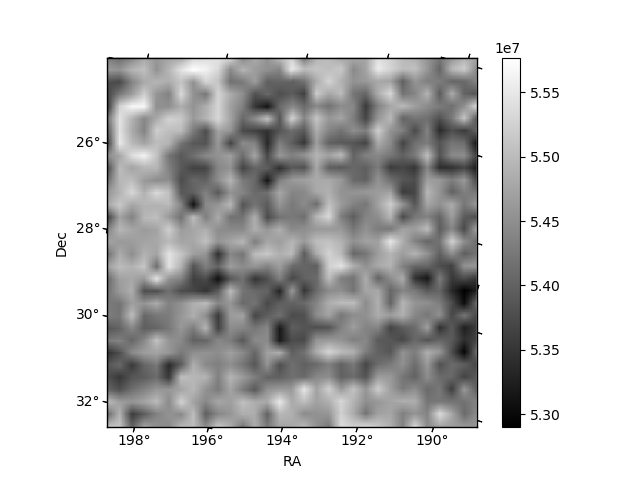
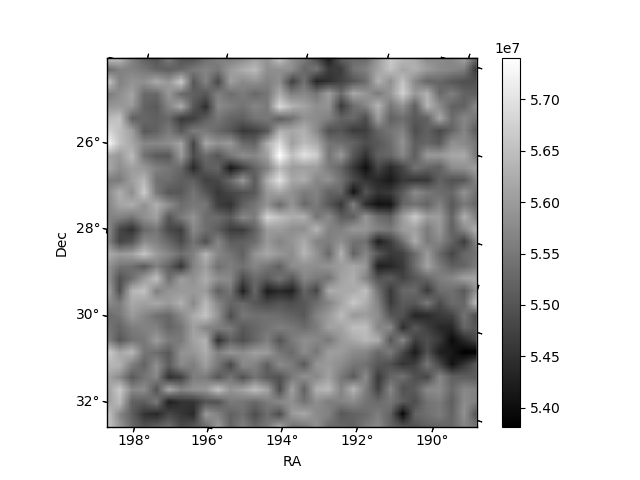
Histogram calculated using DETX and DETY for each event in the final _common_clean file
| Quadrant A | 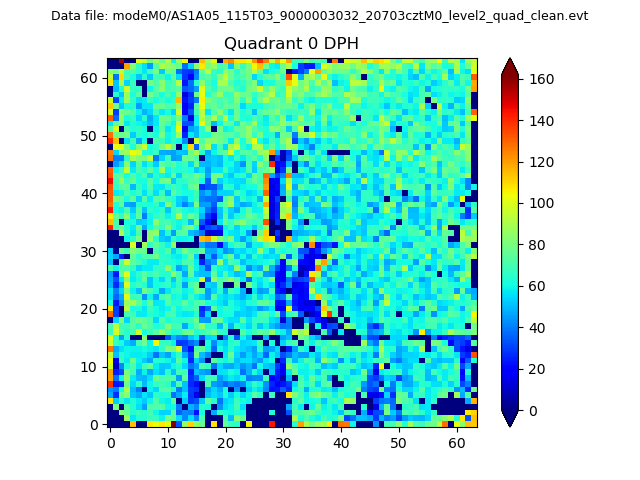 |
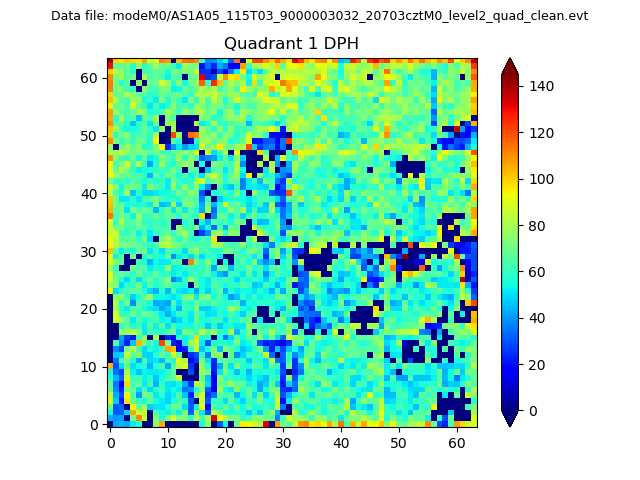 |
Quadrant B |
|---|---|---|---|
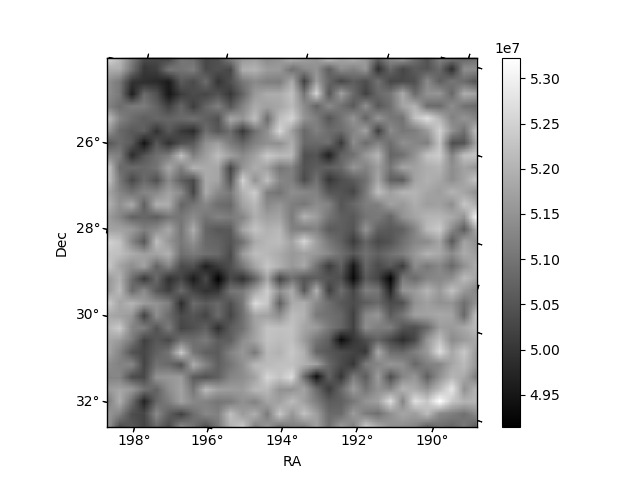
| Quadrant D | 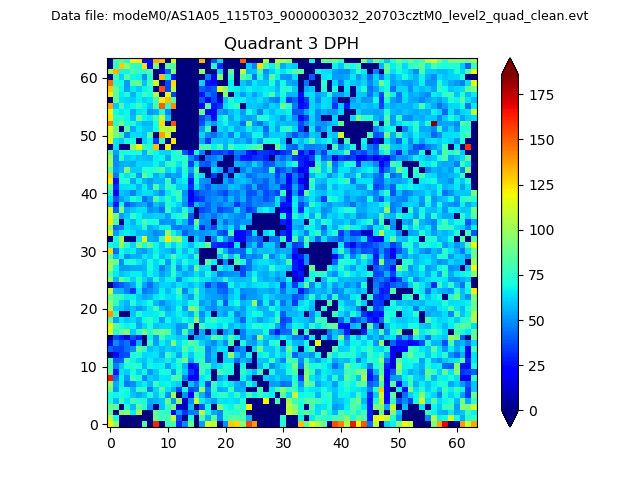 |
 |
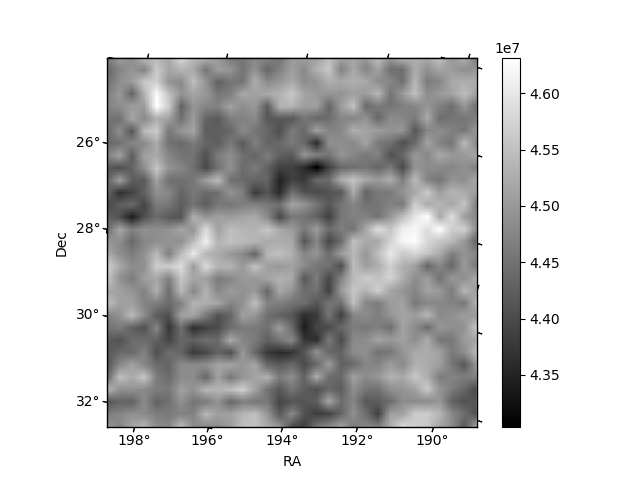
Quadrant C |
| Plot type | Count rate plots | Images |
|---|---|---|
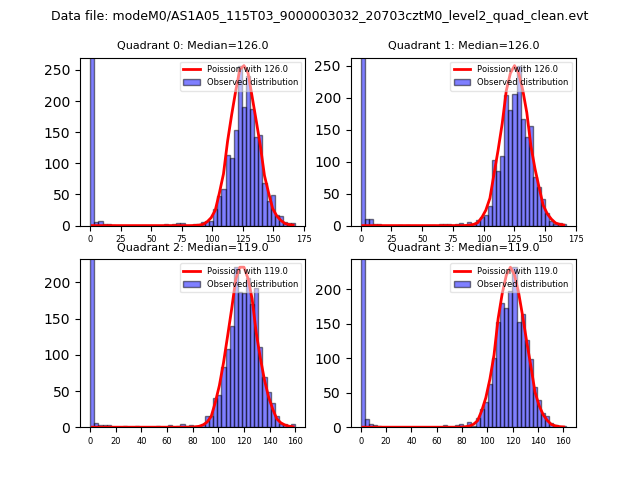
| Comparison with Poisson distribution Blue bars denote a histogram of data divided into 1 sec bins. Red curve is a Poisson curve with rate = median count rate of data. |
 |
 |
| Quadrant-wise count rates Data is divided into 100 sec bins |
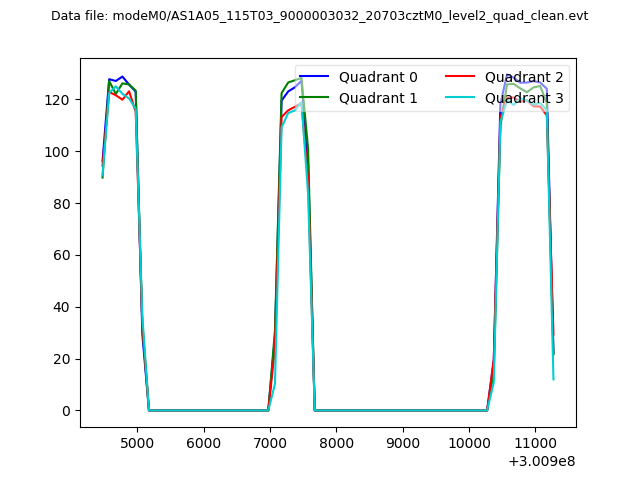 |
|
| Module-wise count rates for Quadrant A Data is divided into 100 sec bins |
 |
 |
| Module-wise count rates for Quadrant B Data is divided into 100 sec bins |
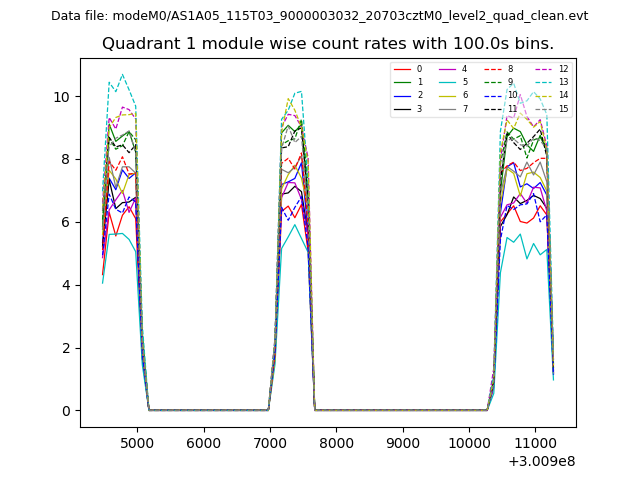 |
 |
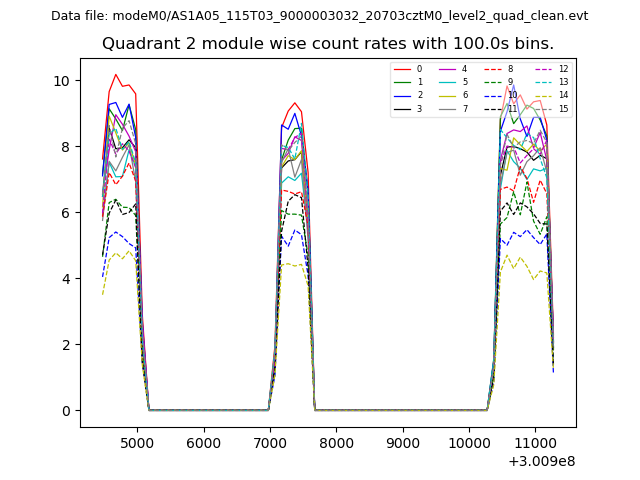
| Module-wise count rates for Quadrant C Data is divided into 100 sec bins |
 |
 |
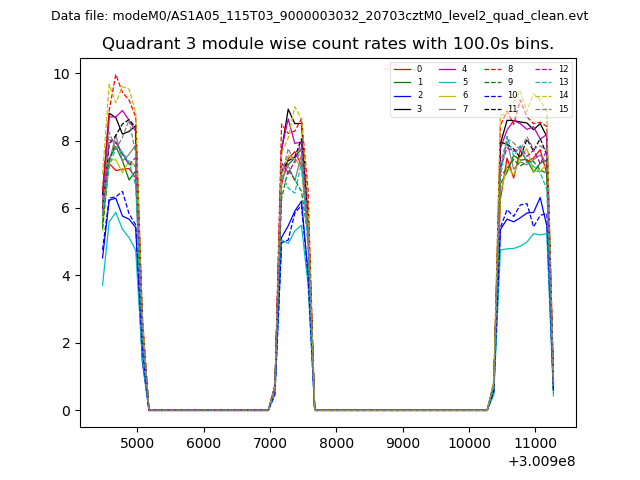
| Module-wise count rates for Quadrant D Data is divided into 100 sec bins |
 |
 |
| Parameter | Plot |
|---|---|
| CZT HV Monitor | 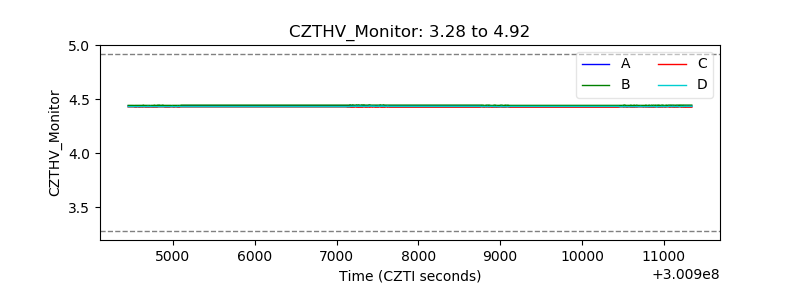 |
| D_VDD | 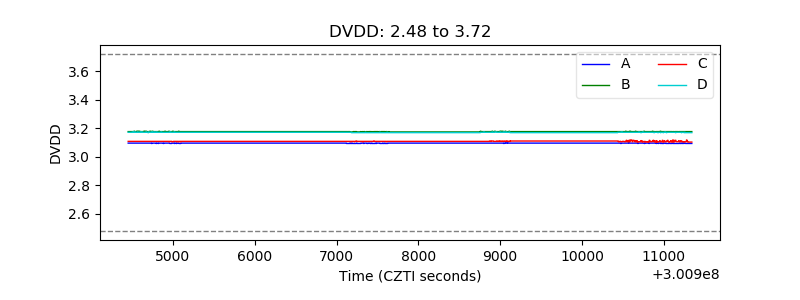 |
| Temperature 1 | 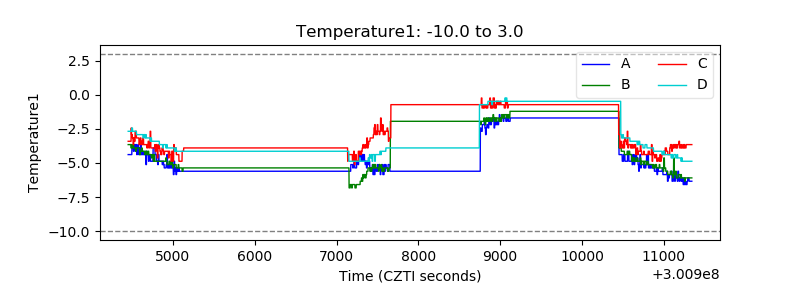 |
| Veto HV Monitor |  |
| Veto LLD |  |
| Alpha Counter | 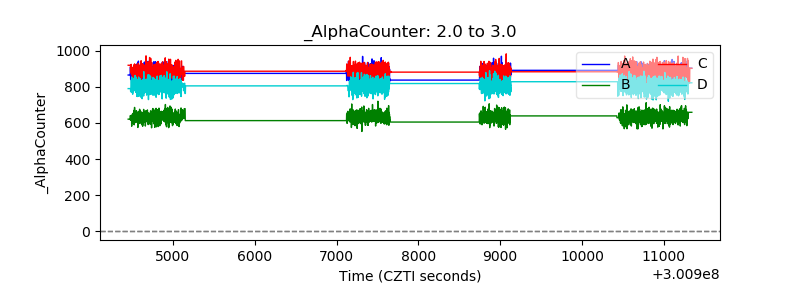 |
| _CPM_Rate | 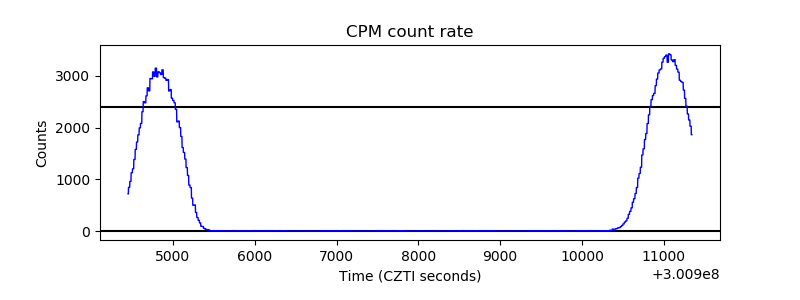 |
| CZT Counter | 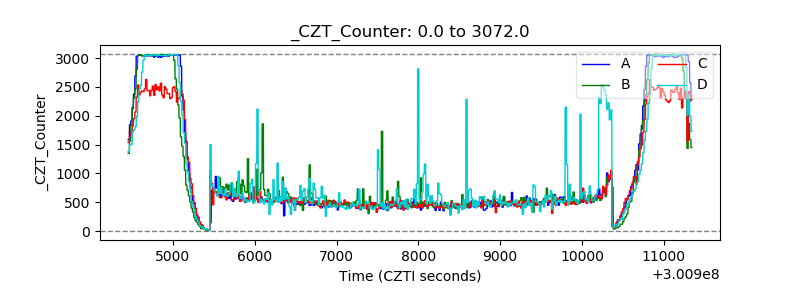 |
| +2.5 Volts monitor |  |
| +5 Volts monitor | 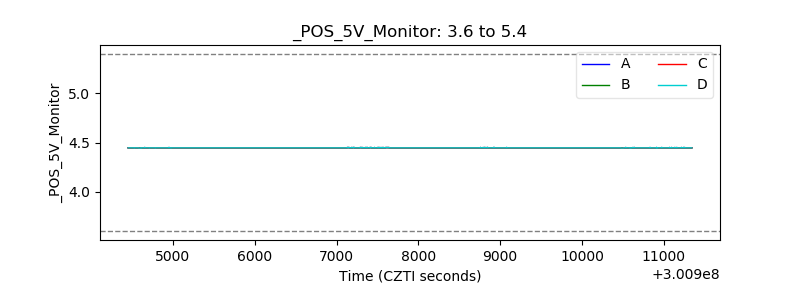 |
| _ROLL_ROT | 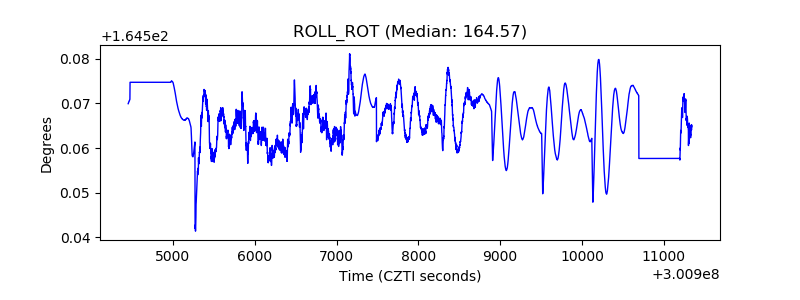 |
| _Roll_DEC | 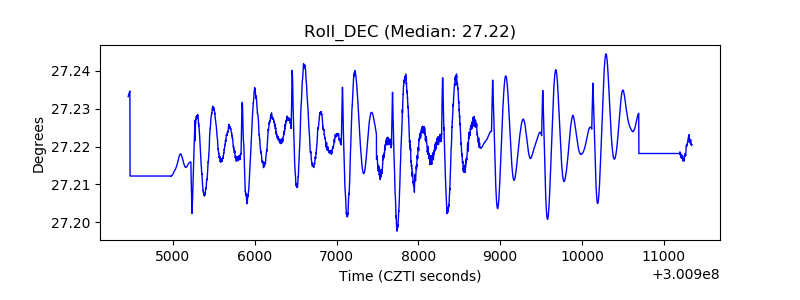 |
| _Roll_RA | 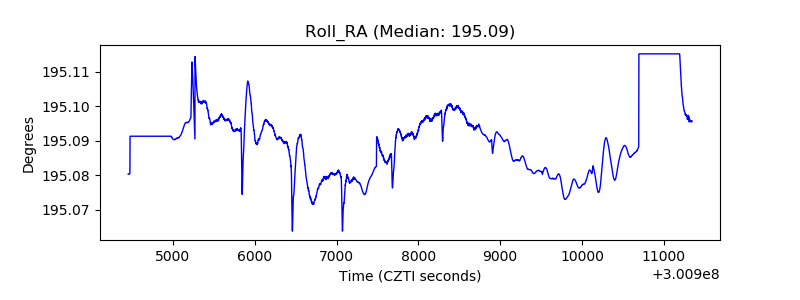 |
| Veto Counter |  |