| Param | Original file | Final file |
|---|---|---|
| Filename | modeM0/AS1A05_022T08_9000003036cztM0_level2.fits | modeM0/AS1A05_022T08_9000003036cztM0_level2_quad_clean.evt |
| Size (bytes) | 201,723,840 | 97,113,600 |
| Size | 192.4 MB | 92.6 MB |
| Events in quadrant A | 1,274,552 | 427,410 |
| Events in quadrant B | 1,226,382 | 421,588 |
| Events in quadrant C | 1,230,142 | 396,188 |
| Events in quadrant D | 1,044,478 | 360,282 |
| Mode SS | |||
|---|---|---|---|
| Quadrant | BADHDUFLAG | Total packets | Discarded packets |
| A | 0 | 401 | 0 |
| B | 0 | 404 | 0 |
| C | 0 | 402 | 0 |
| D | 0 | 398 | 0 |
| Mode M0 | |||
|---|---|---|---|
| Quadrant | BADHDUFLAG | Total packets | Discarded packets |
| A | 0 | 44208 | 0 |
| B | 0 | 43159 | 0 |
| C | 0 | 43246 | 0 |
| D | 0 | 49216 | 0 |
| Mode M9 | |||
|---|---|---|---|
| Quadrant | BADHDUFLAG | Total packets | Discarded packets |
| A | 0 | 56 | 0 |
| B | 0 | 57 | 0 |
| C | 0 | 57 | 0 |
| D | 0 | 57 | 0 |
| Quadrant | Total seconds | Saturated seconds | Saturation percentage |
|---|---|---|---|
| A | 19366 | 344 | 1.776309% |
| B | 19350 | 284 | 1.467700% |
| C | 19365 | 357 | 1.843532% |
| D | 19293 | 765 | 3.965169% |
Noise dominated data is calculated using 1-second bins in cleaned event files. If a bin has >2000 counts, and if more than 50% of those come from <1% of pixels, then it is considered to be noise-dominated and hence unusable.
| Quadrant | # 1 sec bins | Bins with >0 counts | Bins with >2000 counts | High rate bins dominated by noise | Noise dominated (total time) | Noise dominated (detector-on time) | Marked lightcurve |
|---|---|---|---|---|---|---|---|
| A | 22890 | 18962 | 0 | 0 | 0.00% | 0.00% |  |
| B | 22891 | 18961 | 0 | 0 | 0.00% | 0.00% |  |
| C | 22890 | 18966 | 0 | 0 | 0.00% | 0.00% |  |
| D | 22891 | 18954 | 0 | 0 | 0.00% | 0.00% |  |
Top three noisy pixels from each quadrant. If the there are fewer than three noisy pixels in the level2.evt file, extra rows are filled as -1
| Pixel properties | Quadrant properties | ||||||
|---|---|---|---|---|---|---|---|
| Quadrant | DetID | PixID | Counts | Sigma | Mean | Median | Sigma |
| A | 0 | 29 | 1242 | 11.1 | 332 | 313 | 83.7 |
| A | 7 | 110 | 995 | 8.15 | 332 | 313 | 83.7 |
| A | 0 | 30 | 960 | 7.73 | 332 | 313 | 83.7 |
| B | 2 | 9 | 944 | 9.67 | 324 | 311 | 65.4 |
| B | 2 | 8 | 823 | 7.82 | 324 | 311 | 65.4 |
| B | 14 | 254 | 809 | 7.61 | 324 | 311 | 65.4 |
| C | 1 | 80 | 921 | 7.28 | 324 | 304 | 84.7 |
| C | 1 | 81 | 905 | 7.09 | 324 | 304 | 84.7 |
| C | 12 | 241 | 894 | 6.96 | 324 | 304 | 84.7 |
| D | 15 | 46 | 779 | 6.16 | 299 | 272 | 82.3 |
| D | 6 | 67 | 748 | 5.78 | 299 | 272 | 82.3 |
| D | 3 | 14 | 734 | 5.61 | 299 | 272 | 82.3 |
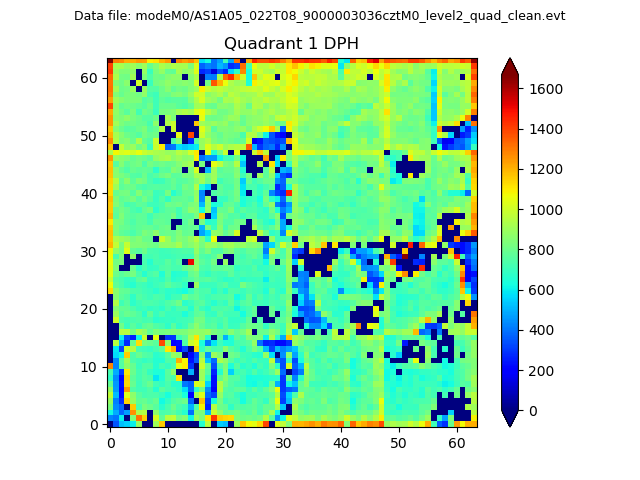
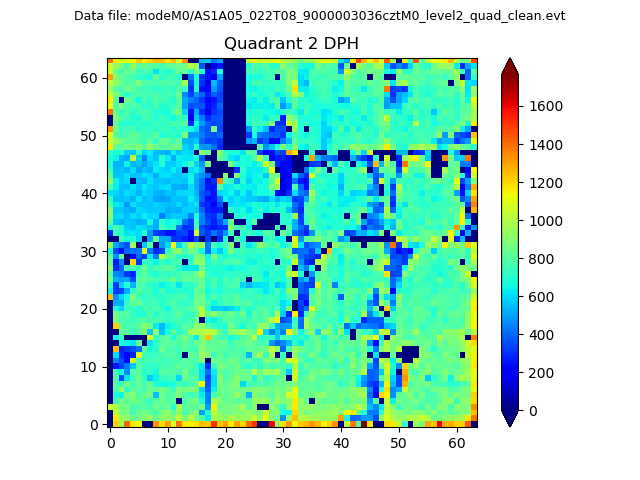
Histogram calculated using DETX and DETY for each event in the final _common_clean file
| Quadrant A |  |
 |
Quadrant B |
|---|---|---|---|
| Quadrant D |  |
 |
Quadrant C |
| Plot type | Count rate plots | Images |
|---|---|---|
| Comparison with Poisson distribution Blue bars denote a histogram of data divided into 1 sec bins. Red curve is a Poisson curve with rate = median count rate of data. |
 |
 |
| Quadrant-wise count rates Data is divided into 100 sec bins |
 |
|
| Module-wise count rates for Quadrant A Data is divided into 100 sec bins |
 |
 |
| Module-wise count rates for Quadrant B Data is divided into 100 sec bins |
 |
 |
| Module-wise count rates for Quadrant C Data is divided into 100 sec bins |
 |
 |
| Module-wise count rates for Quadrant D Data is divided into 100 sec bins |
 |
 |
| Parameter | Plot |
|---|---|
| CZT HV Monitor |  |
| D_VDD |  |
| Temperature 1 |  |
| Veto HV Monitor |  |
| Veto LLD |  |
| Alpha Counter |  |
| _CPM_Rate |  |
| CZT Counter |  |
| +2.5 Volts monitor |  |
| +5 Volts monitor |  |
| _ROLL_ROT |  |
| _Roll_DEC |  |
| _Roll_RA |  |
| Veto Counter |  |