| Param | Original file | Final file |
|---|---|---|
| Filename | modeM0/AS1A05_022T08_9000003036_20537cztM0_level2.evt | modeM0/AS1A05_022T08_9000003036_20537cztM0_level2_quad_clean.evt |
| Size (bytes) | 263,471,040 | 32,837,760 |
| Size | 251.3 MB | 31.3 MB |
| Events in quadrant A | 2,194,670 | 204,084 |
| Events in quadrant B | 1,818,936 | 209,359 |
| Events in quadrant C | 1,852,435 | 193,672 |
| Events in quadrant D | 1,918,068 | 182,870 |
| Mode SS | |||
|---|---|---|---|
| Quadrant | BADHDUFLAG | Total packets | Discarded packets |
| A | 0 | 60 | 0 |
| B | 0 | 60 | 0 |
| C | 0 | 60 | 0 |
| D | 0 | 60 | 0 |
| Mode M0 | |||
|---|---|---|---|
| Quadrant | BADHDUFLAG | Total packets | Discarded packets |
| A | 0 | 8356 | 2 |
| B | 0 | 7222 | 1 |
| C | 0 | 7260 | 1 |
| D | 0 | 7550 | 1 |
| Mode M9 | |||
|---|---|---|---|
| Quadrant | BADHDUFLAG | Total packets | Discarded packets |
| A | 0 | 12 | 0 |
| B | 0 | 12 | 0 |
| C | 0 | 12 | 0 |
| D | 0 | 12 | 0 |
| Quadrant | Total seconds | Saturated seconds | Saturation percentage |
|---|---|---|---|
| A | 2851 | 186 | 6.524027% |
| B | 2851 | 89 | 3.121712% |
| C | 2851 | 125 | 4.384427% |
| D | 2851 | 139 | 4.875482% |
Noise dominated data is calculated using 1-second bins in cleaned event files. If a bin has >2000 counts, and if more than 50% of those come from <1% of pixels, then it is considered to be noise-dominated and hence unusable.
| Quadrant | # 1 sec bins | Bins with >0 counts | Bins with >2000 counts | High rate bins dominated by noise | Noise dominated (total time) | Noise dominated (detector-on time) | Marked lightcurve |
|---|---|---|---|---|---|---|---|
| A | 4056 | 2852 | 80 | 80 | 1.97% | 2.81% | 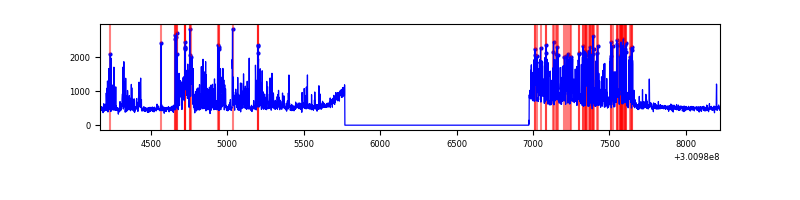 |
| B | 4056 | 2852 | 16 | 16 | 0.39% | 0.56% | 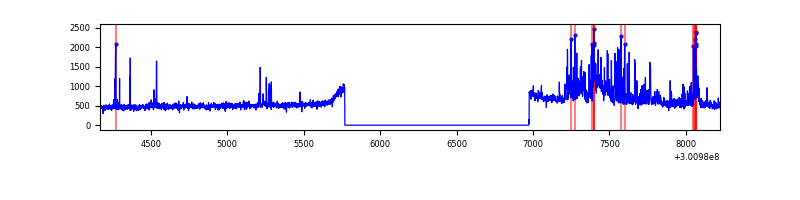 |
| C | 4056 | 2852 | 10 | 10 | 0.25% | 0.35% | 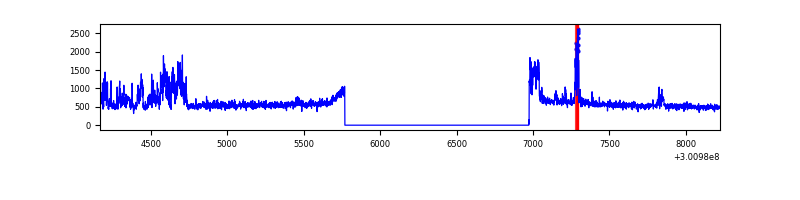 |
| D | 4056 | 2852 | 89 | 89 | 2.19% | 3.12% | 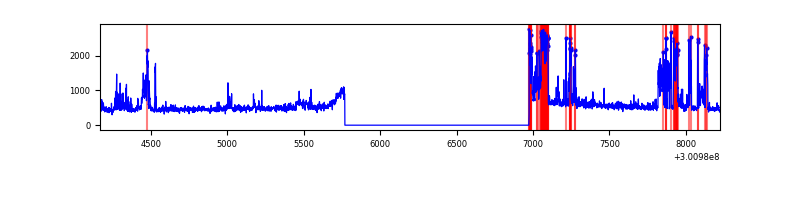 |
Top three noisy pixels from each quadrant. If the there are fewer than three noisy pixels in the level2.evt file, extra rows are filled as -1
| Pixel properties | Quadrant properties | ||||||
|---|---|---|---|---|---|---|---|
| Quadrant | DetID | PixID | Counts | Sigma | Mean | Median | Sigma |
| A | 6 | 16 | 681453 | 8518.26 | 389 | 383 | 80.0 |
| A | 5 | 16 | 8455 | 100.96 | 389 | 383 | 80.0 |
| A | 8 | 205 | 5533 | 64.41 | 389 | 383 | 80.0 |
| B | 7 | 220 | 135432 | 1819.07 | 388 | 379 | 74.2 |
| B | 0 | 197 | 52069 | 696.23 | 388 | 379 | 74.2 |
| B | 5 | 172 | 30428 | 404.74 | 388 | 379 | 74.2 |
| C | 9 | 221 | 318326 | 3630.48 | 368 | 371 | 87.6 |
| C | 14 | 238 | 58108 | 659.25 | 368 | 371 | 87.6 |
| C | 0 | 207 | 32183 | 363.24 | 368 | 371 | 87.6 |
| D | 1 | 52 | 220394 | 2392.27 | 372 | 361 | 92.0 |
| D | 12 | 238 | 105720 | 1145.49 | 372 | 361 | 92.0 |
| D | 7 | 38 | 91137 | 986.94 | 372 | 361 | 92.0 |
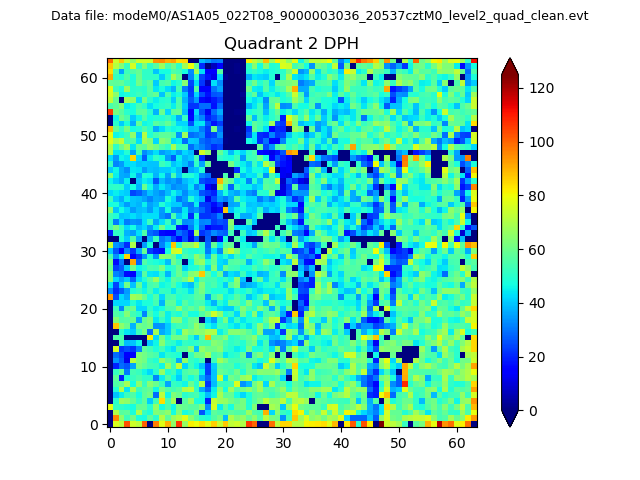
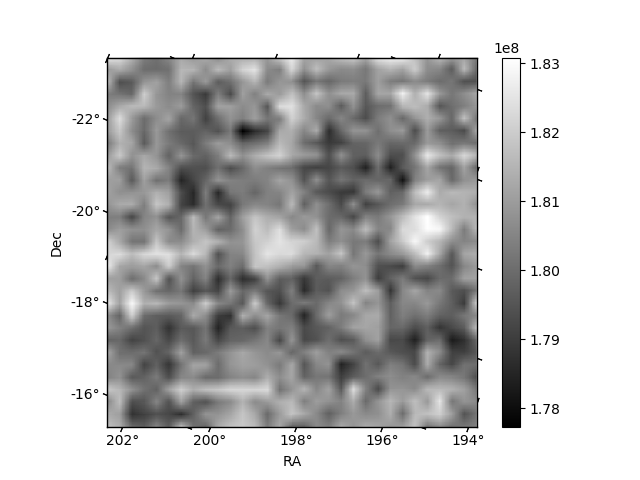
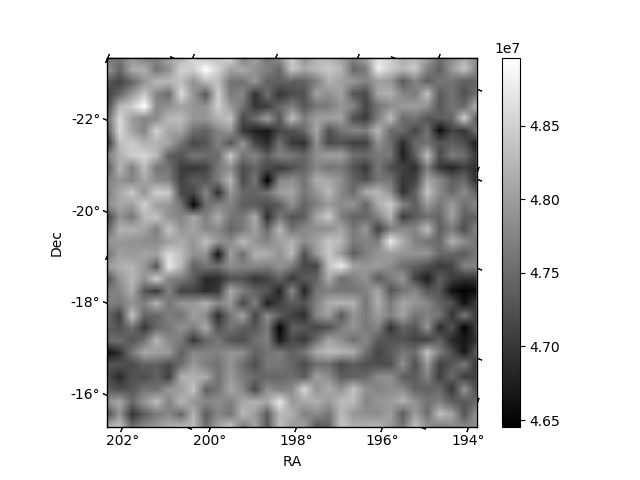
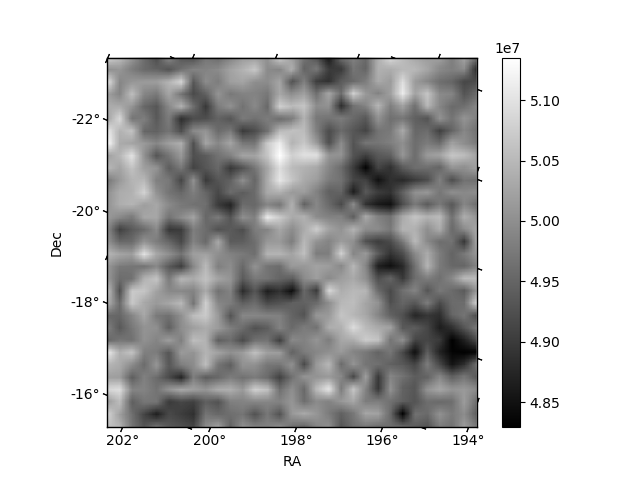
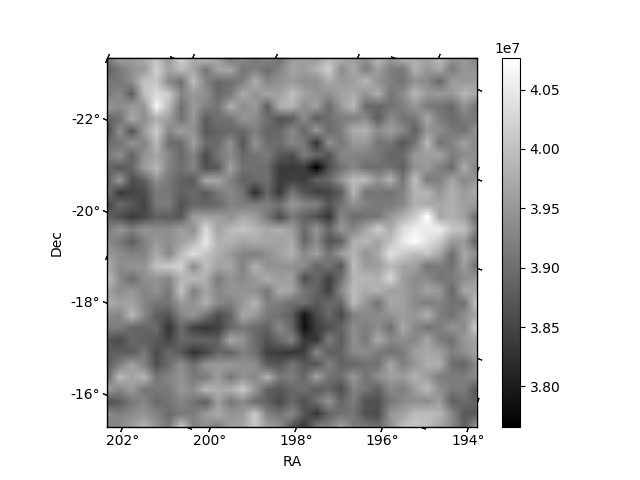
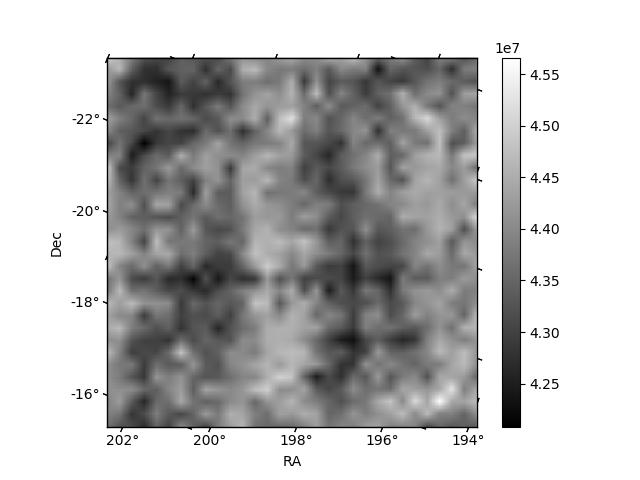
Histogram calculated using DETX and DETY for each event in the final _common_clean file
| Quadrant A | 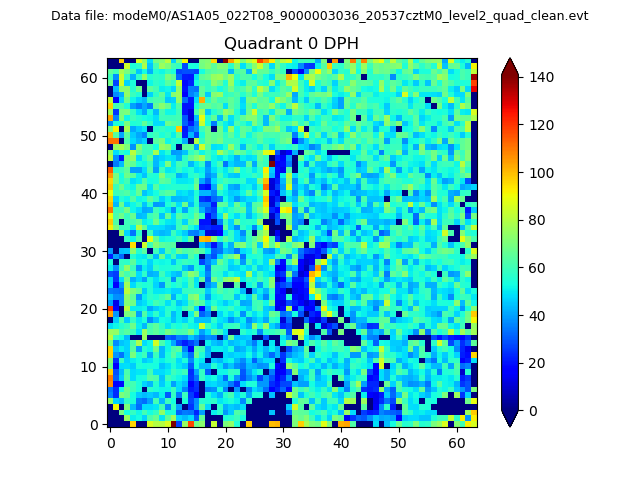 |
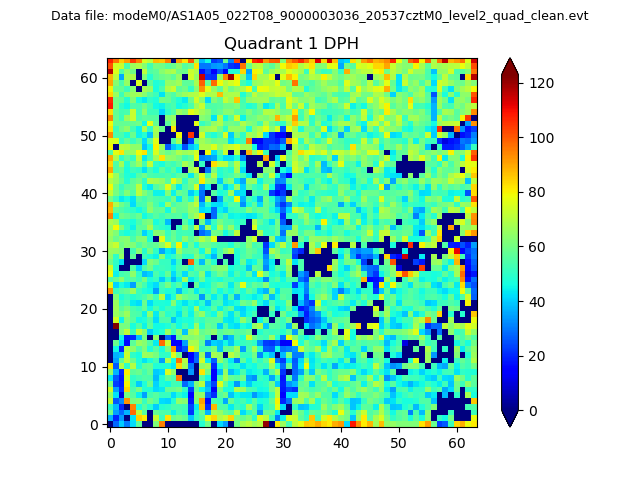 |
Quadrant B |
|---|---|---|---|
| Quadrant D | 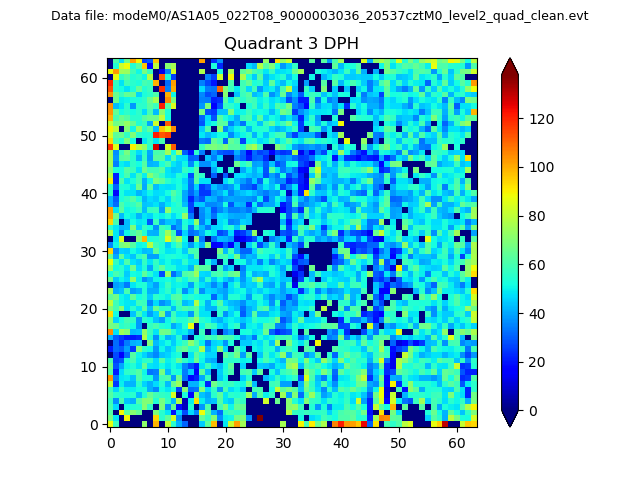 |
 |
Quadrant C |
| Plot type | Count rate plots | Images |
|---|---|---|
| Comparison with Poisson distribution Blue bars denote a histogram of data divided into 1 sec bins. Red curve is a Poisson curve with rate = median count rate of data. |
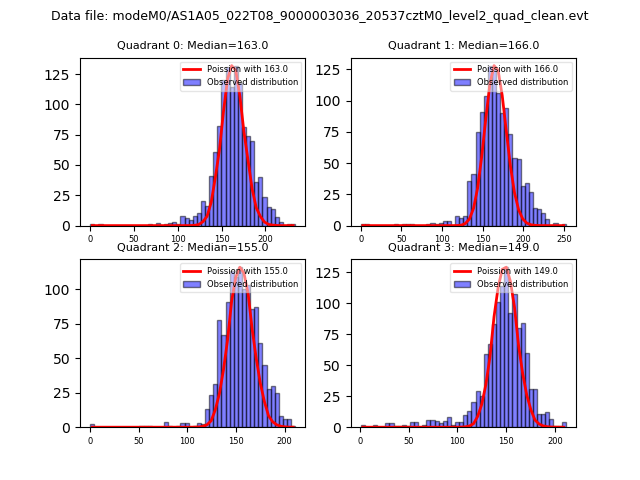 |
 |
| Quadrant-wise count rates Data is divided into 100 sec bins |
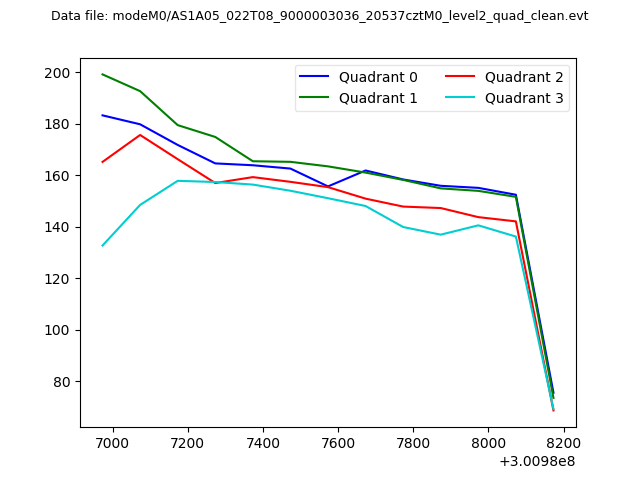 |
|
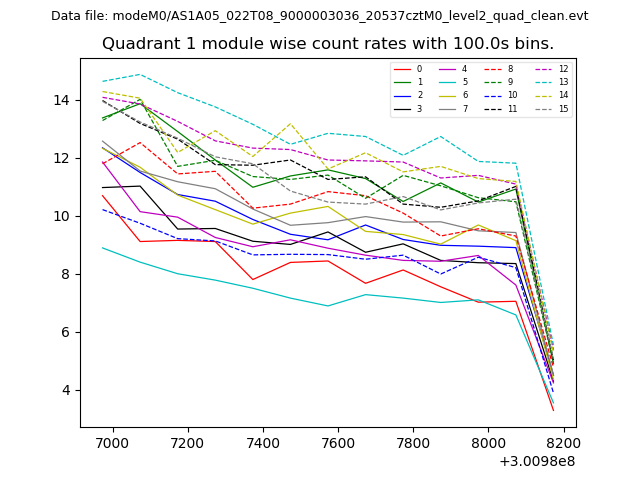
| Module-wise count rates for Quadrant A Data is divided into 100 sec bins |
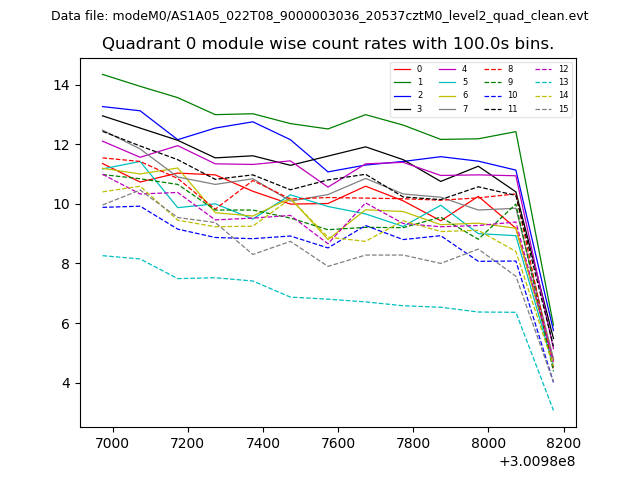 |
 |
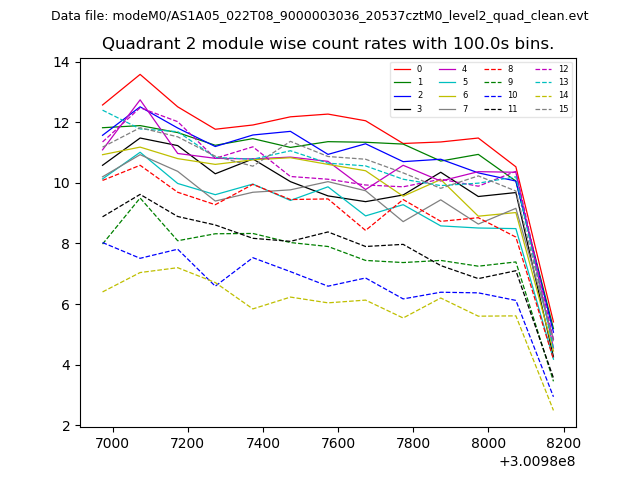
| Module-wise count rates for Quadrant B Data is divided into 100 sec bins |
 |
 |
| Module-wise count rates for Quadrant C Data is divided into 100 sec bins |
 |
 |
| Module-wise count rates for Quadrant D Data is divided into 100 sec bins |
 |
 |
| Parameter | Plot |
|---|---|
| CZT HV Monitor | 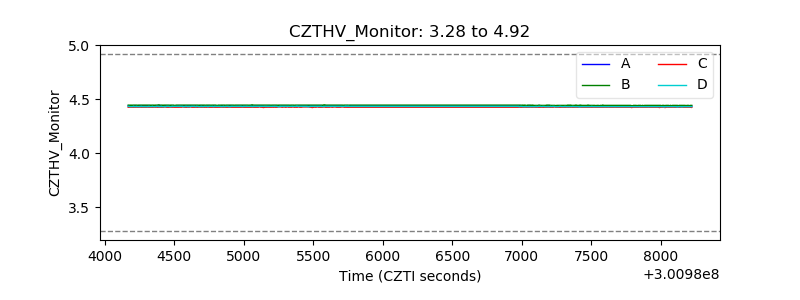 |
| D_VDD | 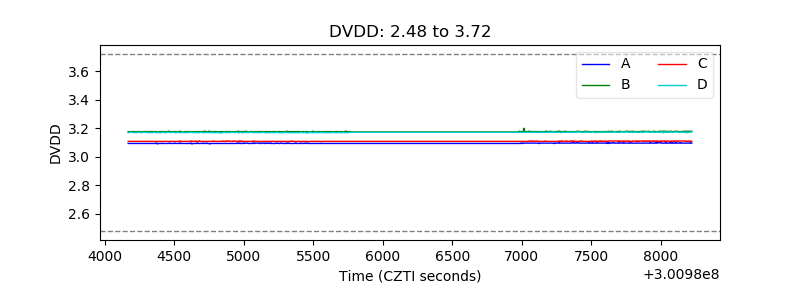 |
| Temperature 1 | 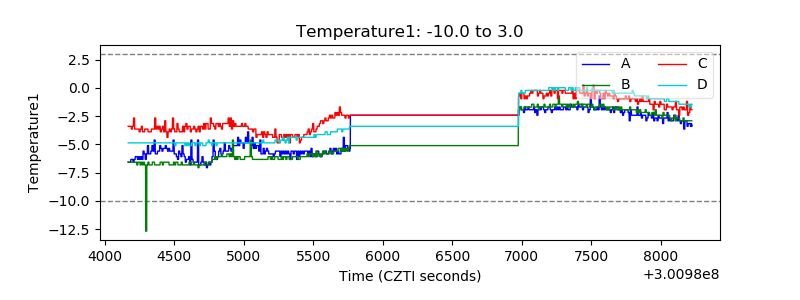 |
| Veto HV Monitor | 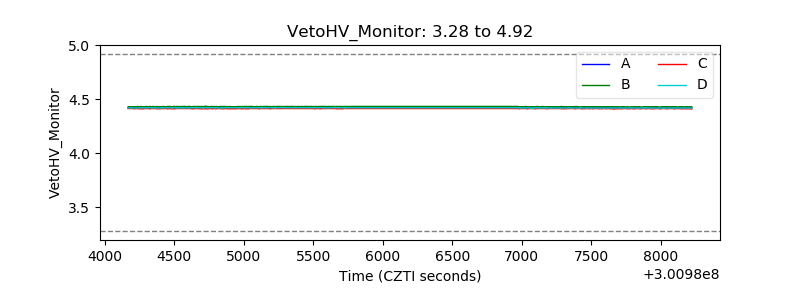 |
| Veto LLD | 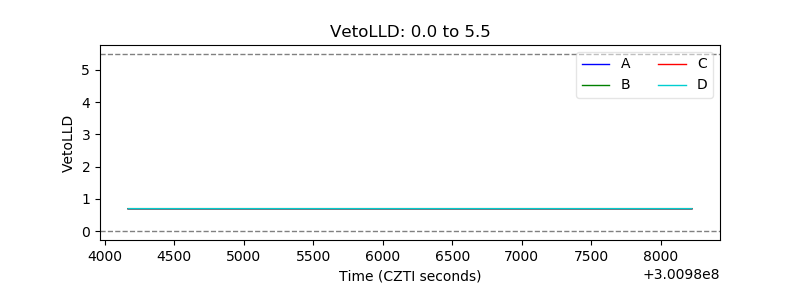 |
| Alpha Counter | 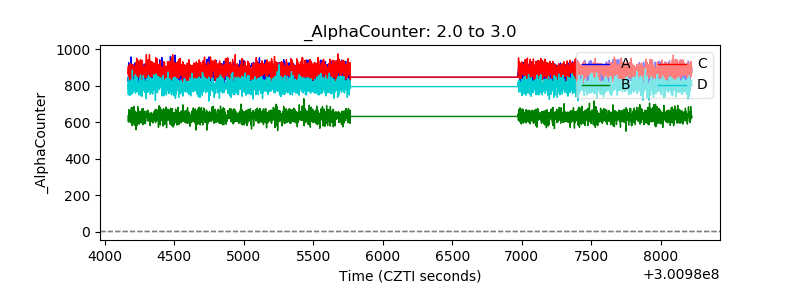 |
| _CPM_Rate | 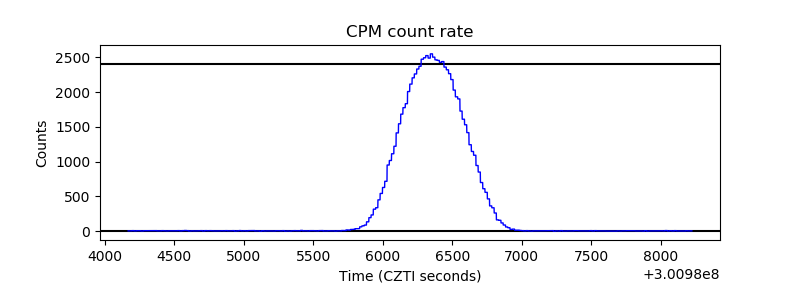 |
| CZT Counter | 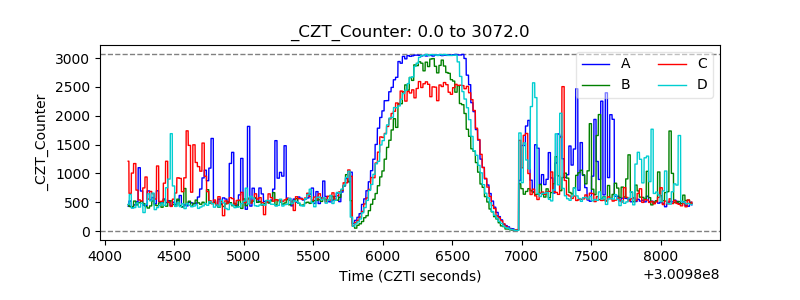 |
| +2.5 Volts monitor |  |
| +5 Volts monitor |  |
| _ROLL_ROT | 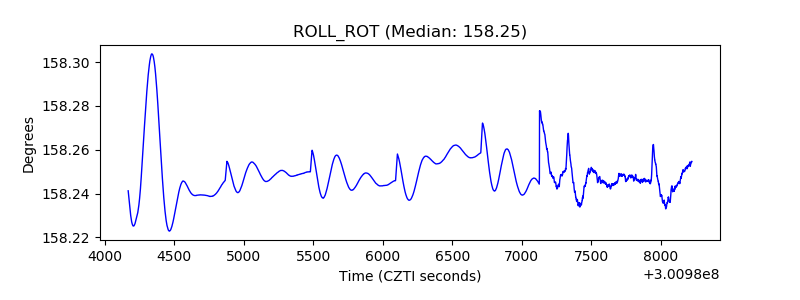 |
| _Roll_DEC | 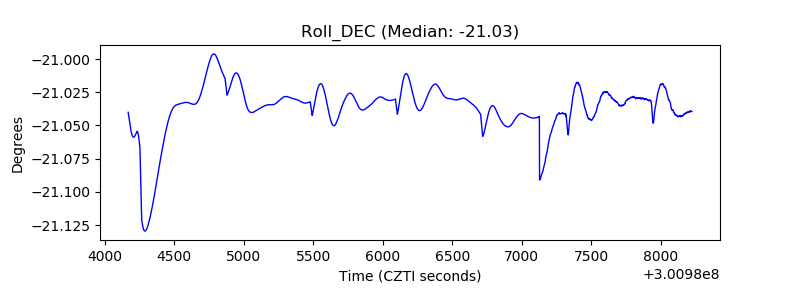 |
| _Roll_RA | 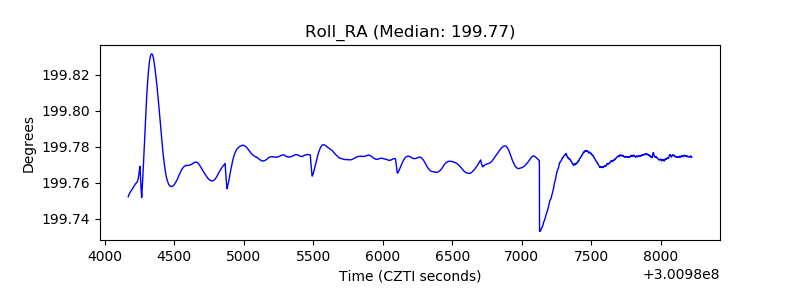 |
| Veto Counter |  |