| Param | Original file | Final file |
|---|---|---|
| Filename | modeM0/AS1A05_022T08_9000003036_20538cztM0_level2.evt | modeM0/AS1A05_022T08_9000003036_20538cztM0_level2_quad_clean.evt |
| Size (bytes) | 518,895,360 | 92,044,800 |
| Size | 494.9 MB | 87.8 MB |
| Events in quadrant A | 3,825,410 | 614,508 |
| Events in quadrant B | 3,605,056 | 624,246 |
| Events in quadrant C | 3,309,066 | 582,388 |
| Events in quadrant D | 4,557,193 | 535,595 |
| Mode SS | |||
|---|---|---|---|
| Quadrant | BADHDUFLAG | Total packets | Discarded packets |
| A | 0 | 126 | 0 |
| B | 0 | 126 | 0 |
| C | 0 | 126 | 0 |
| D | 0 | 126 | 0 |
| Mode M0 | |||
|---|---|---|---|
| Quadrant | BADHDUFLAG | Total packets | Discarded packets |
| A | 0 | 15339 | 2 |
| B | 0 | 14670 | 2 |
| C | 0 | 13682 | 2 |
| D | 0 | 17590 | 2 |
| Mode M9 | |||
|---|---|---|---|
| Quadrant | BADHDUFLAG | Total packets | Discarded packets |
| A | 0 | 13 | 0 |
| B | 0 | 14 | 0 |
| C | 0 | 14 | 0 |
| D | 0 | 14 | 0 |
| Quadrant | Total seconds | Saturated seconds | Saturation percentage |
|---|---|---|---|
| A | 6163 | 190 | 3.082914% |
| B | 6163 | 94 | 1.525231% |
| C | 6163 | 128 | 2.076911% |
| D | 6163 | 439 | 7.123154% |
Noise dominated data is calculated using 1-second bins in cleaned event files. If a bin has >2000 counts, and if more than 50% of those come from <1% of pixels, then it is considered to be noise-dominated and hence unusable.
| Quadrant | # 1 sec bins | Bins with >0 counts | Bins with >2000 counts | High rate bins dominated by noise | Noise dominated (total time) | Noise dominated (detector-on time) | Marked lightcurve |
|---|---|---|---|---|---|---|---|
| A | 7473 | 6164 | 86 | 86 | 1.15% | 1.40% | 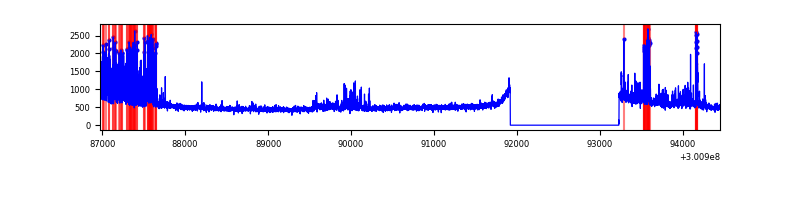 |
| B | 7473 | 6164 | 23 | 23 | 0.31% | 0.37% | 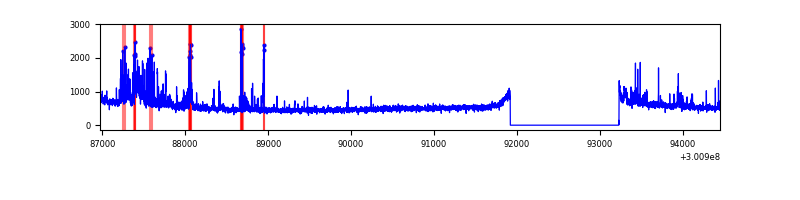 |
| C | 7473 | 6164 | 10 | 10 | 0.13% | 0.16% | 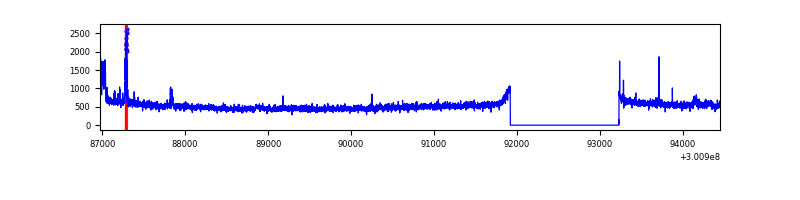 |
| D | 7473 | 6164 | 391 | 391 | 5.23% | 6.34% | 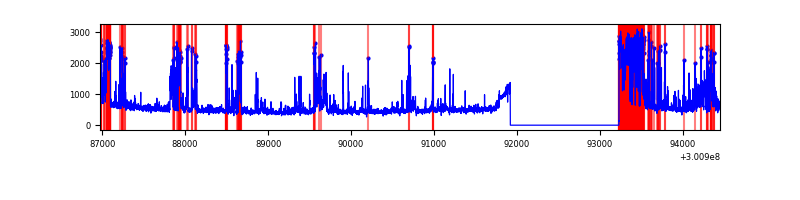 |
Top three noisy pixels from each quadrant. If the there are fewer than three noisy pixels in the level2.evt file, extra rows are filled as -1
| Pixel properties | Quadrant properties | ||||||
|---|---|---|---|---|---|---|---|
| Quadrant | DetID | PixID | Counts | Sigma | Mean | Median | Sigma |
| A | 6 | 16 | 670854 | 4097.17 | 815 | 801 | 163.5 |
| A | 14 | 254 | 13190 | 75.76 | 815 | 801 | 163.5 |
| A | 0 | 226 | 7274 | 39.58 | 815 | 801 | 163.5 |
| B | 7 | 220 | 179945 | 1167.85 | 812 | 795 | 153.4 |
| B | 0 | 197 | 67788 | 436.72 | 812 | 795 | 153.4 |
| B | 0 | 190 | 60015 | 386.05 | 812 | 795 | 153.4 |
| C | 9 | 221 | 142383 | 792.98 | 768 | 776 | 178.6 |
| C | 14 | 238 | 122065 | 679.2 | 768 | 776 | 178.6 |
| C | 0 | 207 | 38760 | 212.71 | 768 | 776 | 178.6 |
| D | 1 | 52 | 860729 | 4675.62 | 754 | 732 | 183.9 |
| D | 12 | 238 | 479962 | 2605.47 | 754 | 732 | 183.9 |
| D | 7 | 38 | 167021 | 904.08 | 754 | 732 | 183.9 |
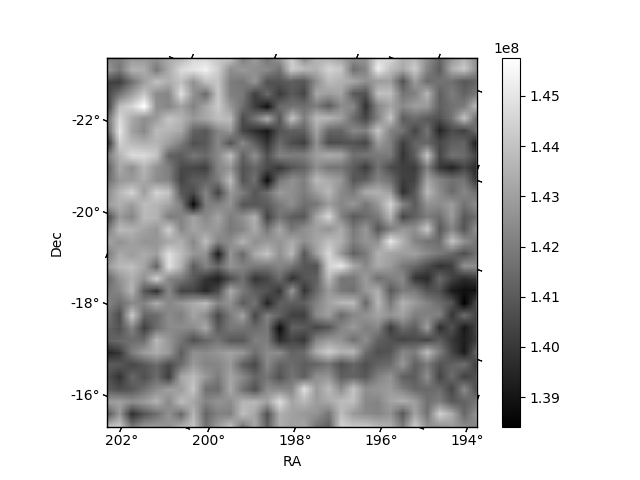
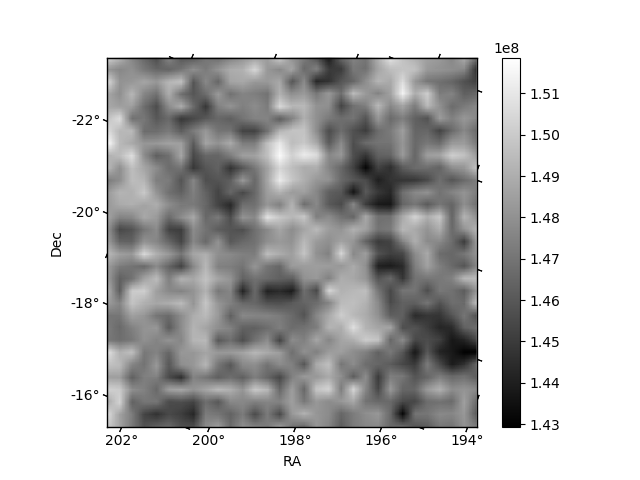
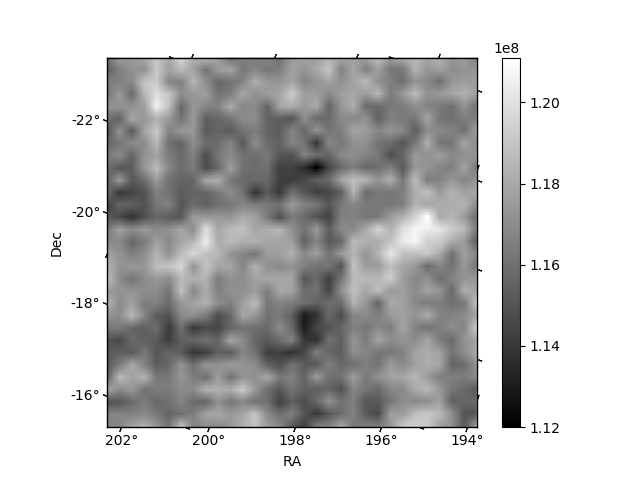
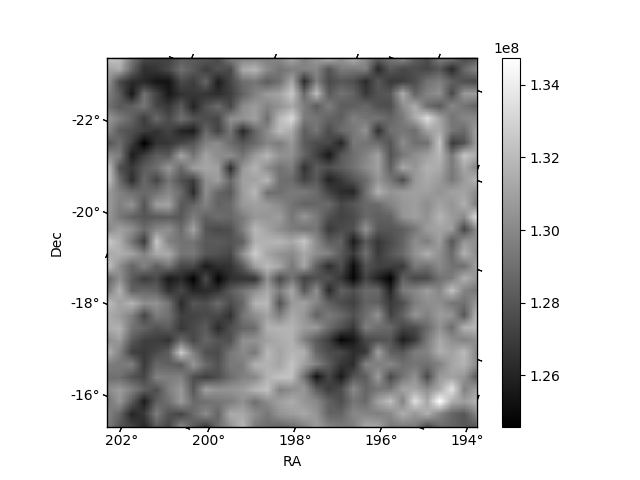
Histogram calculated using DETX and DETY for each event in the final _common_clean file
| Quadrant A |  |
 |
Quadrant B |
|---|---|---|---|
| Quadrant D |  |
 |
Quadrant C |
| Plot type | Count rate plots | Images |
|---|---|---|
| Comparison with Poisson distribution Blue bars denote a histogram of data divided into 1 sec bins. Red curve is a Poisson curve with rate = median count rate of data. |
 |
 |
| Quadrant-wise count rates Data is divided into 100 sec bins |
 |
|
| Module-wise count rates for Quadrant A Data is divided into 100 sec bins |
 |
 |
| Module-wise count rates for Quadrant B Data is divided into 100 sec bins |
 |
 |
| Module-wise count rates for Quadrant C Data is divided into 100 sec bins |
 |
 |
| Module-wise count rates for Quadrant D Data is divided into 100 sec bins |
 |
 |
| Parameter | Plot |
|---|---|
| CZT HV Monitor |  |
| D_VDD | 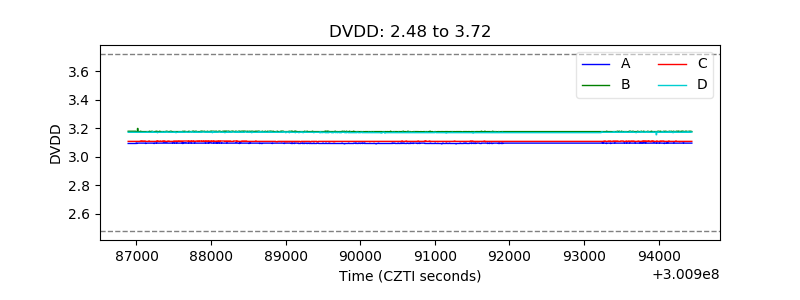 |
| Temperature 1 | 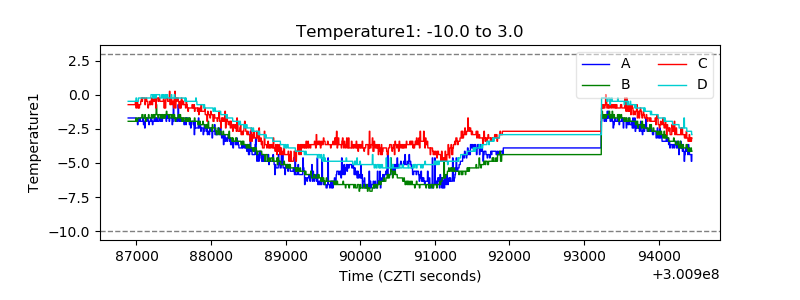 |
| Veto HV Monitor |  |
| Veto LLD |  |
| Alpha Counter |  |
| _CPM_Rate |  |
| CZT Counter |  |
| +2.5 Volts monitor |  |
| +5 Volts monitor |  |
| _ROLL_ROT |  |
| _Roll_DEC |  |
| _Roll_RA |  |
| Veto Counter |  |