| Param | Original file | Final file |
|---|---|---|
| Filename | modeM0/AS1A05_022T08_9000003036_20539cztM0_level2.evt | modeM0/AS1A05_022T08_9000003036_20539cztM0_level2_quad_clean.evt |
| Size (bytes) | 496,365,120 | 91,255,680 |
| Size | 473.4 MB | 87.0 MB |
| Events in quadrant A | 3,417,107 | 610,155 |
| Events in quadrant B | 3,366,547 | 621,583 |
| Events in quadrant C | 3,440,172 | 576,836 |
| Events in quadrant D | 4,397,577 | 531,637 |
| Mode SS | |||
|---|---|---|---|
| Quadrant | BADHDUFLAG | Total packets | Discarded packets |
| A | 0 | 124 | 0 |
| B | 0 | 124 | 0 |
| C | 0 | 124 | 0 |
| D | 0 | 124 | 0 |
| Mode M0 | |||
|---|---|---|---|
| Quadrant | BADHDUFLAG | Total packets | Discarded packets |
| A | 0 | 13937 | 2 |
| B | 0 | 13740 | 2 |
| C | 0 | 13988 | 2 |
| D | 0 | 16986 | 2 |
| Mode M9 | |||
|---|---|---|---|
| Quadrant | BADHDUFLAG | Total packets | Discarded packets |
| A | 0 | 20 | 0 |
| B | 0 | 21 | 0 |
| C | 0 | 21 | 0 |
| D | 0 | 21 | 0 |
| Quadrant | Total seconds | Saturated seconds | Saturation percentage |
|---|---|---|---|
| A | 6057 | 80 | 1.320786% |
| B | 6057 | 74 | 1.221727% |
| C | 6057 | 106 | 1.750041% |
| D | 6057 | 433 | 7.148754% |
Noise dominated data is calculated using 1-second bins in cleaned event files. If a bin has >2000 counts, and if more than 50% of those come from <1% of pixels, then it is considered to be noise-dominated and hence unusable.
| Quadrant | # 1 sec bins | Bins with >0 counts | Bins with >2000 counts | High rate bins dominated by noise | Noise dominated (total time) | Noise dominated (detector-on time) | Marked lightcurve |
|---|---|---|---|---|---|---|---|
| A | 7427 | 6058 | 35 | 35 | 0.47% | 0.58% |  |
| B | 7427 | 6058 | 6 | 6 | 0.08% | 0.10% | 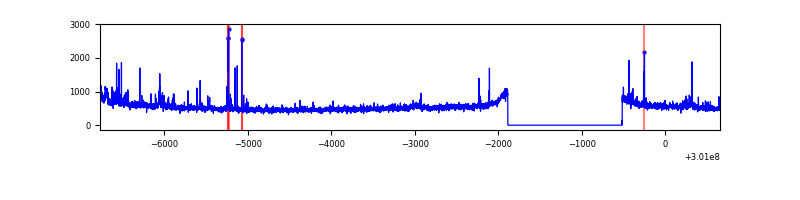 |
| C | 7427 | 6058 | 6 | 6 | 0.08% | 0.10% | 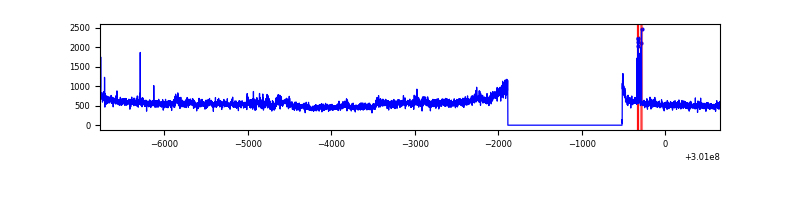 |
| D | 7427 | 6058 | 355 | 355 | 4.78% | 5.86% | 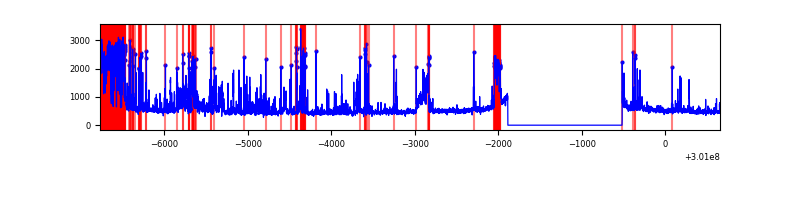 |
Top three noisy pixels from each quadrant. If the there are fewer than three noisy pixels in the level2.evt file, extra rows are filled as -1
| Pixel properties | Quadrant properties | ||||||
|---|---|---|---|---|---|---|---|
| Quadrant | DetID | PixID | Counts | Sigma | Mean | Median | Sigma |
| A | 6 | 16 | 290071 | 1788.26 | 806 | 793 | 161.8 |
| A | 14 | 254 | 12224 | 70.66 | 806 | 793 | 161.8 |
| A | 15 | 222 | 8518 | 47.75 | 806 | 793 | 161.8 |
| B | 0 | 189 | 51988 | 335.13 | 807 | 791 | 152.8 |
| B | 7 | 220 | 46695 | 300.48 | 807 | 791 | 152.8 |
| B | 0 | 190 | 38688 | 248.07 | 807 | 791 | 152.8 |
| C | 9 | 221 | 224503 | 1260.38 | 761 | 767 | 177.5 |
| C | 14 | 238 | 120244 | 673.05 | 761 | 767 | 177.5 |
| C | 8 | 208 | 78365 | 437.14 | 761 | 767 | 177.5 |
| D | 1 | 52 | 564362 | 3159.12 | 741 | 720 | 178.4 |
| D | 12 | 238 | 382438 | 2139.47 | 741 | 720 | 178.4 |
| D | 7 | 38 | 317004 | 1772.72 | 741 | 720 | 178.4 |
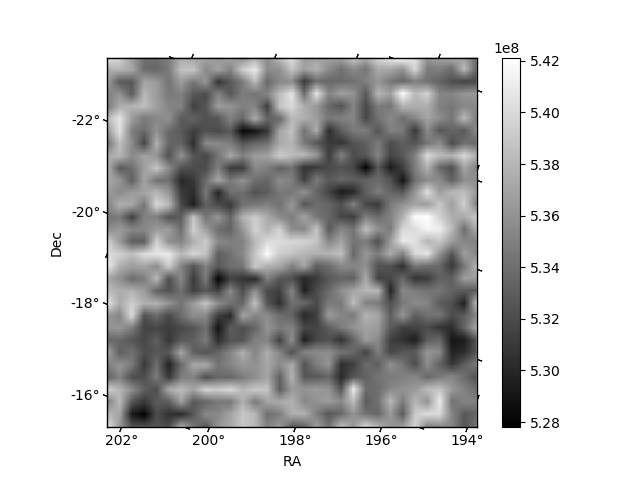
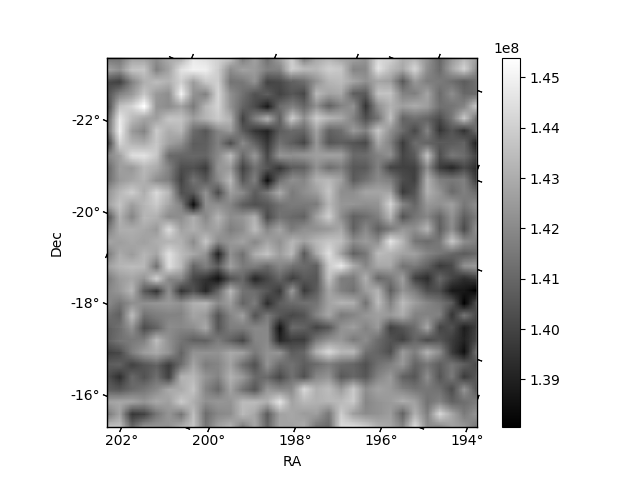
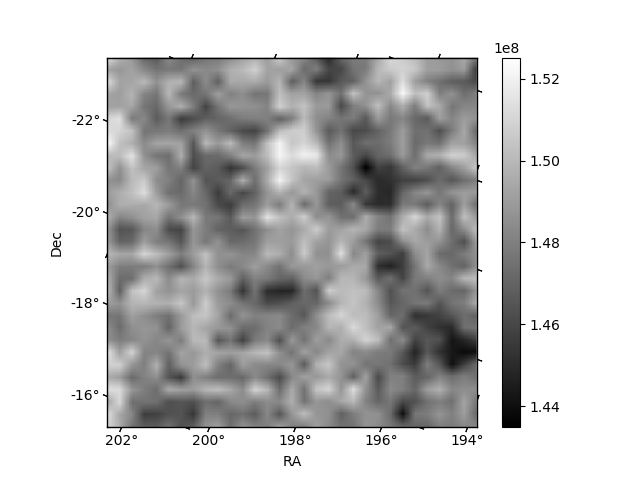
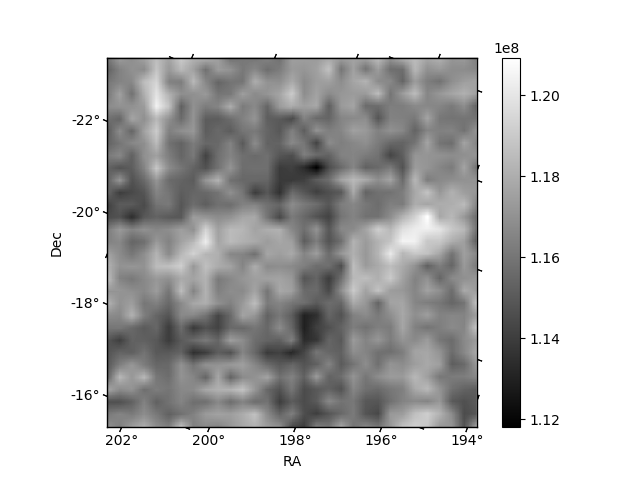
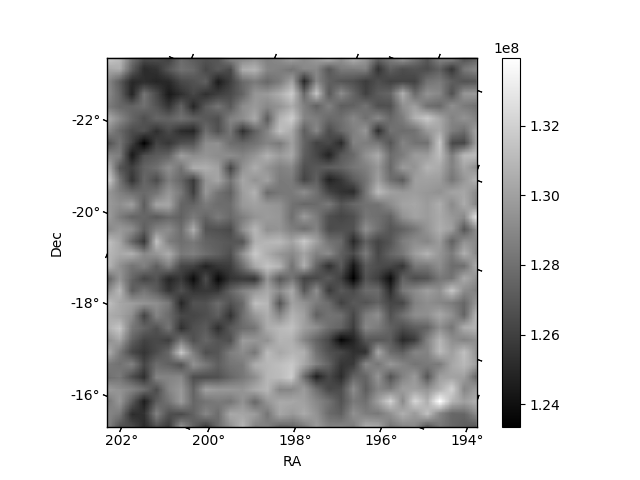
Histogram calculated using DETX and DETY for each event in the final _common_clean file
| Quadrant A | 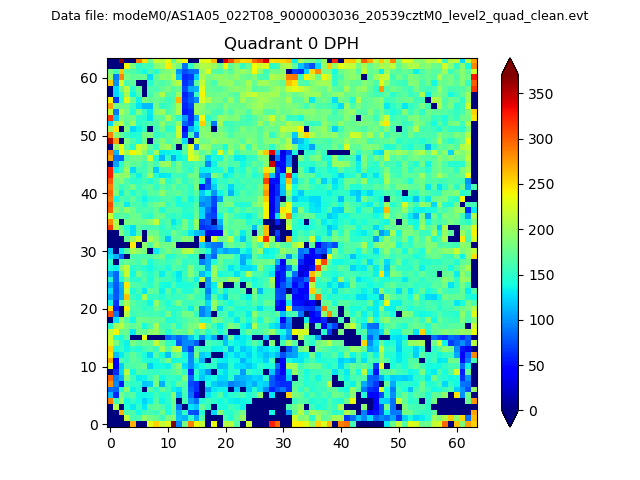 |
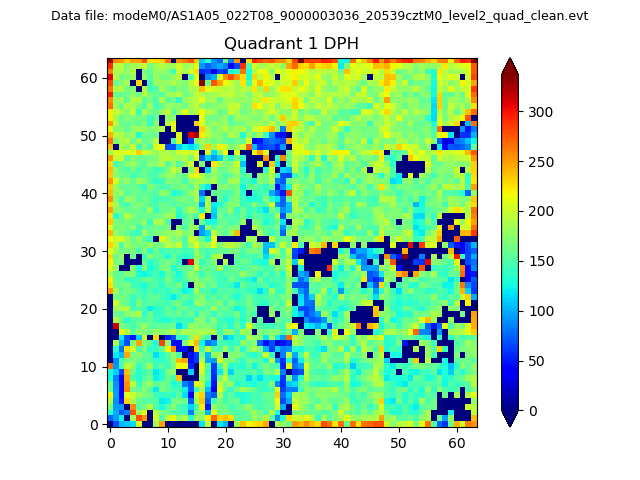 |
Quadrant B |
|---|---|---|---|
| Quadrant D | 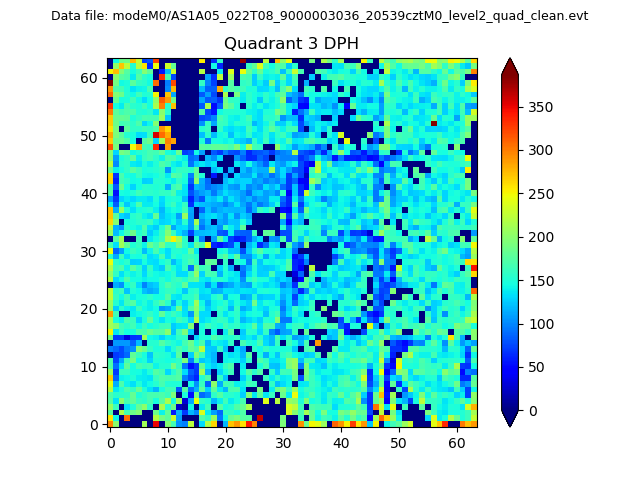 |
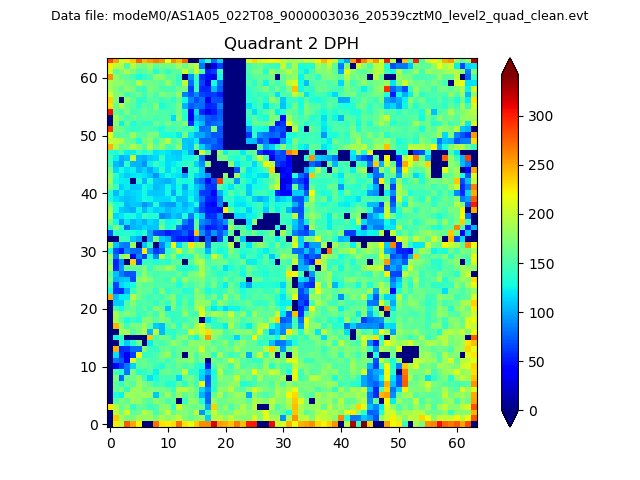 |
Quadrant C |
| Plot type | Count rate plots | Images |
|---|---|---|
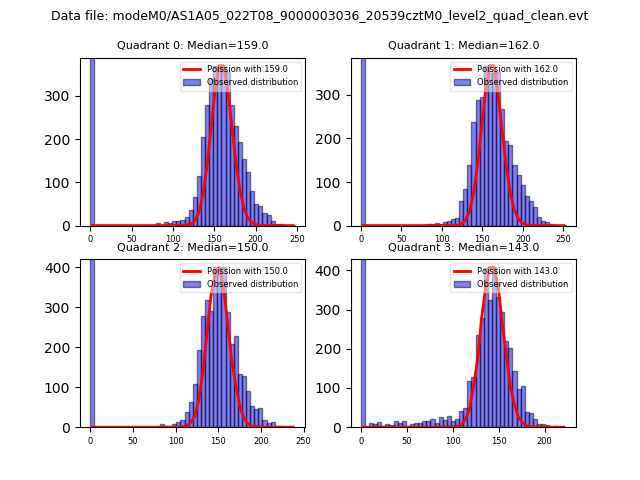
| Comparison with Poisson distribution Blue bars denote a histogram of data divided into 1 sec bins. Red curve is a Poisson curve with rate = median count rate of data. |
 |
 |
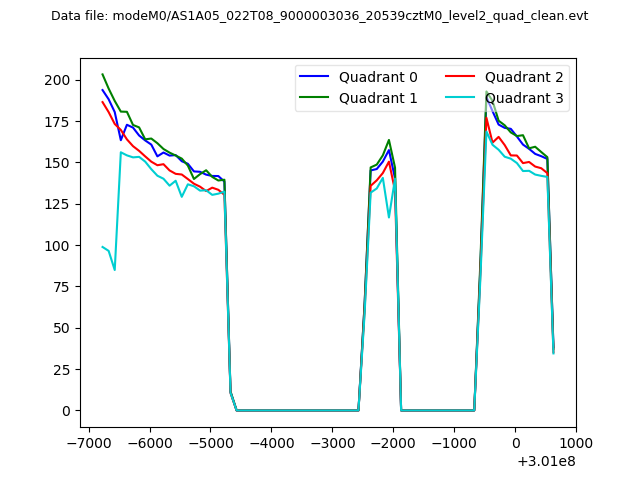
| Quadrant-wise count rates Data is divided into 100 sec bins |
 |
|
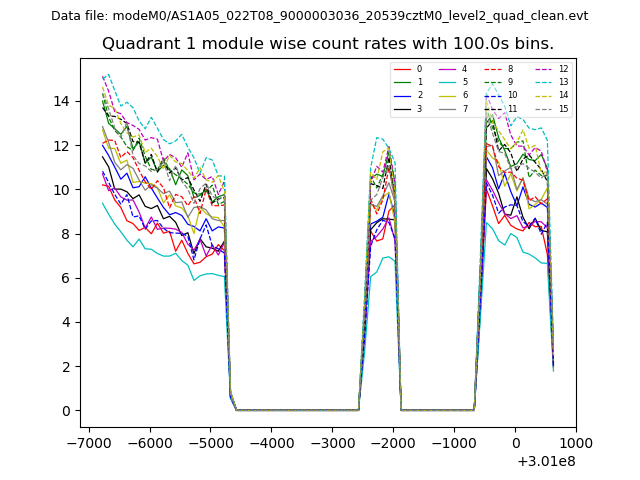
| Module-wise count rates for Quadrant A Data is divided into 100 sec bins |
 |
 |
| Module-wise count rates for Quadrant B Data is divided into 100 sec bins |
 |
 |
| Module-wise count rates for Quadrant C Data is divided into 100 sec bins |
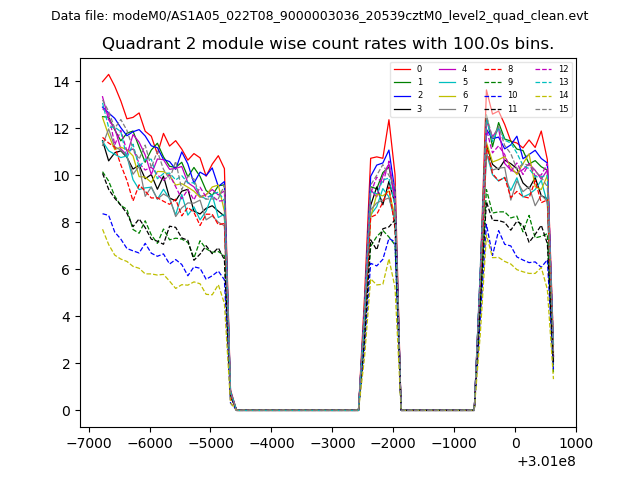 |
 |
| Module-wise count rates for Quadrant D Data is divided into 100 sec bins |
 |
 |
| Parameter | Plot |
|---|---|
| CZT HV Monitor | 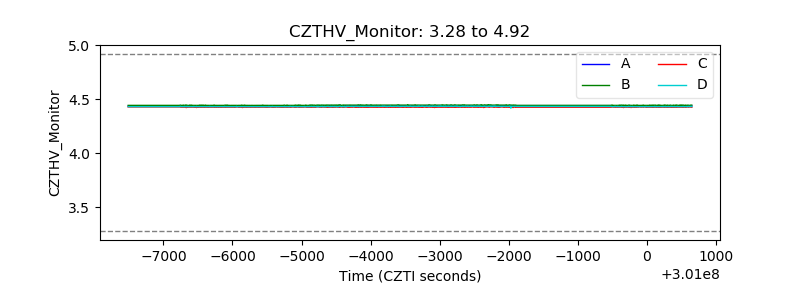 |
| D_VDD |  |
| Temperature 1 | 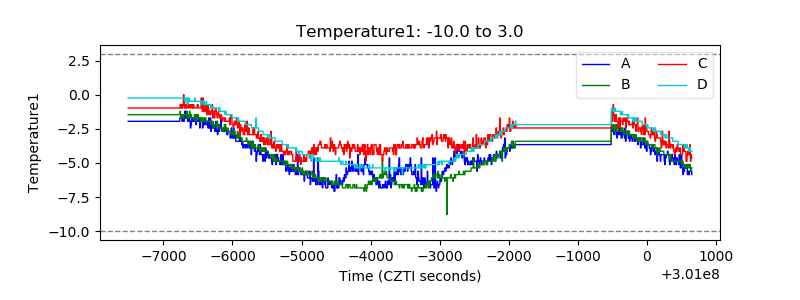 |
| Veto HV Monitor |  |
| Veto LLD |  |
| Alpha Counter | 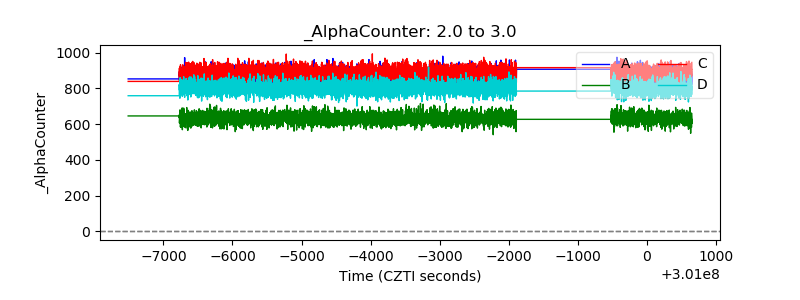 |
| _CPM_Rate | 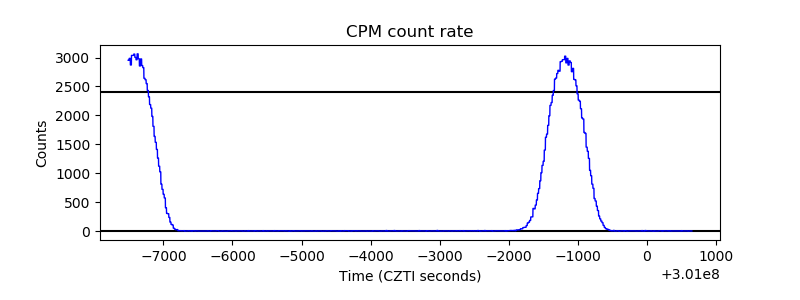 |
| CZT Counter | 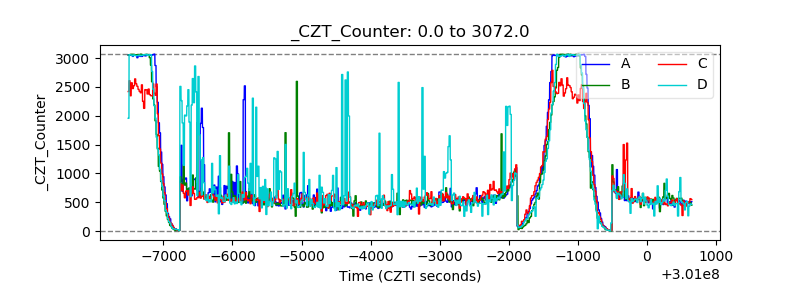 |
| +2.5 Volts monitor |  |
| +5 Volts monitor |  |
| _ROLL_ROT |  |
| _Roll_DEC | 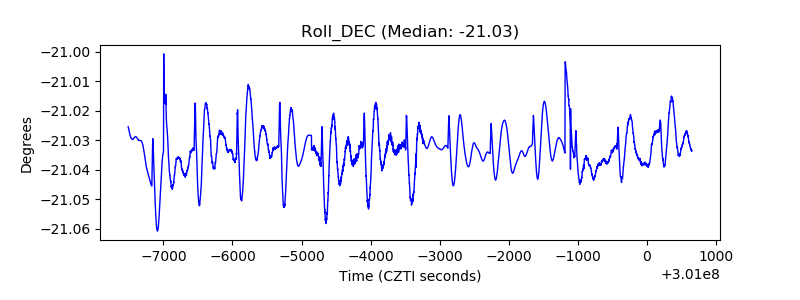 |
| _Roll_RA | 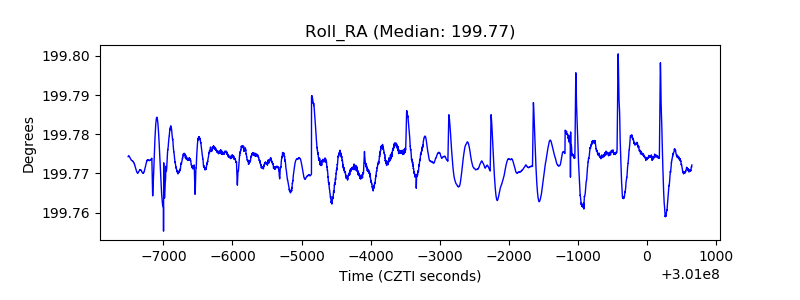 |
| Veto Counter |  |