| Param | Original file | Final file |
|---|---|---|
| Filename | modeM0/AS1A05_022T08_9000003036_20540cztM0_level2.evt | modeM0/AS1A05_022T08_9000003036_20540cztM0_level2_quad_clean.evt |
| Size (bytes) | 451,768,320 | 92,177,280 |
| Size | 430.8 MB | 87.9 MB |
| Events in quadrant A | 3,118,537 | 610,026 |
| Events in quadrant B | 3,276,329 | 619,406 |
| Events in quadrant C | 3,253,892 | 574,977 |
| Events in quadrant D | 3,613,033 | 555,454 |
| Mode SS | |||
|---|---|---|---|
| Quadrant | BADHDUFLAG | Total packets | Discarded packets |
| A | 0 | 126 | 0 |
| B | 0 | 126 | 0 |
| C | 0 | 126 | 0 |
| D | 0 | 126 | 0 |
| Mode M0 | |||
|---|---|---|---|
| Quadrant | BADHDUFLAG | Total packets | Discarded packets |
| A | 0 | 13024 | 2 |
| B | 0 | 13457 | 2 |
| C | 0 | 13448 | 2 |
| D | 0 | 14734 | 2 |
| Mode M9 | |||
|---|---|---|---|
| Quadrant | BADHDUFLAG | Total packets | Discarded packets |
| A | 0 | 17 | 0 |
| B | 0 | 18 | 0 |
| C | 0 | 18 | 0 |
| D | 0 | 18 | 0 |
| Quadrant | Total seconds | Saturated seconds | Saturation percentage |
|---|---|---|---|
| A | 6183 | 17 | 0.274947% |
| B | 6183 | 39 | 0.630762% |
| C | 6183 | 62 | 1.002749% |
| D | 6183 | 114 | 1.843765% |
Noise dominated data is calculated using 1-second bins in cleaned event files. If a bin has >2000 counts, and if more than 50% of those come from <1% of pixels, then it is considered to be noise-dominated and hence unusable.
| Quadrant | # 1 sec bins | Bins with >0 counts | Bins with >2000 counts | High rate bins dominated by noise | Noise dominated (total time) | Noise dominated (detector-on time) | Marked lightcurve |
|---|---|---|---|---|---|---|---|
| A | 7574 | 6185 | 0 | 0 | 0.00% | 0.00% | 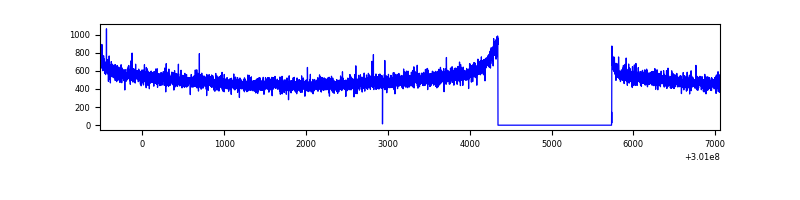 |
| B | 7574 | 6185 | 3 | 3 | 0.04% | 0.05% | 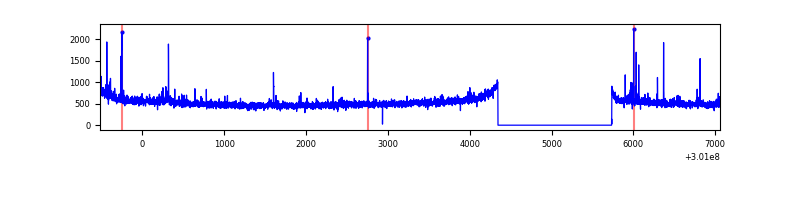 |
| C | 7574 | 6185 | 6 | 6 | 0.08% | 0.10% | 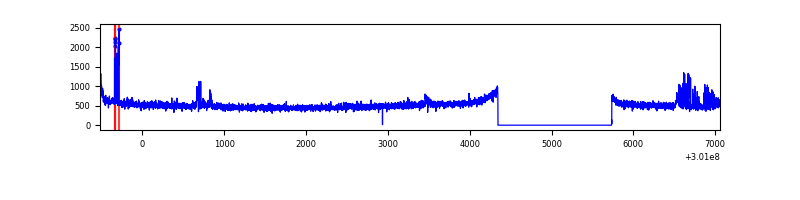 |
| D | 7574 | 6185 | 106 | 106 | 1.40% | 1.71% | 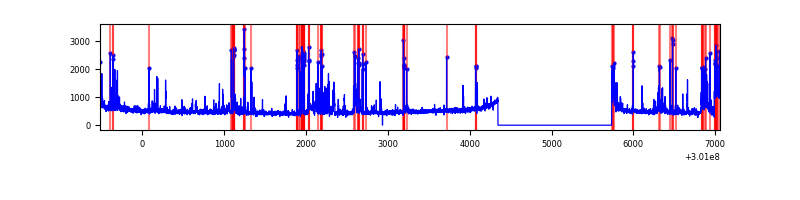 |
Top three noisy pixels from each quadrant. If the there are fewer than three noisy pixels in the level2.evt file, extra rows are filled as -1
| Pixel properties | Quadrant properties | ||||||
|---|---|---|---|---|---|---|---|
| Quadrant | DetID | PixID | Counts | Sigma | Mean | Median | Sigma |
| A | 0 | 226 | 7215 | 39.62 | 809 | 796 | 162.0 |
| A | 3 | 137 | 6209 | 33.41 | 809 | 796 | 162.0 |
| A | 12 | 194 | 5552 | 29.36 | 809 | 796 | 162.0 |
| B | 0 | 189 | 40805 | 260.95 | 809 | 791 | 153.3 |
| B | 7 | 220 | 18363 | 114.59 | 809 | 791 | 153.3 |
| B | 12 | 111 | 17440 | 108.58 | 809 | 791 | 153.3 |
| C | 14 | 238 | 121783 | 679.76 | 764 | 772 | 178.0 |
| C | 8 | 208 | 83494 | 464.68 | 764 | 772 | 178.0 |
| C | 3 | 233 | 46166 | 254.99 | 764 | 772 | 178.0 |
| D | 13 | 153 | 335903 | 1780.73 | 764 | 742 | 188.2 |
| D | 7 | 238 | 148971 | 787.55 | 764 | 742 | 188.2 |
| D | 7 | 38 | 81469 | 428.91 | 764 | 742 | 188.2 |
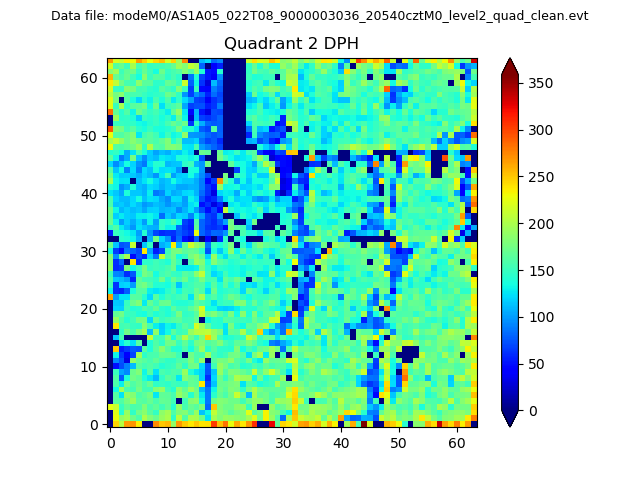
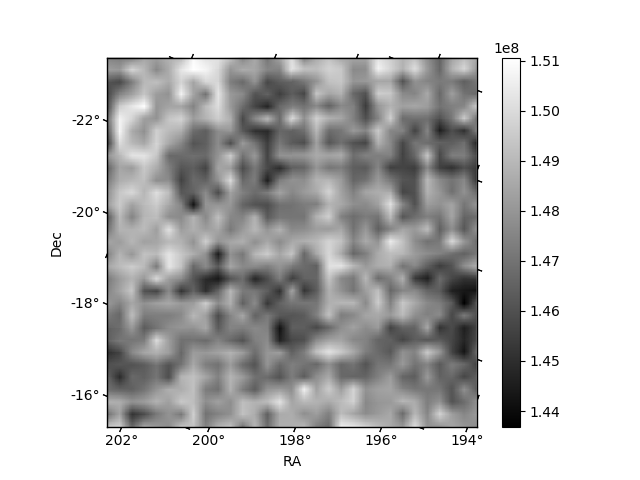
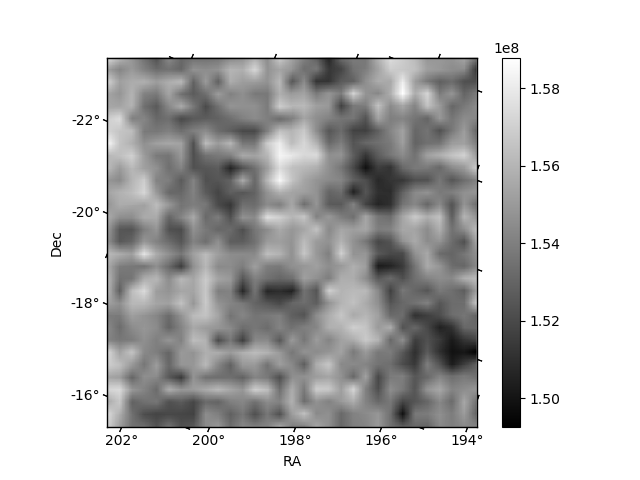
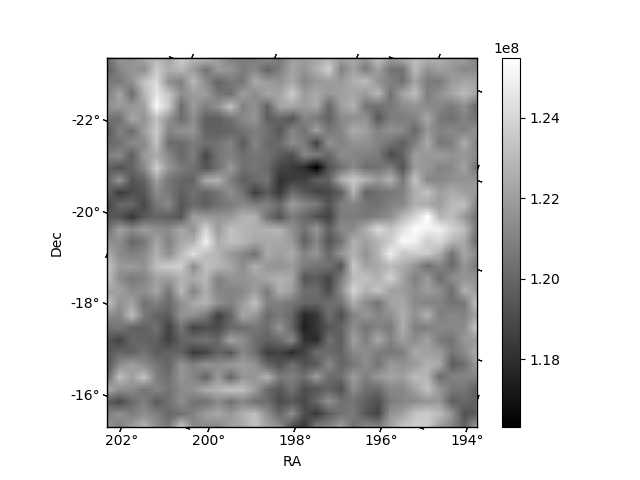
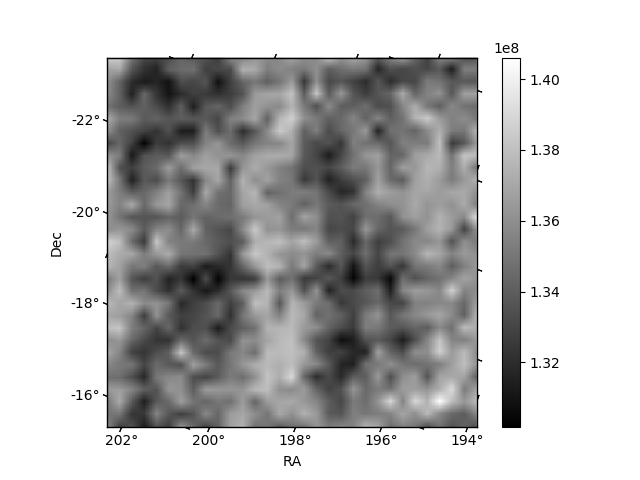
Histogram calculated using DETX and DETY for each event in the final _common_clean file
| Quadrant A |  |
 |
Quadrant B |
|---|---|---|---|
| Quadrant D |  |
 |
Quadrant C |
| Plot type | Count rate plots | Images |
|---|---|---|
| Comparison with Poisson distribution Blue bars denote a histogram of data divided into 1 sec bins. Red curve is a Poisson curve with rate = median count rate of data. |
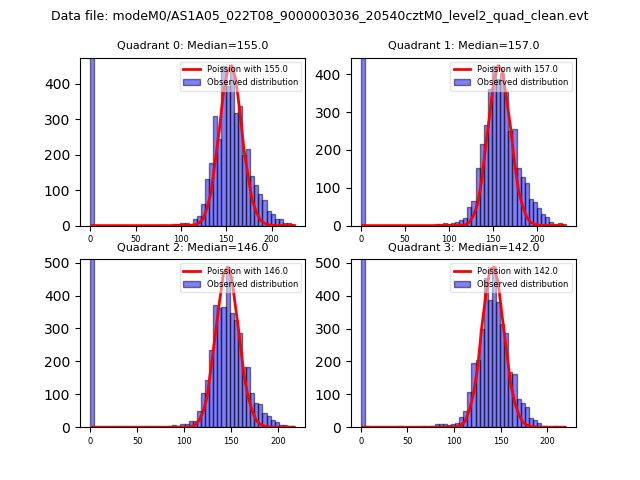 |
 |
| Quadrant-wise count rates Data is divided into 100 sec bins |
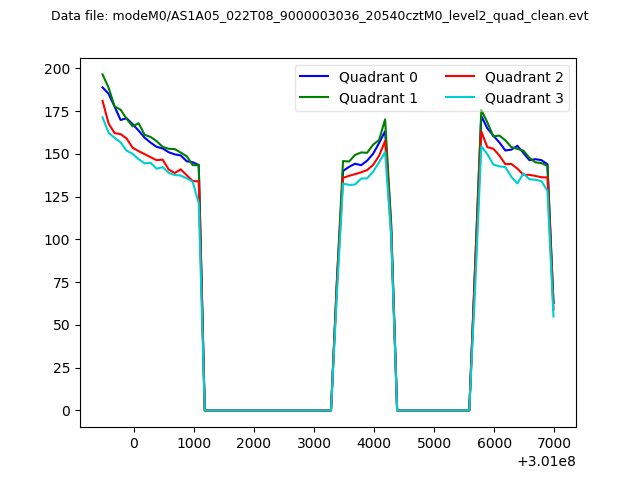 |
|
| Module-wise count rates for Quadrant A Data is divided into 100 sec bins |
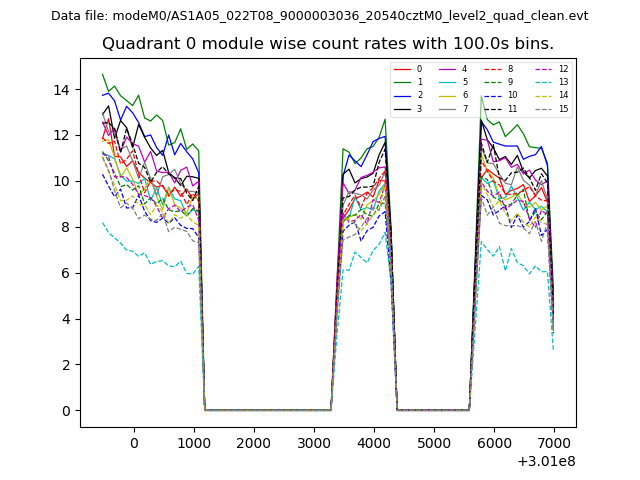 |
 |
| Module-wise count rates for Quadrant B Data is divided into 100 sec bins |
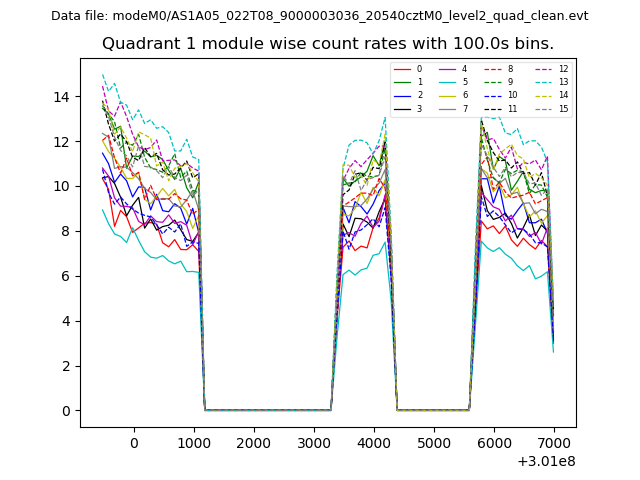 |
 |
| Module-wise count rates for Quadrant C Data is divided into 100 sec bins |
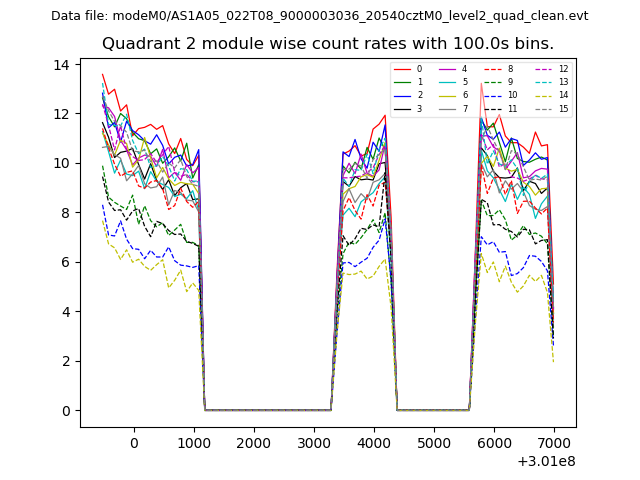 |
 |
| Module-wise count rates for Quadrant D Data is divided into 100 sec bins |
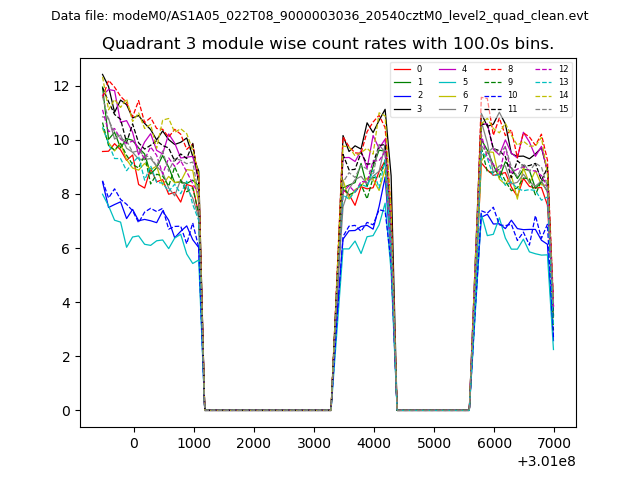 |
 |
| Parameter | Plot |
|---|---|
| CZT HV Monitor | 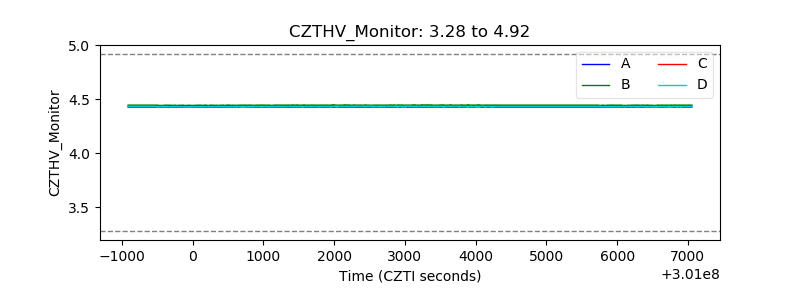 |
| D_VDD | 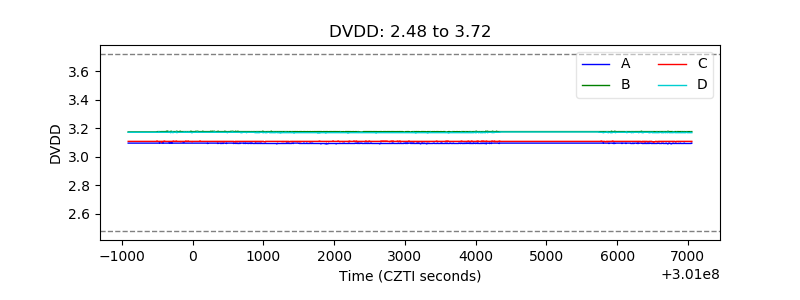 |
| Temperature 1 | 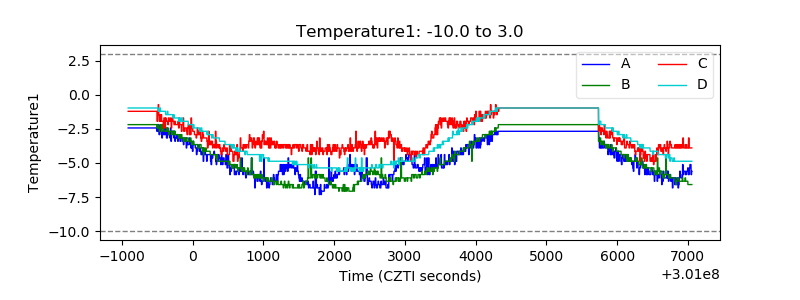 |
| Veto HV Monitor | 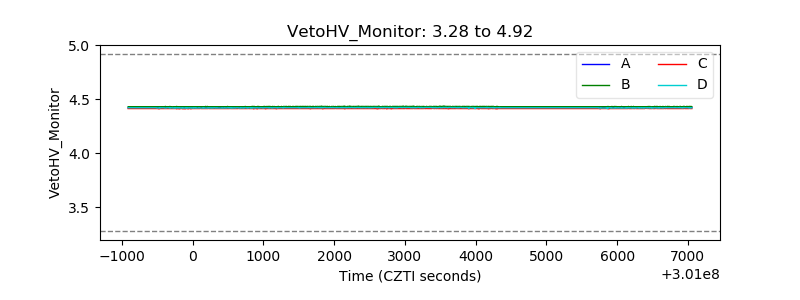 |
| Veto LLD |  |
| Alpha Counter | 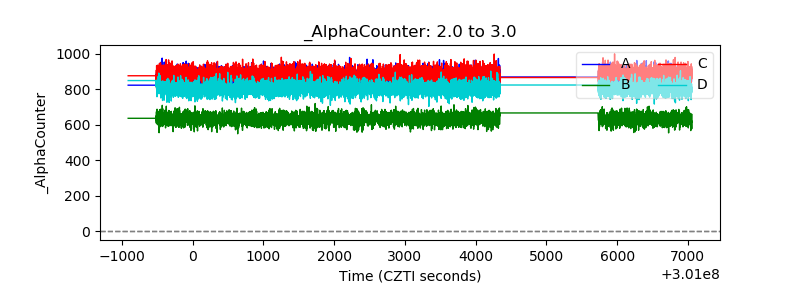 |
| _CPM_Rate | 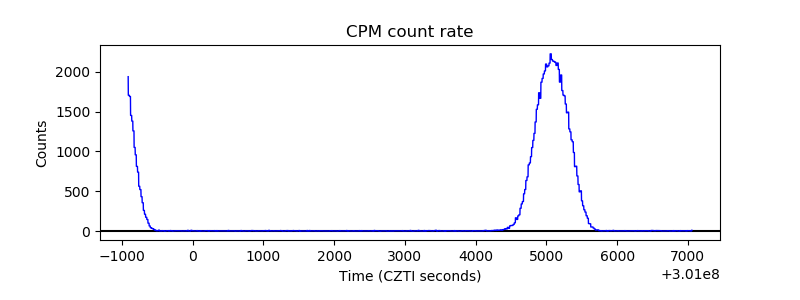 |
| CZT Counter | 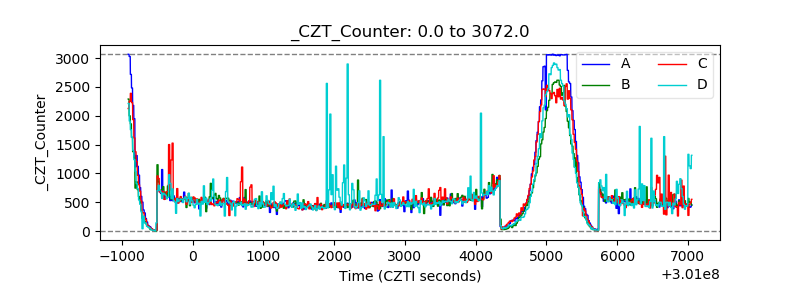 |
| +2.5 Volts monitor |  |
| +5 Volts monitor | 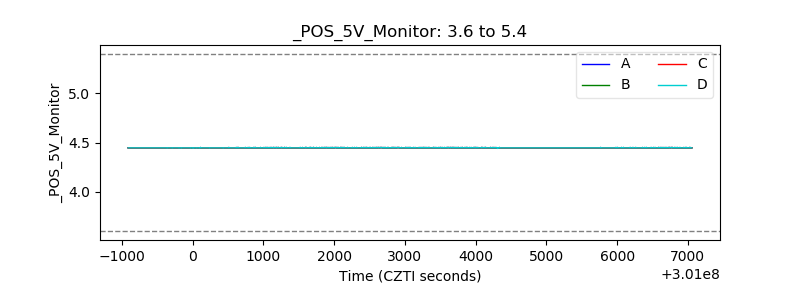 |
| _ROLL_ROT | 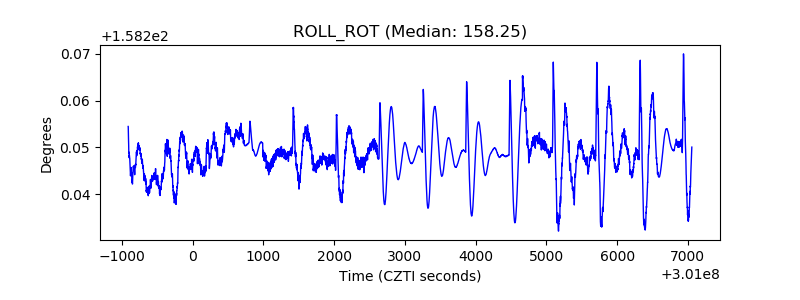 |
| _Roll_DEC | 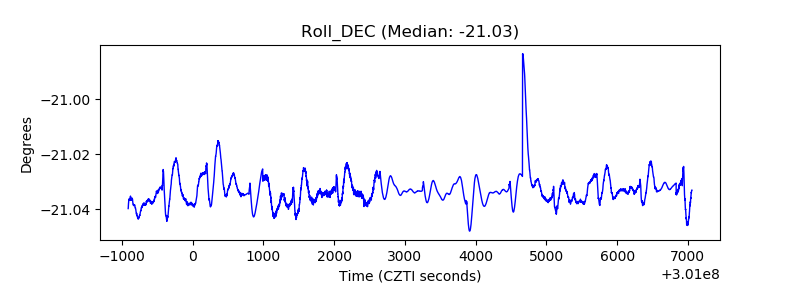 |
| _Roll_RA | 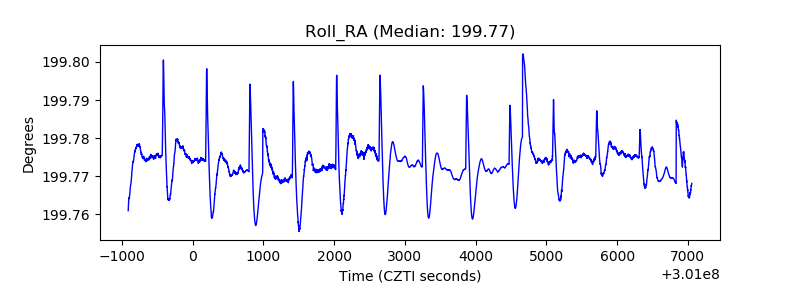 |
| Veto Counter | 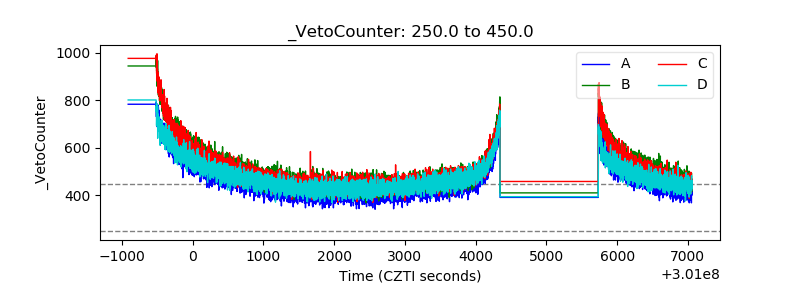 |