| Param | Original file | Final file |
|---|---|---|
| Filename | modeM0/AS1A05_022T08_9000003036_20541cztM0_level2.evt | modeM0/AS1A05_022T08_9000003036_20541cztM0_level2_quad_clean.evt |
| Size (bytes) | 455,584,320 | 83,629,440 |
| Size | 434.5 MB | 79.8 MB |
| Events in quadrant A | 3,085,838 | 542,027 |
| Events in quadrant B | 3,245,822 | 547,289 |
| Events in quadrant C | 3,310,707 | 509,530 |
| Events in quadrant D | 3,727,216 | 493,998 |
| Mode SS | |||
|---|---|---|---|
| Quadrant | BADHDUFLAG | Total packets | Discarded packets |
| A | 0 | 128 | 0 |
| B | 0 | 128 | 0 |
| C | 0 | 128 | 0 |
| D | 0 | 128 | 0 |
| Mode M0 | |||
|---|---|---|---|
| Quadrant | BADHDUFLAG | Total packets | Discarded packets |
| A | 0 | 13122 | 2 |
| B | 0 | 13441 | 2 |
| C | 0 | 13796 | 2 |
| D | 0 | 15321 | 2 |
| Mode M9 | |||
|---|---|---|---|
| Quadrant | BADHDUFLAG | Total packets | Discarded packets |
| A | 0 | 22 | 0 |
| B | 0 | 23 | 0 |
| C | 0 | 23 | 0 |
| D | 0 | 23 | 0 |
| Quadrant | Total seconds | Saturated seconds | Saturation percentage |
|---|---|---|---|
| A | 6298 | 15 | 0.238171% |
| B | 6298 | 25 | 0.396951% |
| C | 6298 | 44 | 0.698634% |
| D | 6298 | 87 | 1.381391% |
Noise dominated data is calculated using 1-second bins in cleaned event files. If a bin has >2000 counts, and if more than 50% of those come from <1% of pixels, then it is considered to be noise-dominated and hence unusable.
| Quadrant | # 1 sec bins | Bins with >0 counts | Bins with >2000 counts | High rate bins dominated by noise | Noise dominated (total time) | Noise dominated (detector-on time) | Marked lightcurve |
|---|---|---|---|---|---|---|---|
| A | 7548 | 6299 | 0 | 0 | 0.00% | 0.00% |  |
| B | 7548 | 6299 | 2 | 2 | 0.03% | 0.03% | 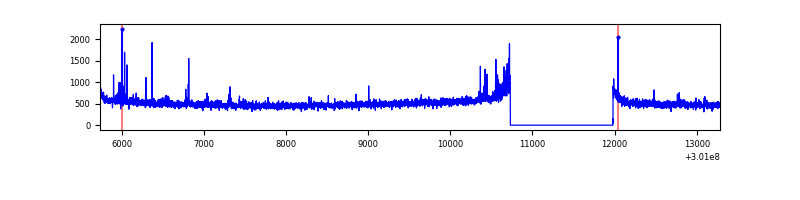 |
| C | 7548 | 6299 | 0 | 0 | 0.00% | 0.00% | 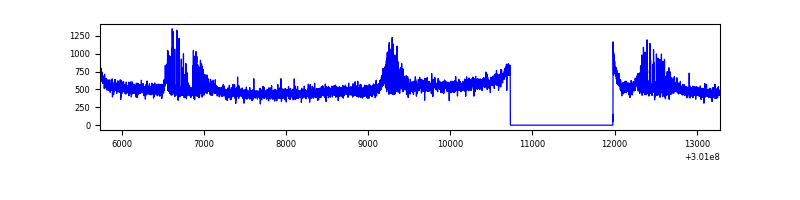 |
| D | 7548 | 6299 | 90 | 90 | 1.19% | 1.43% | 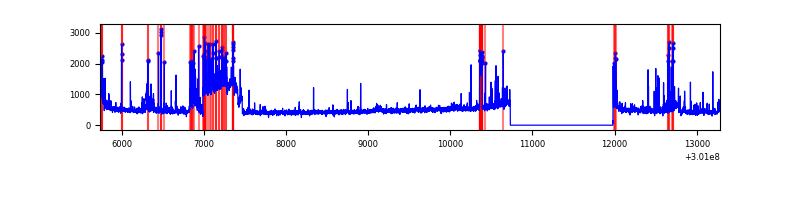 |
Top three noisy pixels from each quadrant. If the there are fewer than three noisy pixels in the level2.evt file, extra rows are filled as -1
| Pixel properties | Quadrant properties | ||||||
|---|---|---|---|---|---|---|---|
| Quadrant | DetID | PixID | Counts | Sigma | Mean | Median | Sigma |
| A | 0 | 226 | 6840 | 37.61 | 800 | 785 | 161.0 |
| A | 3 | 137 | 6396 | 34.85 | 800 | 785 | 161.0 |
| A | 12 | 194 | 5529 | 29.46 | 800 | 785 | 161.0 |
| B | 7 | 220 | 43691 | 284.44 | 799 | 782 | 150.9 |
| B | 0 | 189 | 18275 | 115.96 | 799 | 782 | 150.9 |
| B | 12 | 111 | 17800 | 112.81 | 799 | 782 | 150.9 |
| C | 8 | 208 | 182865 | 1029.42 | 757 | 763 | 176.9 |
| C | 14 | 238 | 119250 | 669.8 | 757 | 763 | 176.9 |
| C | 9 | 221 | 56790 | 316.72 | 757 | 763 | 176.9 |
| D | 7 | 238 | 491366 | 2656.18 | 759 | 740 | 184.7 |
| D | 1 | 52 | 81037 | 434.72 | 759 | 740 | 184.7 |
| D | 13 | 153 | 77354 | 414.78 | 759 | 740 | 184.7 |
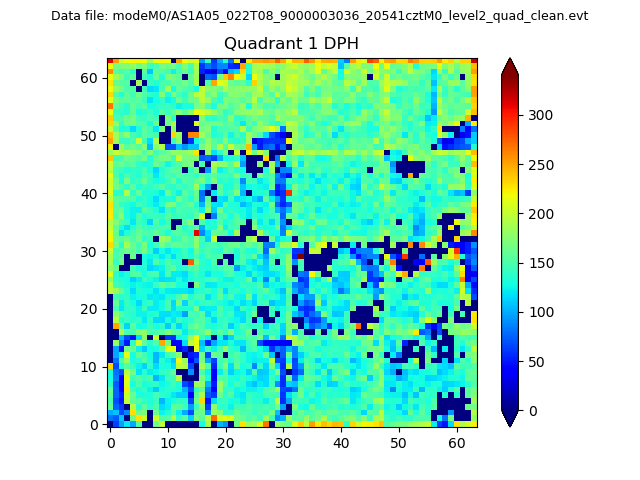
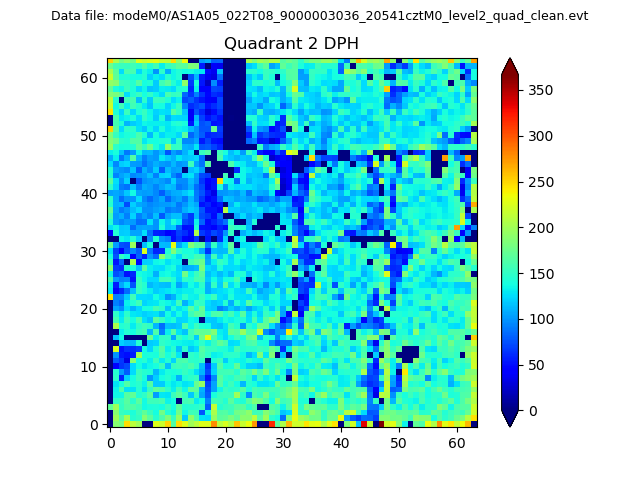
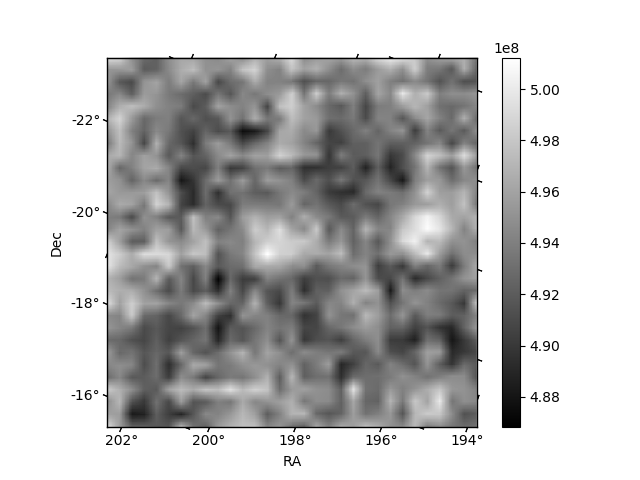
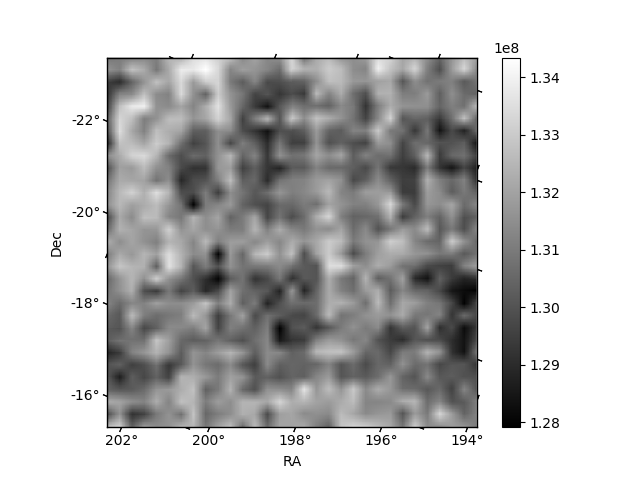
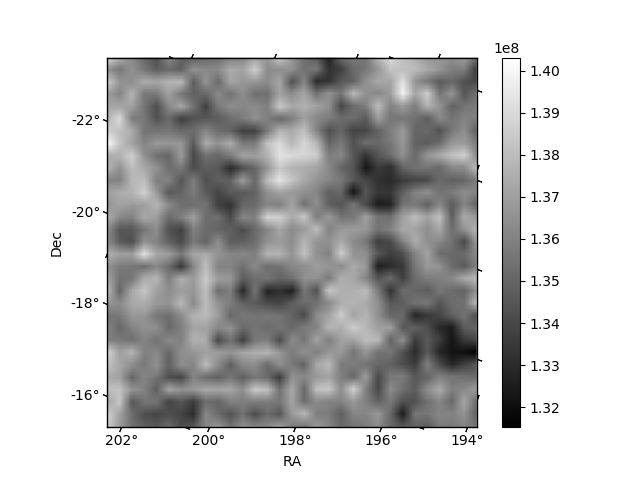
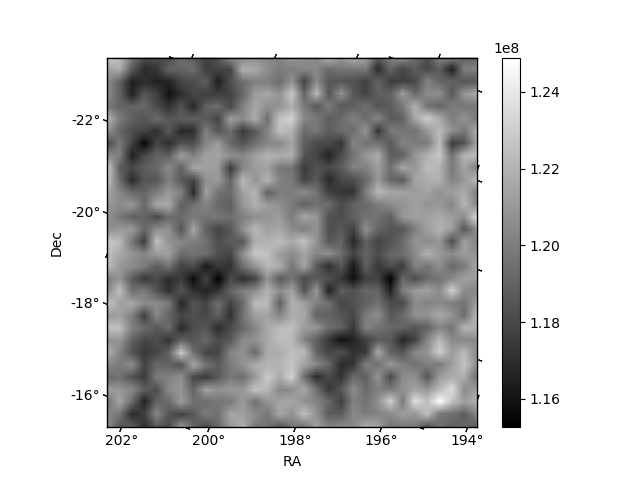
Histogram calculated using DETX and DETY for each event in the final _common_clean file
| Quadrant A | 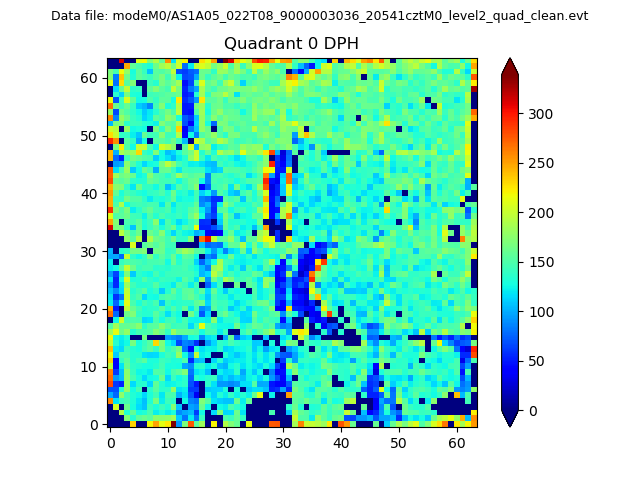 |
 |
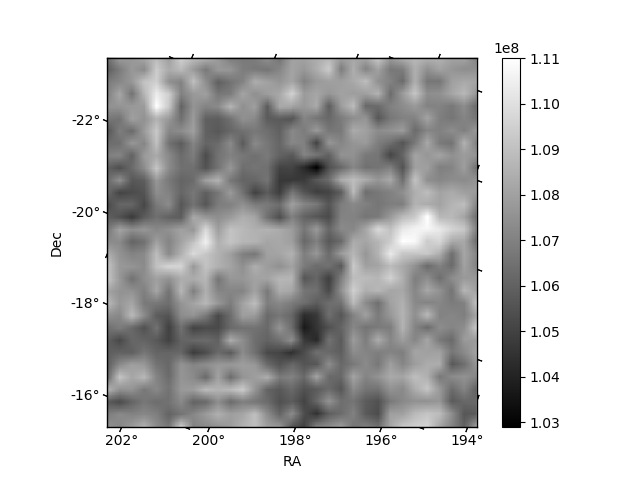
Quadrant B |
|---|---|---|---|
| Quadrant D | 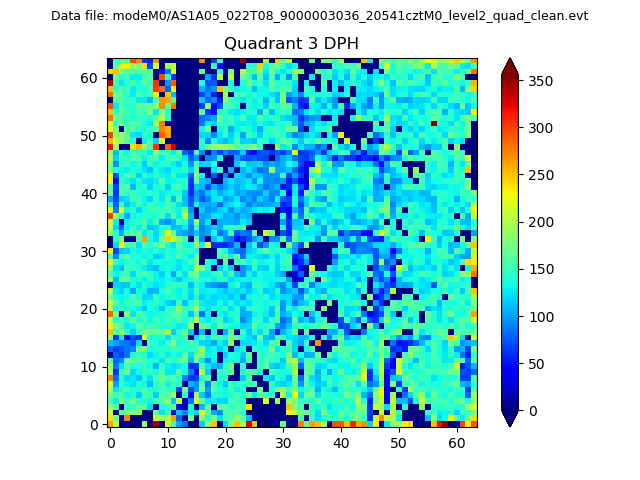 |
 |
Quadrant C |
| Plot type | Count rate plots | Images |
|---|---|---|
| Comparison with Poisson distribution Blue bars denote a histogram of data divided into 1 sec bins. Red curve is a Poisson curve with rate = median count rate of data. |
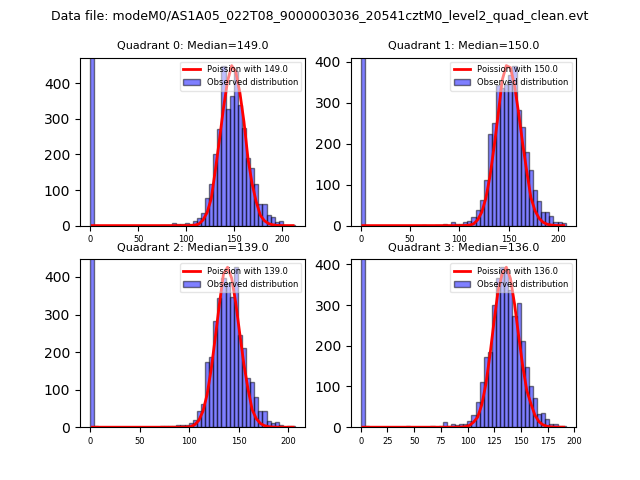 |
 |
| Quadrant-wise count rates Data is divided into 100 sec bins |
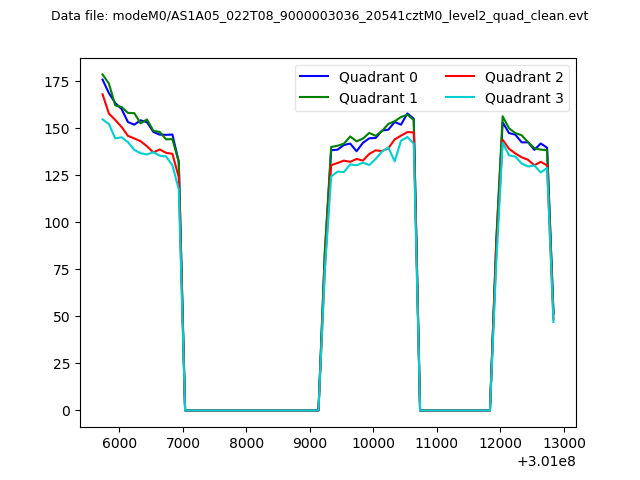 |
|
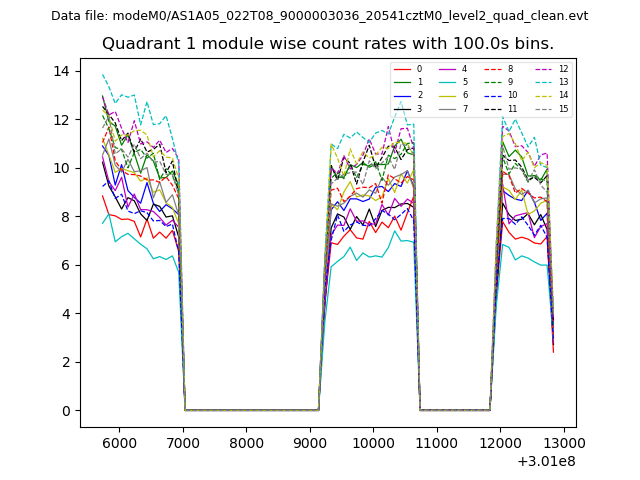
| Module-wise count rates for Quadrant A Data is divided into 100 sec bins |
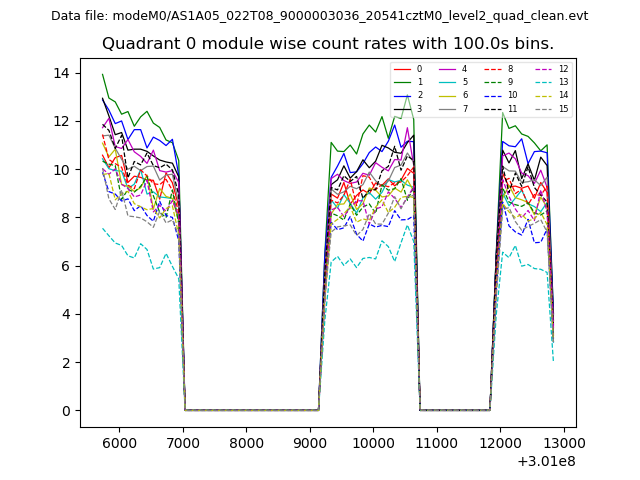 |
 |
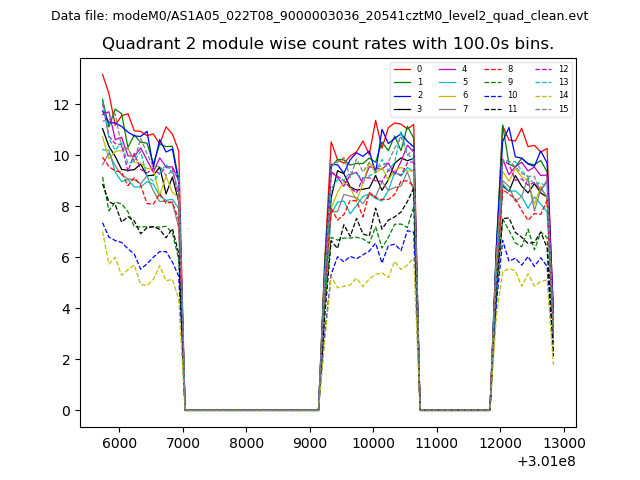
| Module-wise count rates for Quadrant B Data is divided into 100 sec bins |
 |
 |
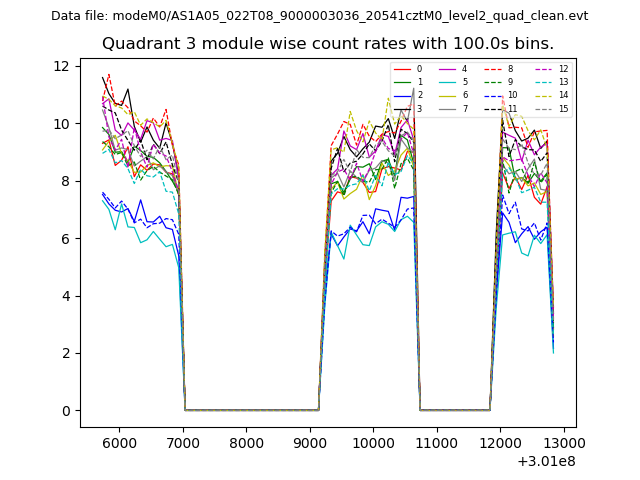
| Module-wise count rates for Quadrant C Data is divided into 100 sec bins |
 |
 |
| Module-wise count rates for Quadrant D Data is divided into 100 sec bins |
 |
 |
| Parameter | Plot |
|---|---|
| CZT HV Monitor | 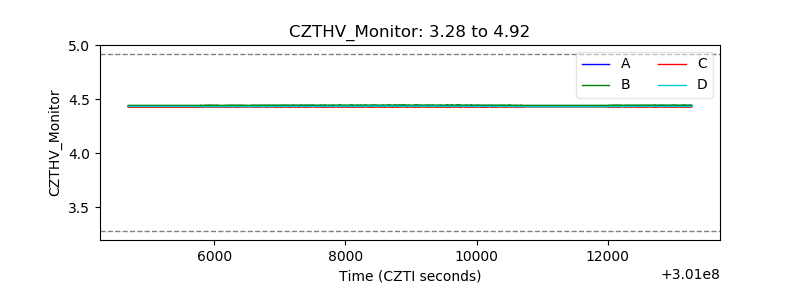 |
| D_VDD | 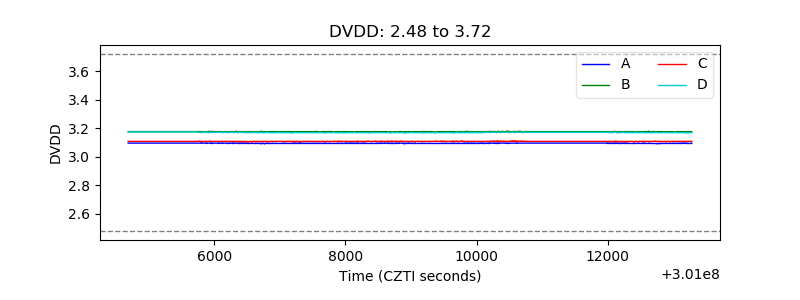 |
| Temperature 1 | 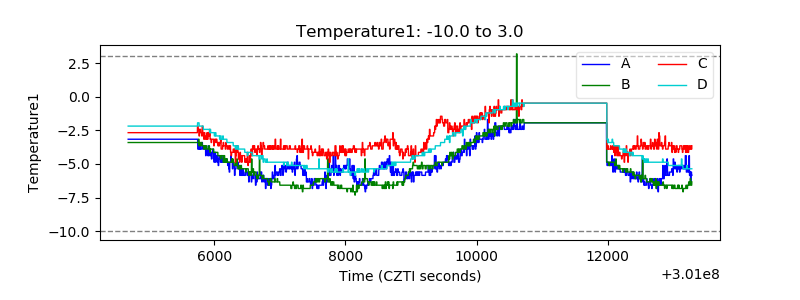 |
| Veto HV Monitor | 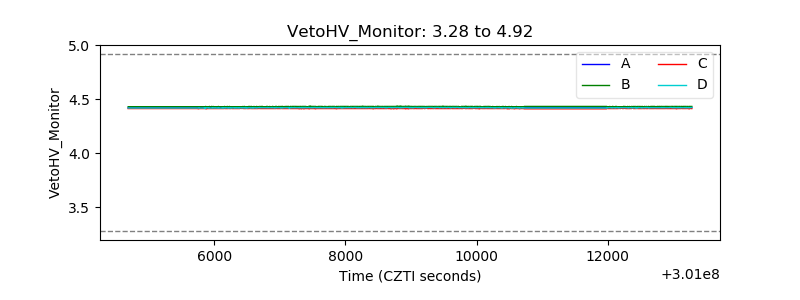 |
| Veto LLD | 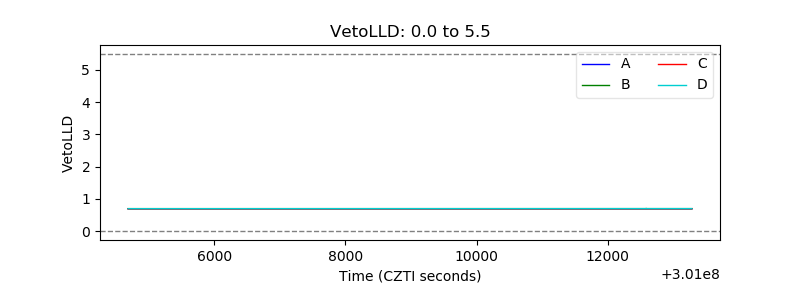 |
| Alpha Counter | 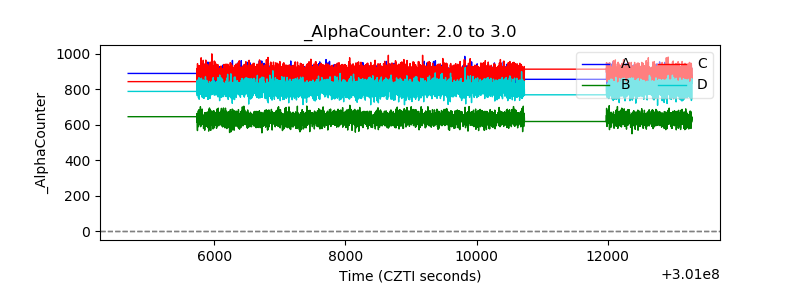 |
| _CPM_Rate | 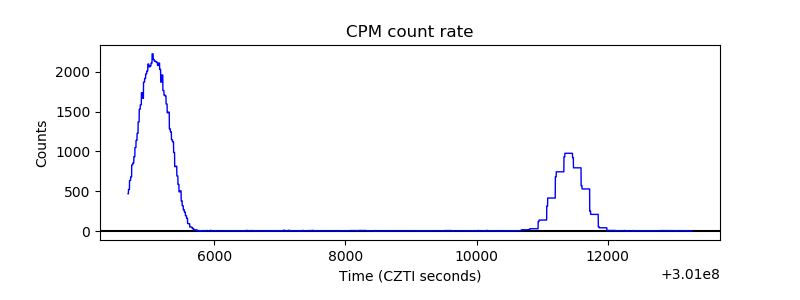 |
| CZT Counter | 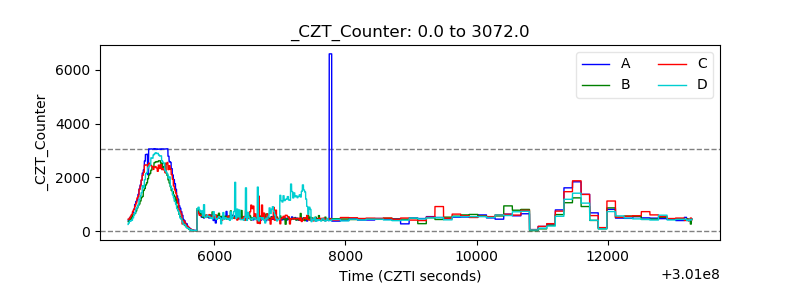 |
| +2.5 Volts monitor |  |
| +5 Volts monitor |  |
| _ROLL_ROT | 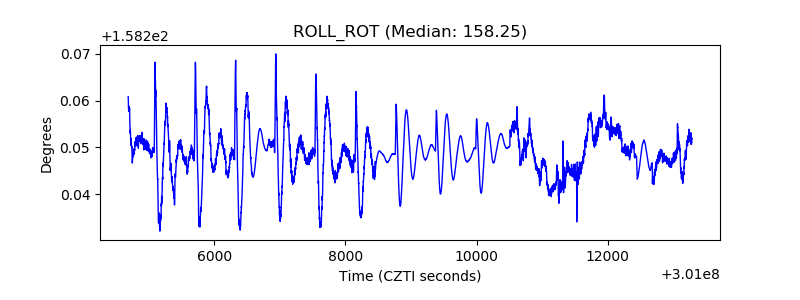 |
| _Roll_DEC | 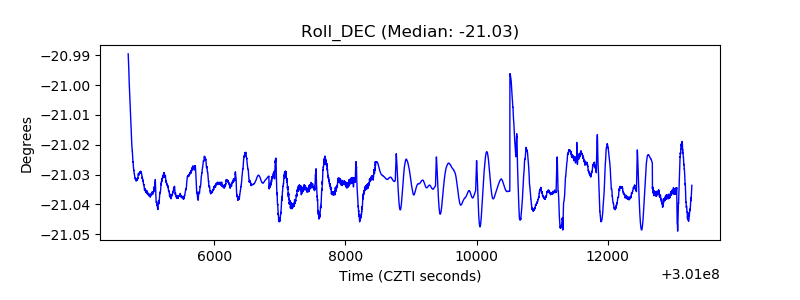 |
| _Roll_RA | 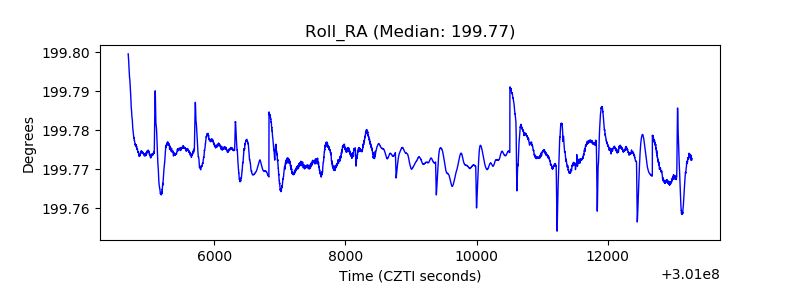 |
| Veto Counter | 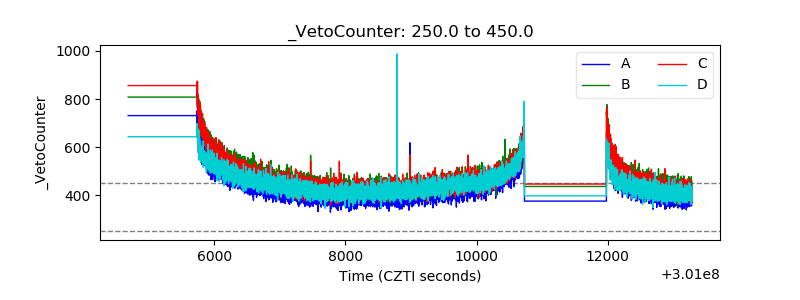 |