| Param | Original file | Final file |
|---|---|---|
| Filename | modeM0/AS1A05_022T08_9000003036_20542cztM0_level2.evt | modeM0/AS1A05_022T08_9000003036_20542cztM0_level2_quad_clean.evt |
| Size (bytes) | 490,034,880 | 85,484,160 |
| Size | 467.3 MB | 81.5 MB |
| Events in quadrant A | 3,430,976 | 542,224 |
| Events in quadrant B | 3,629,121 | 546,637 |
| Events in quadrant C | 3,521,484 | 514,795 |
| Events in quadrant D | 3,786,303 | 499,842 |
| Mode SS | |||
|---|---|---|---|
| Quadrant | BADHDUFLAG | Total packets | Discarded packets |
| A | 0 | 146 | 0 |
| B | 0 | 146 | 0 |
| C | 0 | 146 | 0 |
| D | 0 | 146 | 0 |
| Mode M0 | |||
|---|---|---|---|
| Quadrant | BADHDUFLAG | Total packets | Discarded packets |
| A | 0 | 14584 | 2 |
| B | 0 | 15184 | 2 |
| C | 0 | 14840 | 3 |
| D | 0 | 16119 | 2 |
| Mode M9 | |||
|---|---|---|---|
| Quadrant | BADHDUFLAG | Total packets | Discarded packets |
| A | 0 | 20 | 0 |
| B | 0 | 20 | 0 |
| C | 0 | 20 | 0 |
| D | 0 | 20 | 0 |
| Quadrant | Total seconds | Saturated seconds | Saturation percentage |
|---|---|---|---|
| A | 6956 | 36 | 0.517539% |
| B | 6957 | 69 | 0.991807% |
| C | 6956 | 54 | 0.776308% |
| D | 6956 | 103 | 1.480736% |
Noise dominated data is calculated using 1-second bins in cleaned event files. If a bin has >2000 counts, and if more than 50% of those come from <1% of pixels, then it is considered to be noise-dominated and hence unusable.
| Quadrant | # 1 sec bins | Bins with >0 counts | Bins with >2000 counts | High rate bins dominated by noise | Noise dominated (total time) | Noise dominated (detector-on time) | Marked lightcurve |
|---|---|---|---|---|---|---|---|
| A | 9096 | 6958 | 0 | 0 | 0.00% | 0.00% | 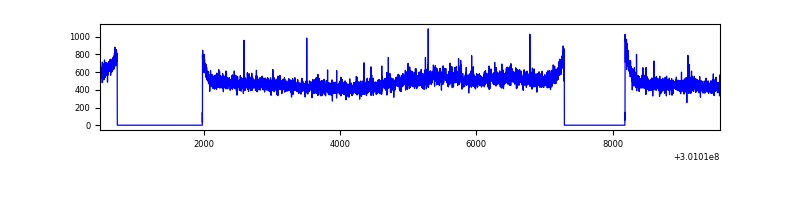 |
| B | 9097 | 6959 | 11 | 11 | 0.12% | 0.16% | 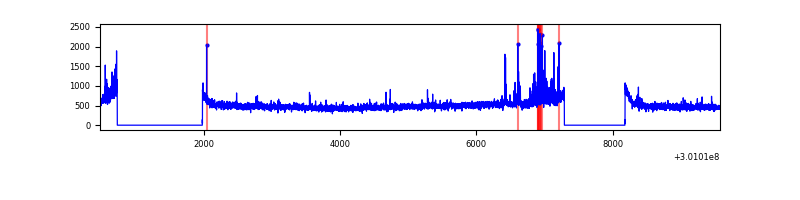 |
| C | 9096 | 6958 | 0 | 0 | 0.00% | 0.00% | 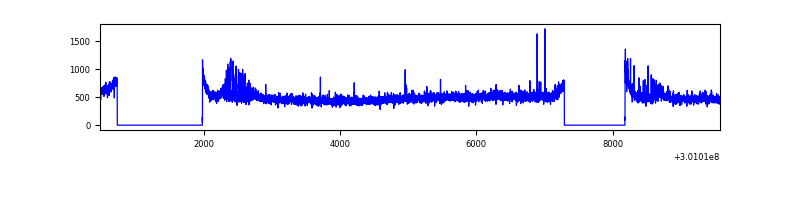 |
| D | 9096 | 6958 | 78 | 78 | 0.86% | 1.12% | 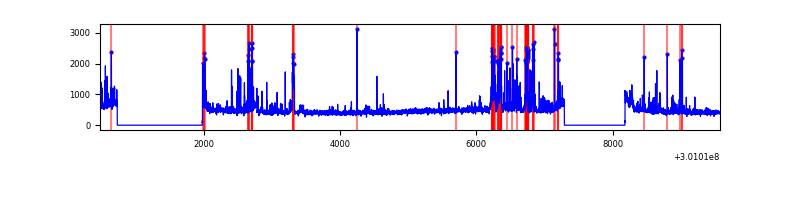 |
Top three noisy pixels from each quadrant. If the there are fewer than three noisy pixels in the level2.evt file, extra rows are filled as -1
| Pixel properties | Quadrant properties | ||||||
|---|---|---|---|---|---|---|---|
| Quadrant | DetID | PixID | Counts | Sigma | Mean | Median | Sigma |
| A | 14 | 111 | 58799 | 325.5 | 871 | 854 | 178.0 |
| A | 8 | 205 | 8851 | 44.92 | 871 | 854 | 178.0 |
| A | 15 | 174 | 7585 | 37.81 | 871 | 854 | 178.0 |
| B | 7 | 220 | 108107 | 642.67 | 867 | 845 | 166.9 |
| B | 0 | 197 | 55770 | 329.09 | 867 | 845 | 166.9 |
| B | 0 | 189 | 24092 | 139.29 | 867 | 845 | 166.9 |
| C | 14 | 238 | 131139 | 672.09 | 825 | 831 | 193.9 |
| C | 8 | 208 | 107889 | 552.17 | 825 | 831 | 193.9 |
| C | 9 | 221 | 48896 | 247.91 | 825 | 831 | 193.9 |
| D | 12 | 238 | 177872 | 866.52 | 831 | 806 | 204.3 |
| D | 13 | 153 | 144940 | 705.36 | 831 | 806 | 204.3 |
| D | 1 | 52 | 124593 | 605.78 | 831 | 806 | 204.3 |
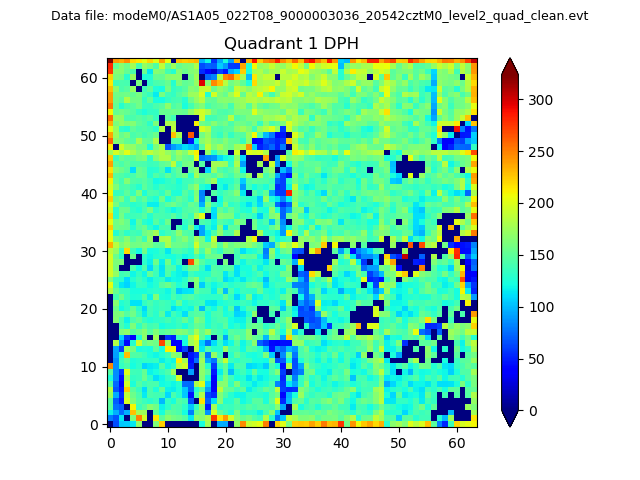
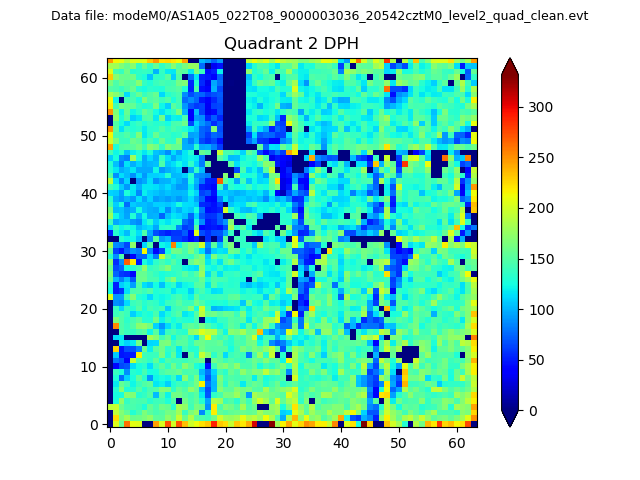
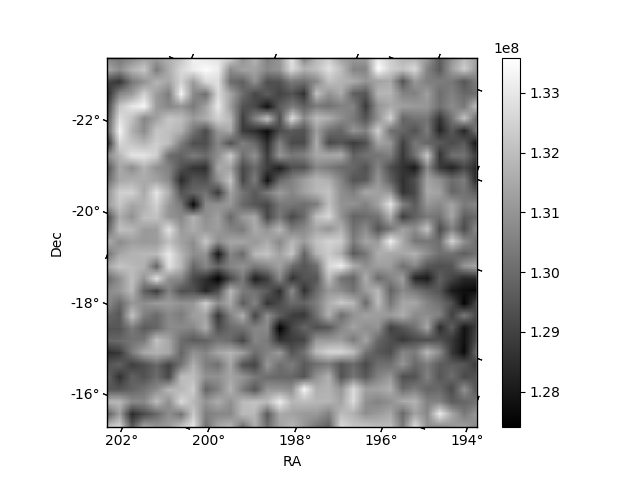
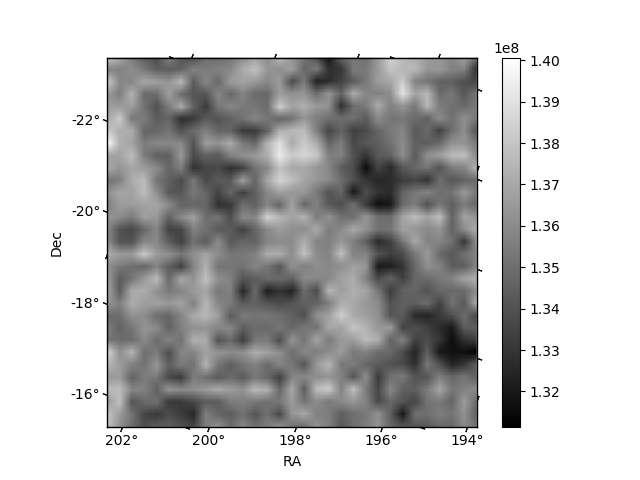
Histogram calculated using DETX and DETY for each event in the final _common_clean file
| Quadrant A |  |
 |
Quadrant B |
|---|---|---|---|
| Quadrant D |  |
 |
Quadrant C |
| Plot type | Count rate plots | Images |
|---|---|---|
| Comparison with Poisson distribution Blue bars denote a histogram of data divided into 1 sec bins. Red curve is a Poisson curve with rate = median count rate of data. |
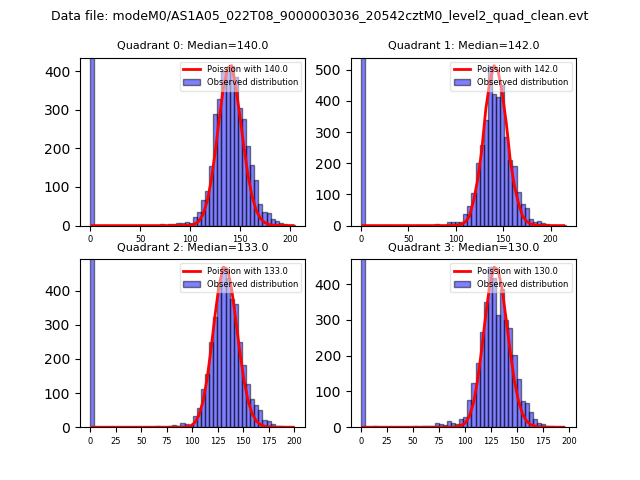 |
 |
| Quadrant-wise count rates Data is divided into 100 sec bins |
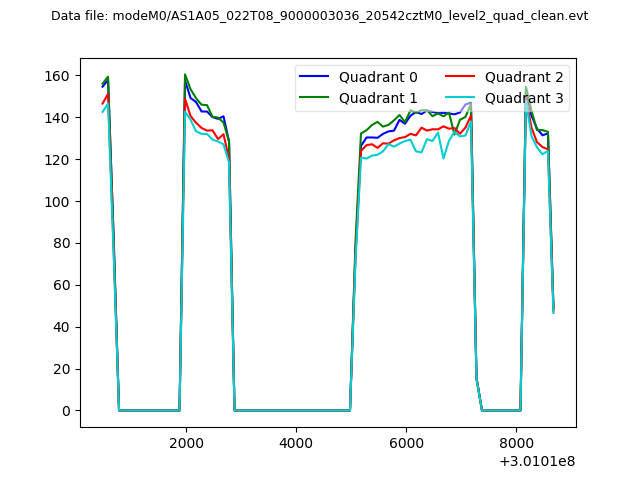 |
|
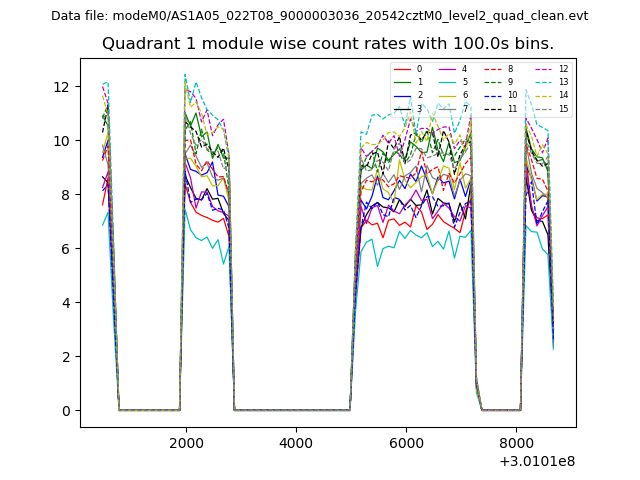
| Module-wise count rates for Quadrant A Data is divided into 100 sec bins |
 |
 |
| Module-wise count rates for Quadrant B Data is divided into 100 sec bins |
 |
 |
| Module-wise count rates for Quadrant C Data is divided into 100 sec bins |
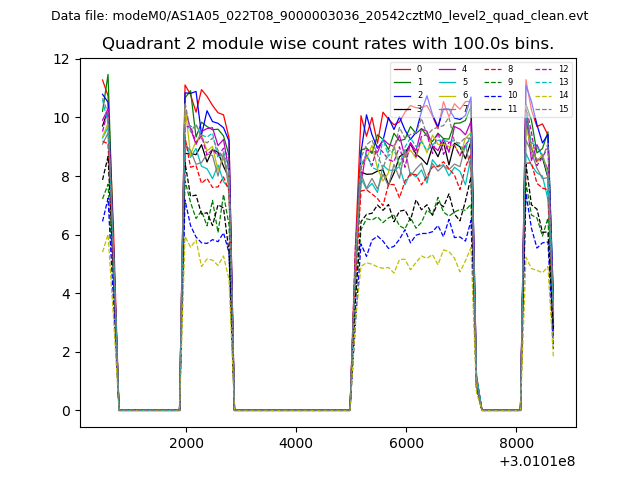 |
 |
| Module-wise count rates for Quadrant D Data is divided into 100 sec bins |
 |
 |
| Parameter | Plot |
|---|---|
| CZT HV Monitor |  |
| D_VDD | 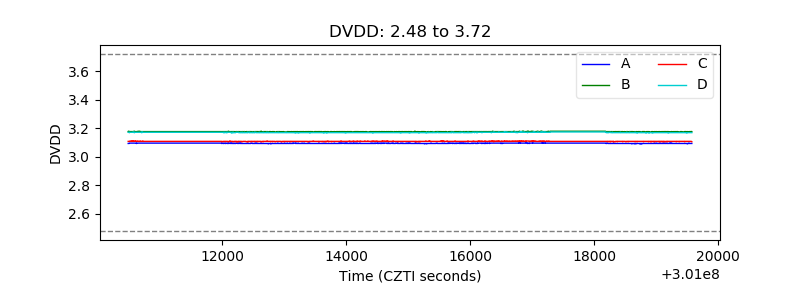 |
| Temperature 1 | 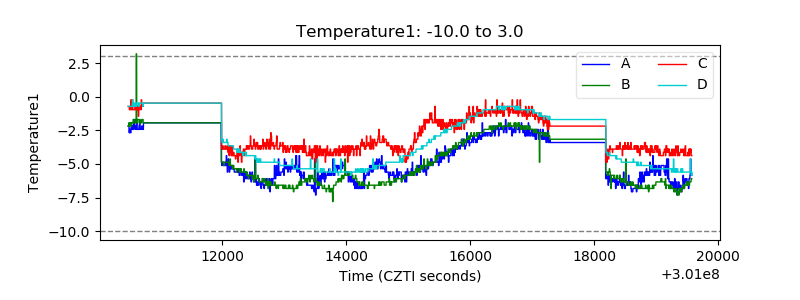 |
| Veto HV Monitor | 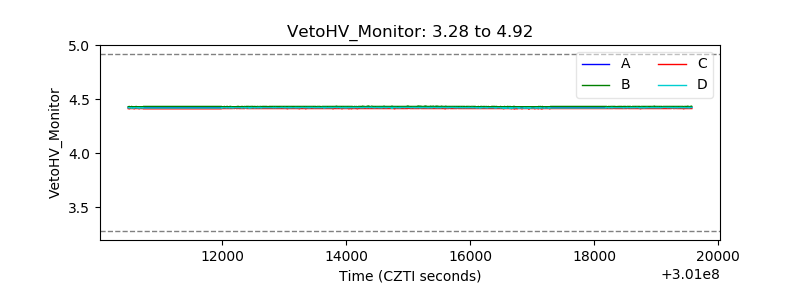 |
| Veto LLD | 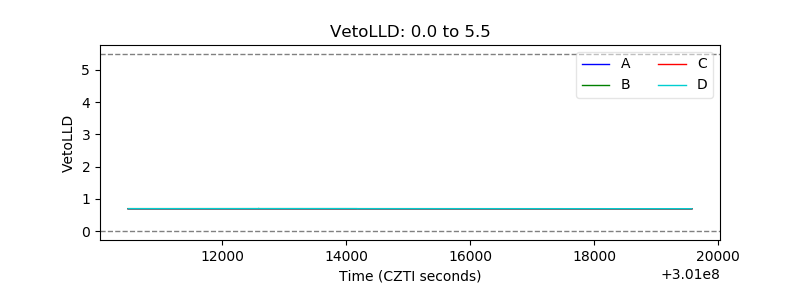 |
| Alpha Counter | 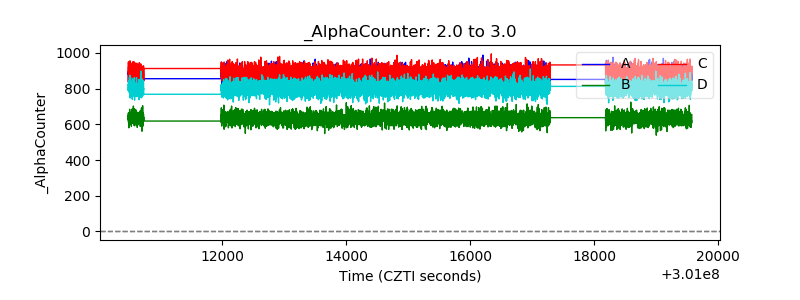 |
| _CPM_Rate | 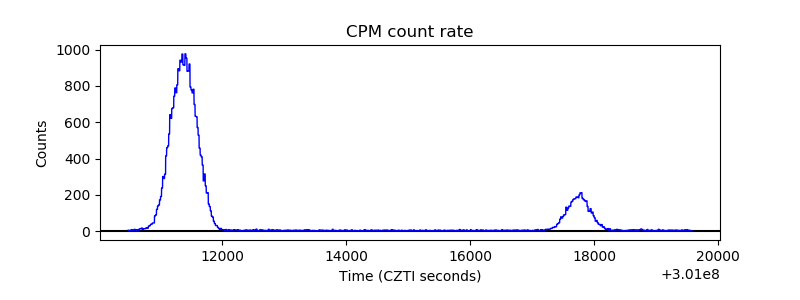 |
| CZT Counter |  |
| +2.5 Volts monitor |  |
| +5 Volts monitor |  |
| _ROLL_ROT | 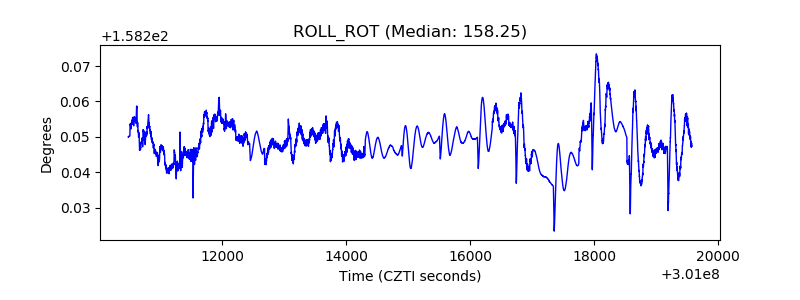 |
| _Roll_DEC | 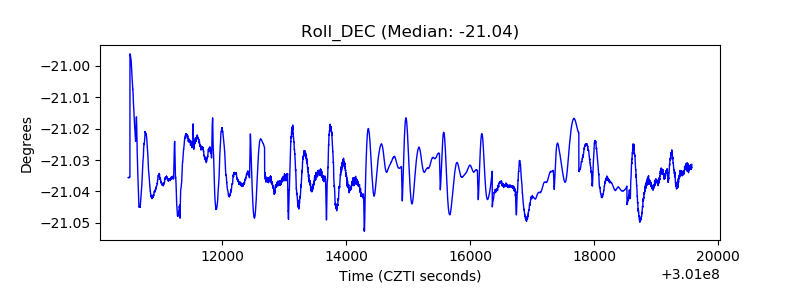 |
| _Roll_RA | 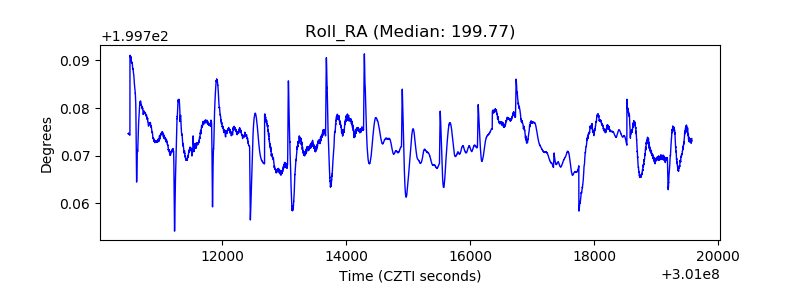 |
| Veto Counter | 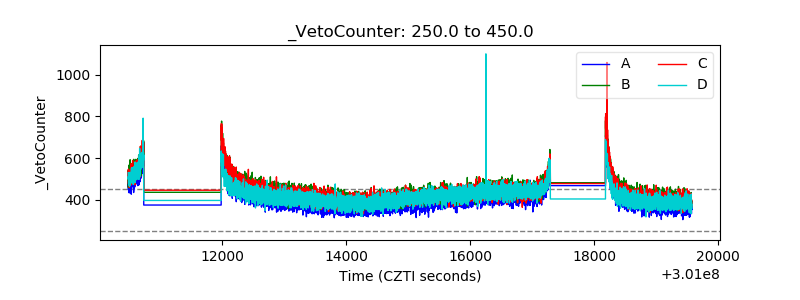 |