| Param | Original file | Final file |
|---|---|---|
| Filename | modeM0/AS1A05_022T08_9000003036_20543cztM0_level2.evt | modeM0/AS1A05_022T08_9000003036_20543cztM0_level2_quad_clean.evt |
| Size (bytes) | 503,945,280 | 80,694,720 |
| Size | 480.6 MB | 77.0 MB |
| Events in quadrant A | 3,481,385 | 499,534 |
| Events in quadrant B | 3,641,501 | 500,691 |
| Events in quadrant C | 3,641,513 | 474,543 |
| Events in quadrant D | 4,005,502 | 464,231 |
| Mode SS | |||
|---|---|---|---|
| Quadrant | BADHDUFLAG | Total packets | Discarded packets |
| A | 0 | 148 | 0 |
| B | 0 | 148 | 0 |
| C | 0 | 148 | 0 |
| D | 0 | 148 | 0 |
| Mode M0 | |||
|---|---|---|---|
| Quadrant | BADHDUFLAG | Total packets | Discarded packets |
| A | 0 | 15021 | 2 |
| B | 0 | 15314 | 2 |
| C | 0 | 15482 | 2 |
| D | 0 | 16940 | 2 |
| Mode M9 | |||
|---|---|---|---|
| Quadrant | BADHDUFLAG | Total packets | Discarded packets |
| A | 0 | 7 | 0 |
| B | 0 | 8 | 0 |
| C | 0 | 8 | 0 |
| D | 0 | 8 | 0 |
| Quadrant | Total seconds | Saturated seconds | Saturation percentage |
|---|---|---|---|
| A | 7241 | 98 | 1.353404% |
| B | 7240 | 125 | 1.726519% |
| C | 7240 | 138 | 1.906077% |
| D | 7240 | 172 | 2.375691% |
Noise dominated data is calculated using 1-second bins in cleaned event files. If a bin has >2000 counts, and if more than 50% of those come from <1% of pixels, then it is considered to be noise-dominated and hence unusable.
| Quadrant | # 1 sec bins | Bins with >0 counts | Bins with >2000 counts | High rate bins dominated by noise | Noise dominated (total time) | Noise dominated (detector-on time) | Marked lightcurve |
|---|---|---|---|---|---|---|---|
| A | 7686 | 7242 | 0 | 0 | 0.00% | 0.00% | 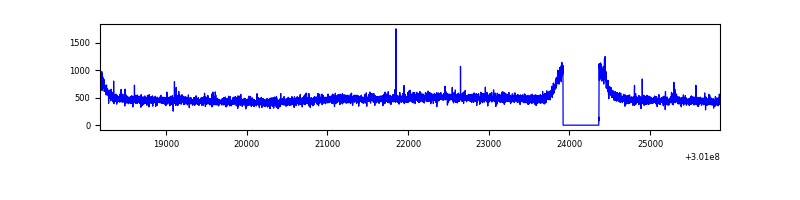 |
| B | 7685 | 7241 | 1 | 1 | 0.01% | 0.01% | 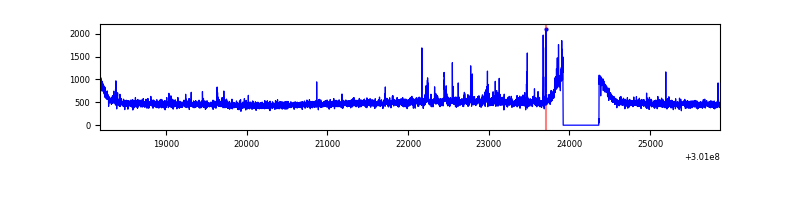 |
| C | 7685 | 7241 | 0 | 0 | 0.00% | 0.00% | 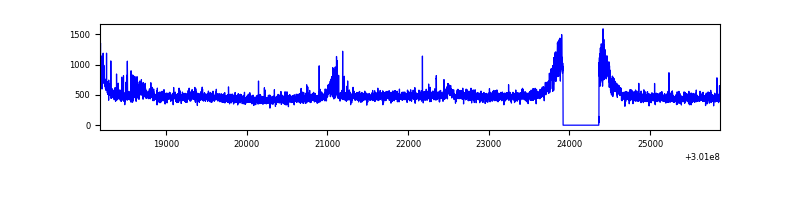 |
| D | 7685 | 7241 | 116 | 116 | 1.51% | 1.60% | 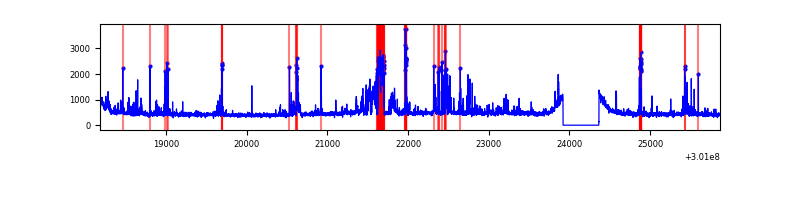 |
Top three noisy pixels from each quadrant. If the there are fewer than three noisy pixels in the level2.evt file, extra rows are filled as -1
| Pixel properties | Quadrant properties | ||||||
|---|---|---|---|---|---|---|---|
| Quadrant | DetID | PixID | Counts | Sigma | Mean | Median | Sigma |
| A | 15 | 222 | 13363 | 67.57 | 897 | 877 | 184.8 |
| A | 15 | 174 | 12159 | 61.05 | 897 | 877 | 184.8 |
| A | 0 | 226 | 7803 | 37.48 | 897 | 877 | 184.8 |
| B | 0 | 197 | 44385 | 250.37 | 891 | 869 | 173.8 |
| B | 0 | 219 | 38155 | 214.53 | 891 | 869 | 173.8 |
| B | 12 | 111 | 20991 | 115.77 | 891 | 869 | 173.8 |
| C | 8 | 208 | 176165 | 866.06 | 850 | 856 | 202.4 |
| C | 14 | 238 | 131019 | 643.03 | 850 | 856 | 202.4 |
| C | 9 | 221 | 21889 | 103.91 | 850 | 856 | 202.4 |
| D | 13 | 153 | 601972 | 2830.7 | 858 | 832 | 212.4 |
| D | 1 | 52 | 94893 | 442.92 | 858 | 832 | 212.4 |
| D | 2 | 234 | 28203 | 128.89 | 858 | 832 | 212.4 |
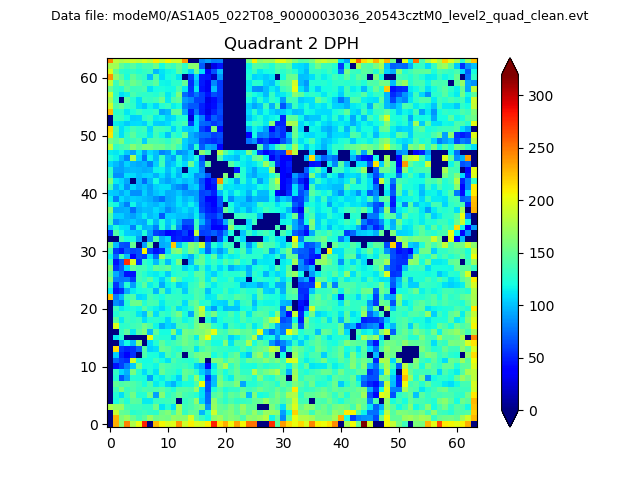
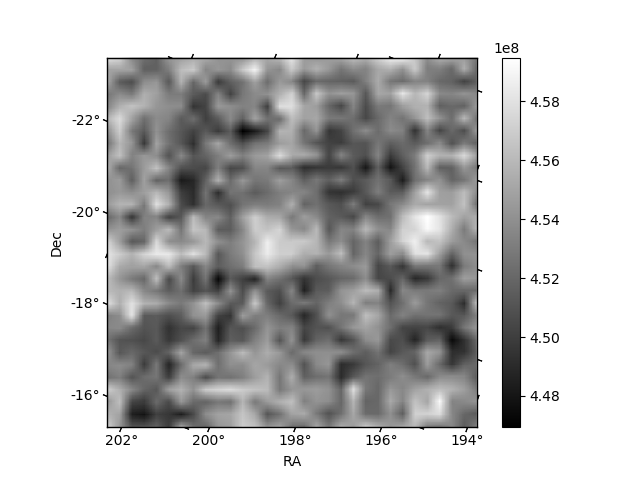
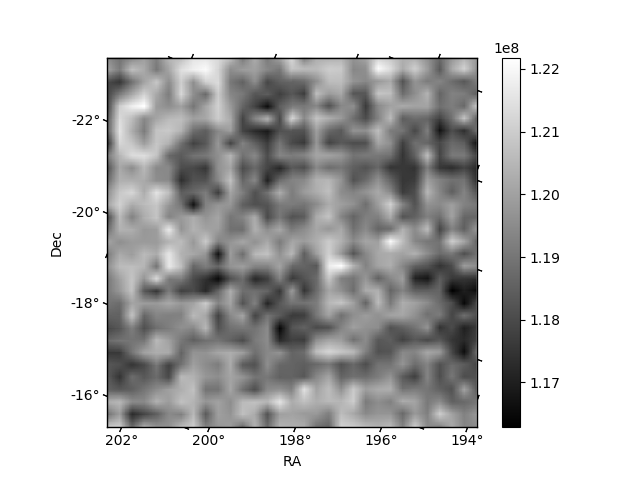
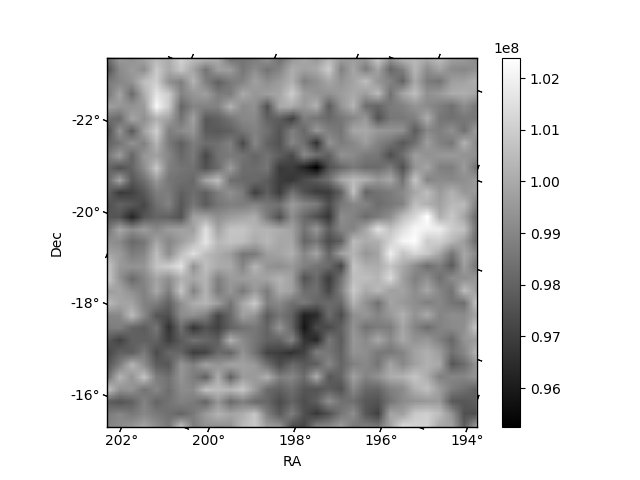
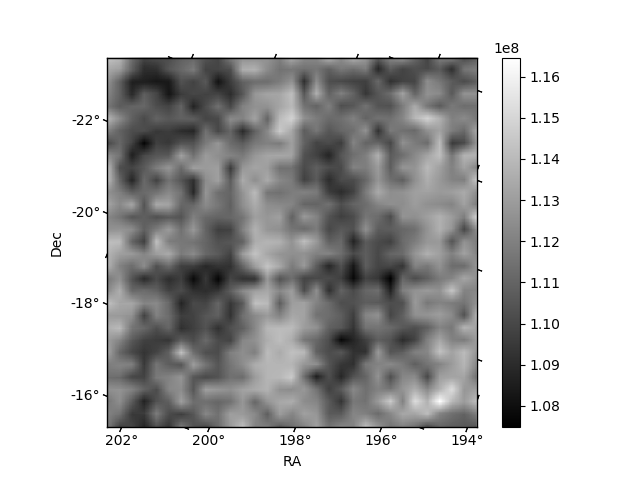
Histogram calculated using DETX and DETY for each event in the final _common_clean file
| Quadrant A | 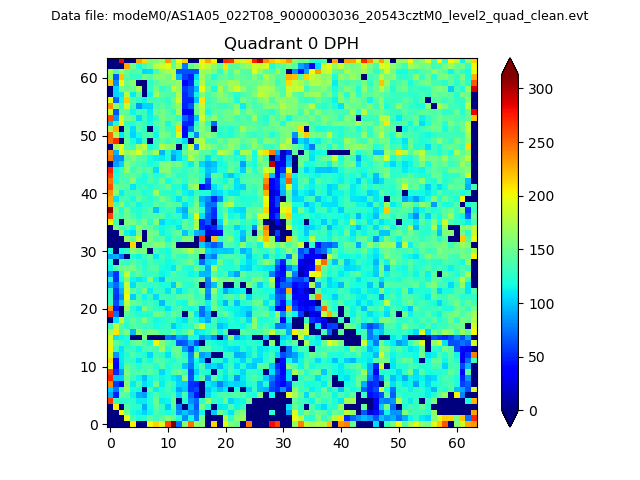 |
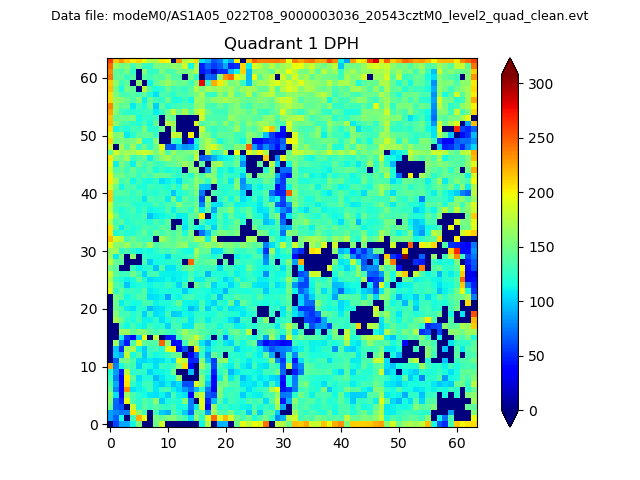 |
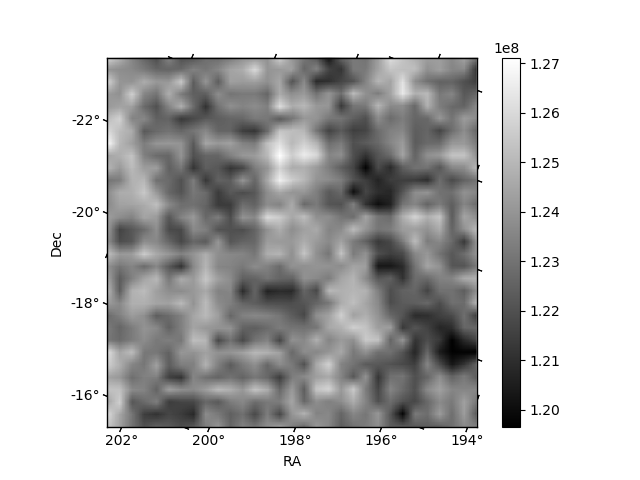
Quadrant B |
|---|---|---|---|
| Quadrant D | 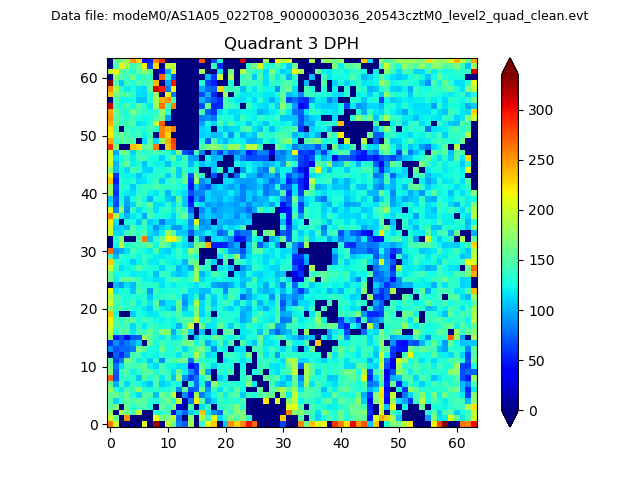 |
 |
Quadrant C |
| Plot type | Count rate plots | Images |
|---|---|---|
| Comparison with Poisson distribution Blue bars denote a histogram of data divided into 1 sec bins. Red curve is a Poisson curve with rate = median count rate of data. |
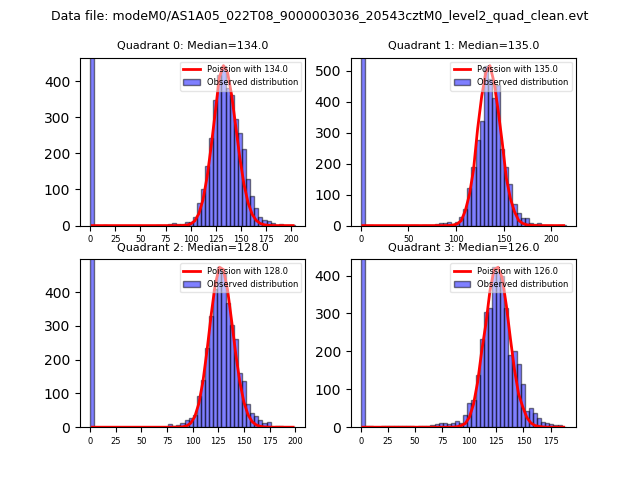 |
 |
| Quadrant-wise count rates Data is divided into 100 sec bins |
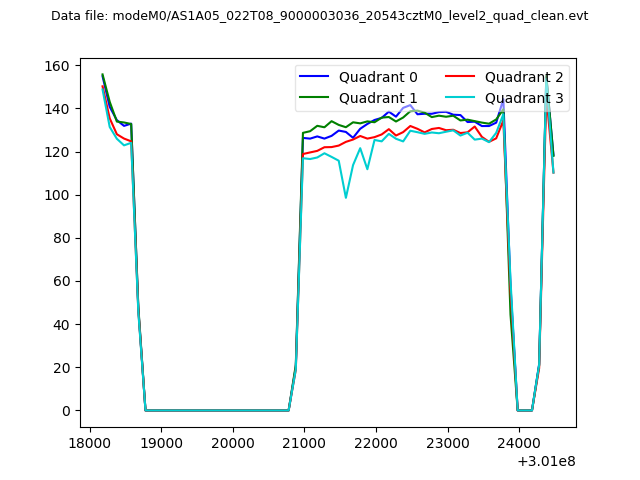 |
|
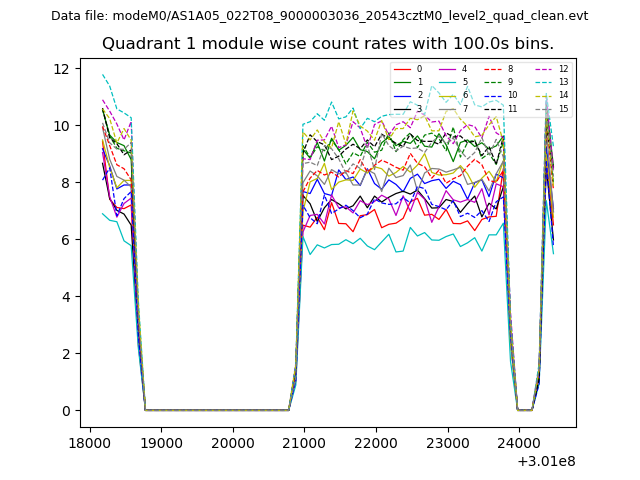
| Module-wise count rates for Quadrant A Data is divided into 100 sec bins |
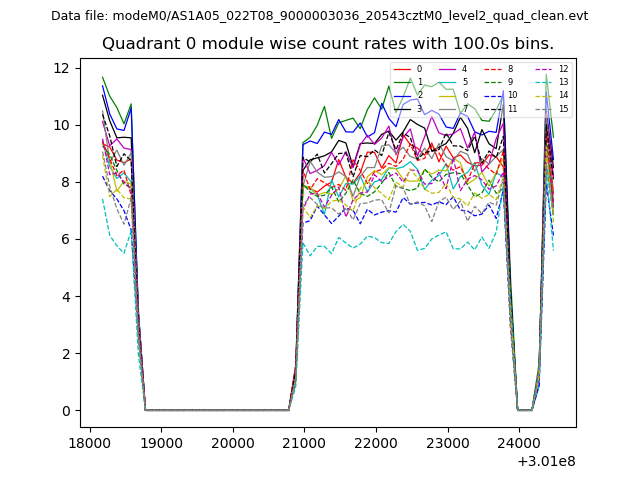 |
 |
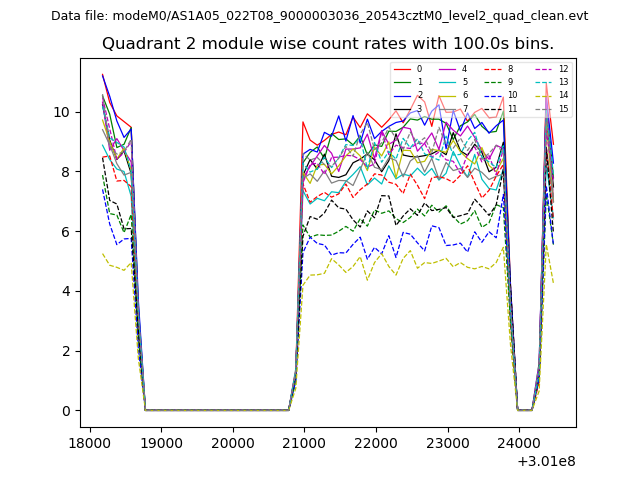
| Module-wise count rates for Quadrant B Data is divided into 100 sec bins |
 |
 |
| Module-wise count rates for Quadrant C Data is divided into 100 sec bins |
 |
 |
| Module-wise count rates for Quadrant D Data is divided into 100 sec bins |
 |
 |
| Parameter | Plot |
|---|---|
| CZT HV Monitor | 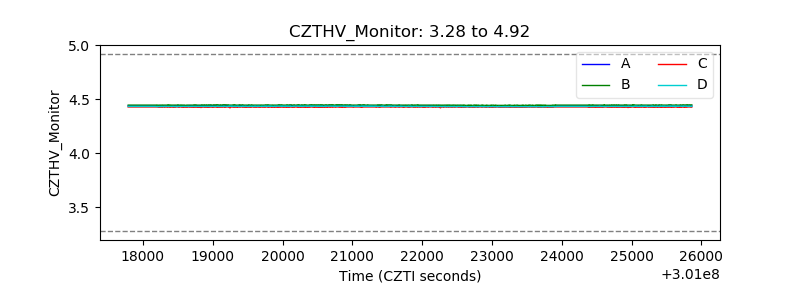 |
| D_VDD |  |
| Temperature 1 | 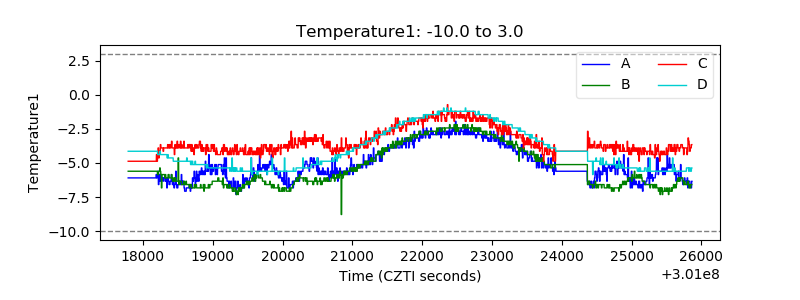 |
| Veto HV Monitor | 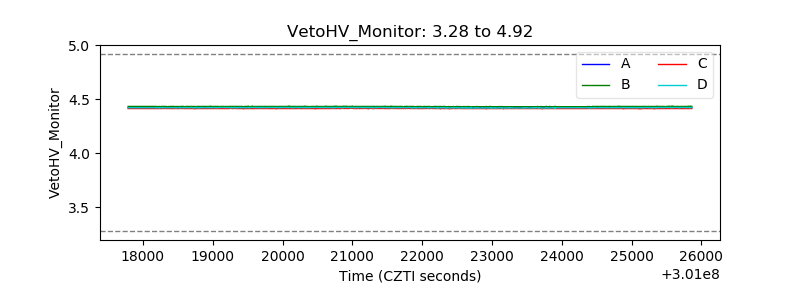 |
| Veto LLD | 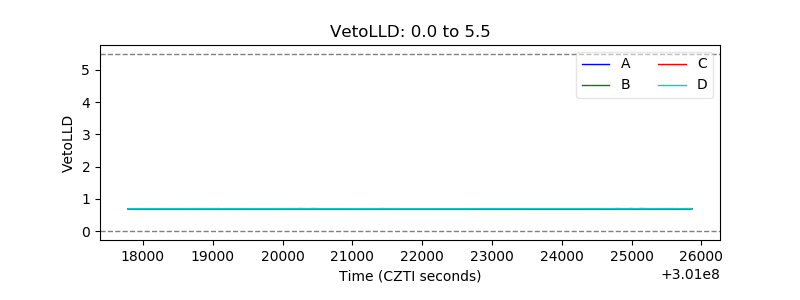 |
| Alpha Counter | 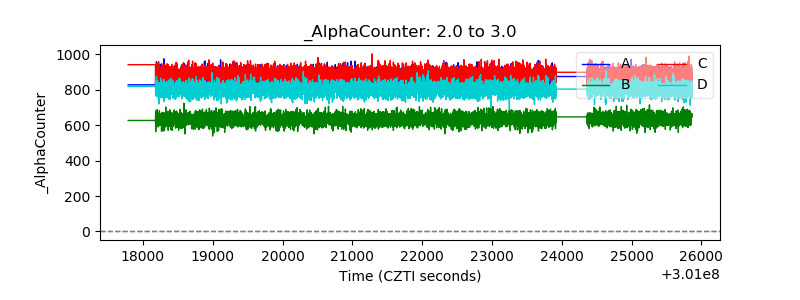 |
| _CPM_Rate | 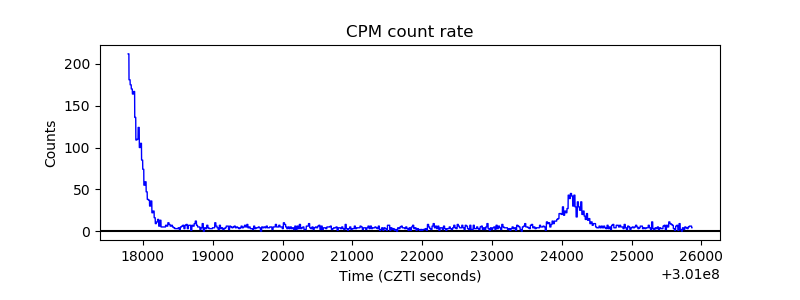 |
| CZT Counter | 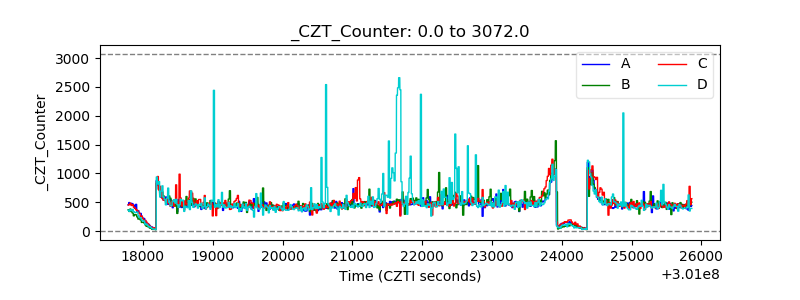 |
| +2.5 Volts monitor |  |
| +5 Volts monitor | 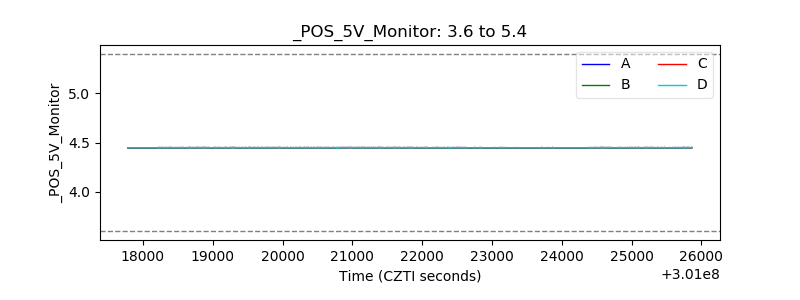 |
| _ROLL_ROT |  |
| _Roll_DEC | 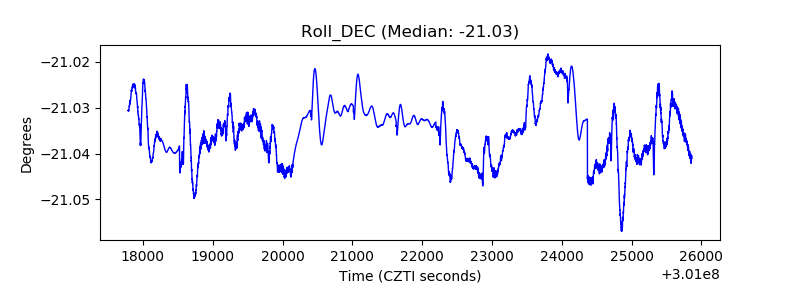 |
| _Roll_RA | 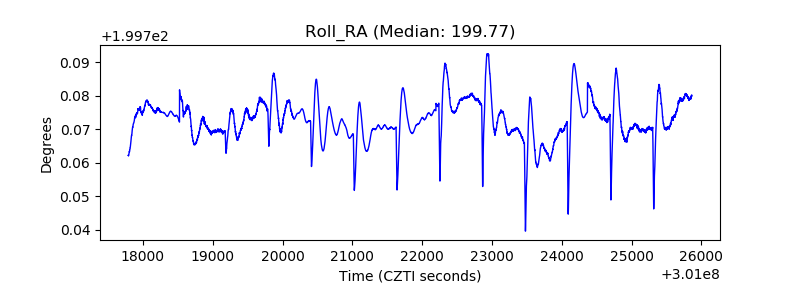 |
| Veto Counter |  |