| Param | Original file | Final file |
|---|---|---|
| Filename | modeM0/AS1A05_022T08_9000003036_20544cztM0_level2.evt | modeM0/AS1A05_022T08_9000003036_20544cztM0_level2_quad_clean.evt |
| Size (bytes) | 333,498,240 | 62,081,280 |
| Size | 318.0 MB | 59.2 MB |
| Events in quadrant A | 2,294,199 | 395,525 |
| Events in quadrant B | 2,553,315 | 390,126 |
| Events in quadrant C | 2,330,414 | 375,435 |
| Events in quadrant D | 2,580,970 | 367,537 |
| Mode SS | |||
|---|---|---|---|
| Quadrant | BADHDUFLAG | Total packets | Discarded packets |
| A | 0 | 100 | 0 |
| B | 0 | 100 | 0 |
| C | 0 | 100 | 0 |
| D | 0 | 100 | 0 |
| Mode M0 | |||
|---|---|---|---|
| Quadrant | BADHDUFLAG | Total packets | Discarded packets |
| A | 0 | 10060 | 0 |
| B | 0 | 10774 | 0 |
| C | 0 | 10153 | 0 |
| D | 0 | 11152 | 0 |
| Quadrant | Total seconds | Saturated seconds | Saturation percentage |
|---|---|---|---|
| A | 5005 | 5 | 0.099900% |
| B | 5006 | 62 | 1.238514% |
| C | 5006 | 17 | 0.339592% |
| D | 5006 | 46 | 0.918897% |
Noise dominated data is calculated using 1-second bins in cleaned event files. If a bin has >2000 counts, and if more than 50% of those come from <1% of pixels, then it is considered to be noise-dominated and hence unusable.
| Quadrant | # 1 sec bins | Bins with >0 counts | Bins with >2000 counts | High rate bins dominated by noise | Noise dominated (total time) | Noise dominated (detector-on time) | Marked lightcurve |
|---|---|---|---|---|---|---|---|
| A | 5005 | 5005 | 0 | 0 | 0.00% | 0.00% | 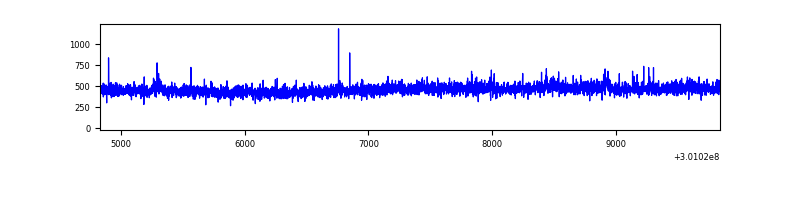 |
| B | 5006 | 5006 | 39 | 39 | 0.78% | 0.78% | 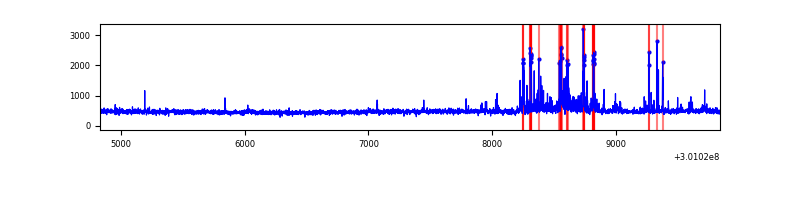 |
| C | 5006 | 5006 | 0 | 0 | 0.00% | 0.00% | 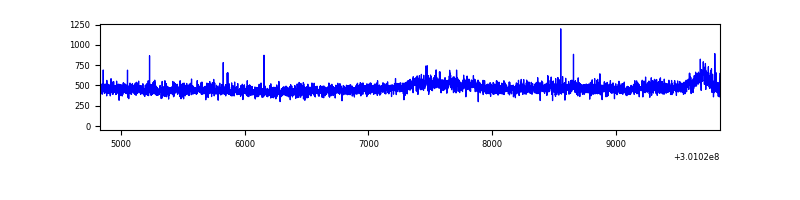 |
| D | 5006 | 5006 | 42 | 42 | 0.84% | 0.84% | 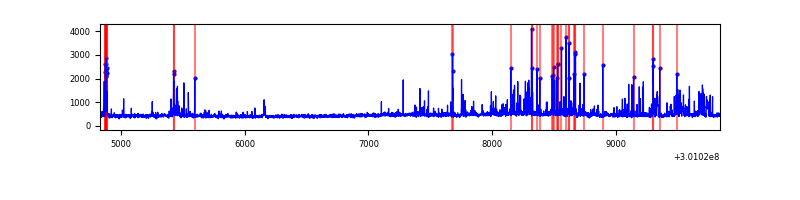 |
Top three noisy pixels from each quadrant. If the there are fewer than three noisy pixels in the level2.evt file, extra rows are filled as -1
| Pixel properties | Quadrant properties | ||||||
|---|---|---|---|---|---|---|---|
| Quadrant | DetID | PixID | Counts | Sigma | Mean | Median | Sigma |
| A | 6 | 16 | 17018 | 135.55 | 589 | 576 | 121.3 |
| A | 15 | 174 | 6747 | 50.88 | 589 | 576 | 121.3 |
| A | 0 | 226 | 5083 | 37.16 | 589 | 576 | 121.3 |
| B | 7 | 220 | 209875 | 1855.26 | 581 | 567 | 112.8 |
| B | 0 | 197 | 22817 | 197.22 | 581 | 567 | 112.8 |
| B | 12 | 111 | 13562 | 115.19 | 581 | 567 | 112.8 |
| C | 14 | 238 | 87373 | 655.78 | 559 | 561 | 132.4 |
| C | 8 | 208 | 46432 | 346.51 | 559 | 561 | 132.4 |
| C | 10 | 91 | 17085 | 124.82 | 559 | 561 | 132.4 |
| D | 1 | 52 | 237926 | 1679.72 | 565 | 547 | 141.3 |
| D | 13 | 153 | 184810 | 1303.87 | 565 | 547 | 141.3 |
| D | 2 | 234 | 20446 | 140.81 | 565 | 547 | 141.3 |
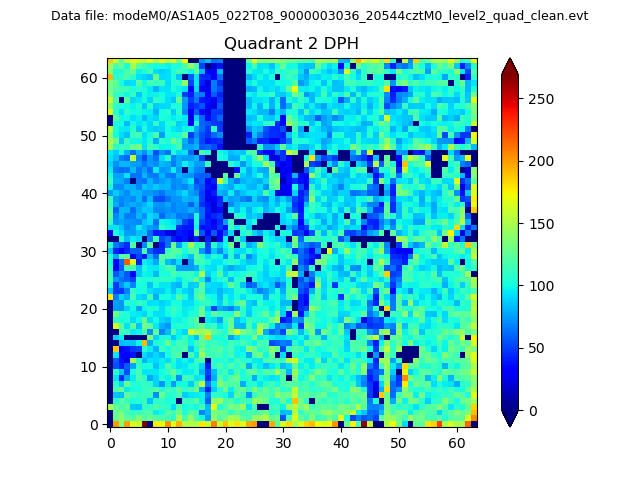
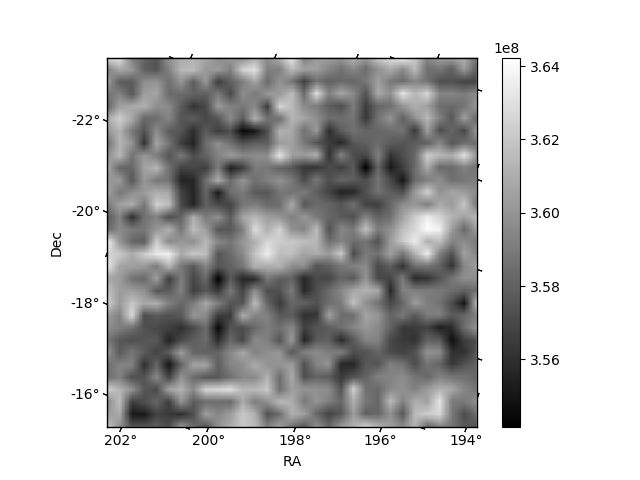
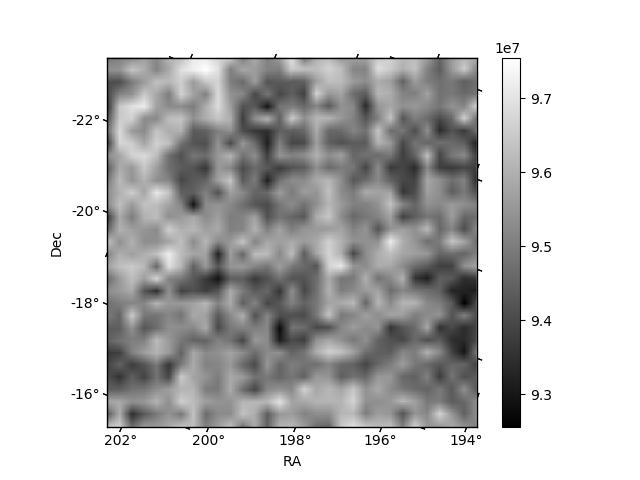
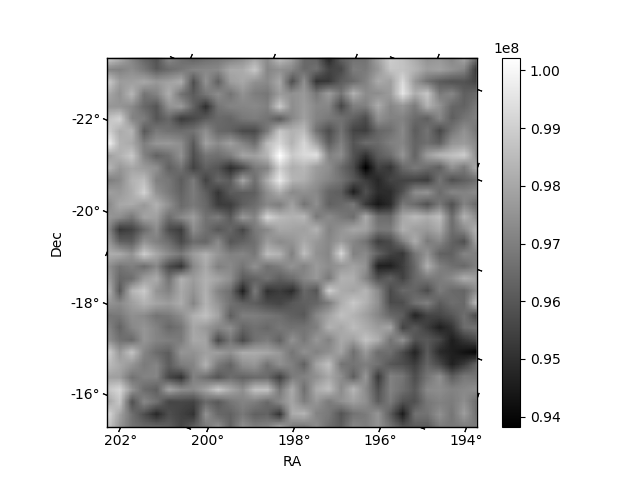
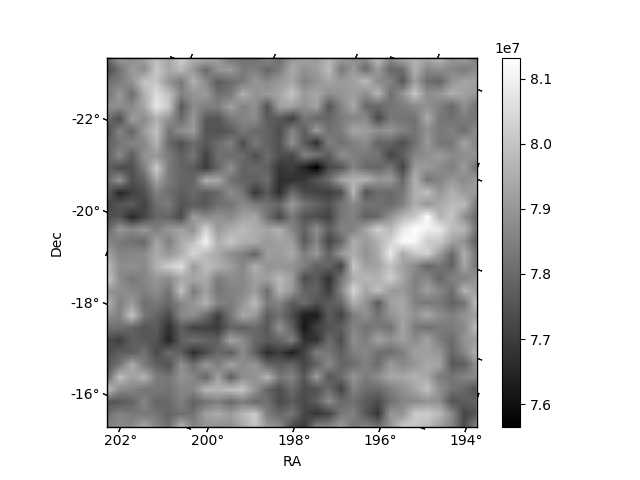
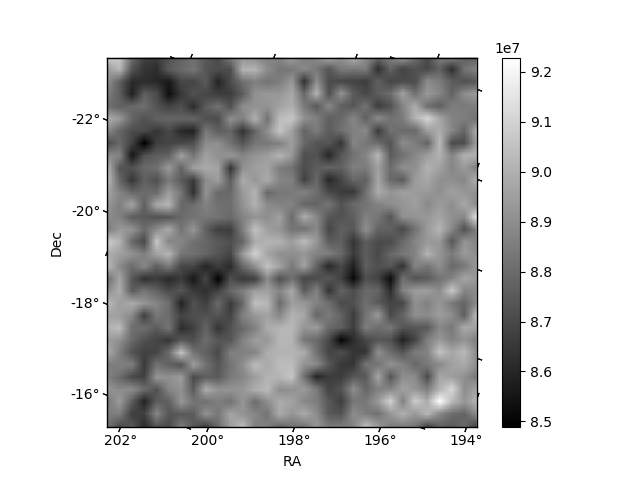
Histogram calculated using DETX and DETY for each event in the final _common_clean file
| Quadrant A | 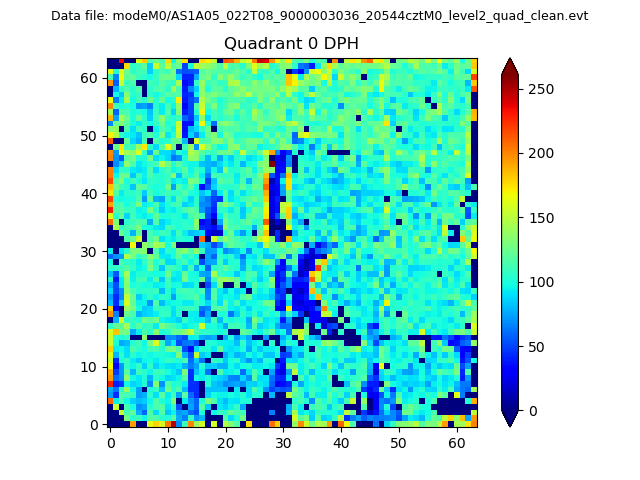 |
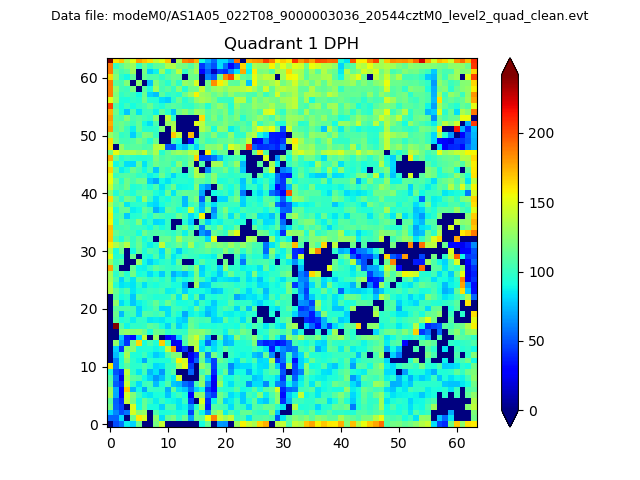 |
Quadrant B |
|---|---|---|---|
| Quadrant D | 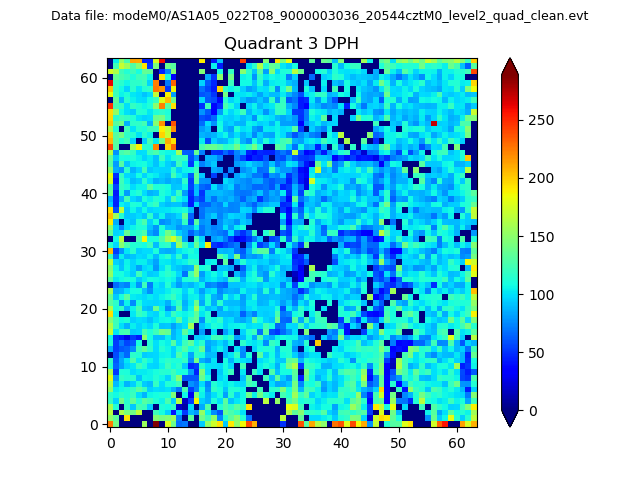 |
 |
Quadrant C |
| Plot type | Count rate plots | Images |
|---|---|---|
| Comparison with Poisson distribution Blue bars denote a histogram of data divided into 1 sec bins. Red curve is a Poisson curve with rate = median count rate of data. |
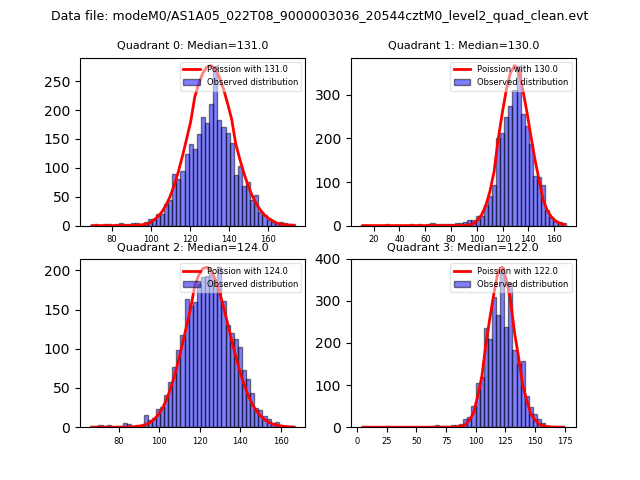 |
 |
| Quadrant-wise count rates Data is divided into 100 sec bins |
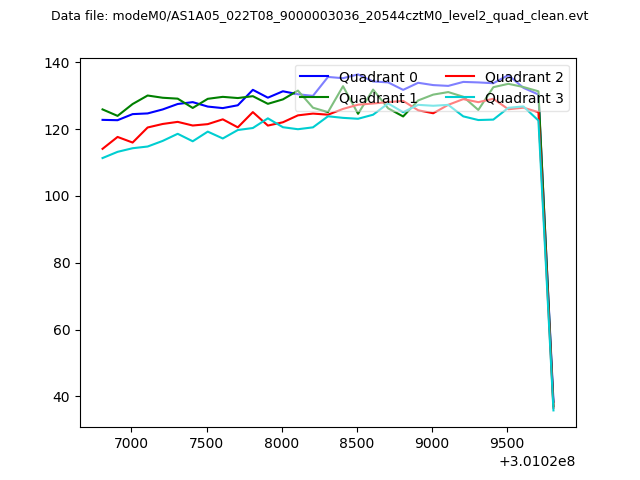 |
|
| Module-wise count rates for Quadrant A Data is divided into 100 sec bins |
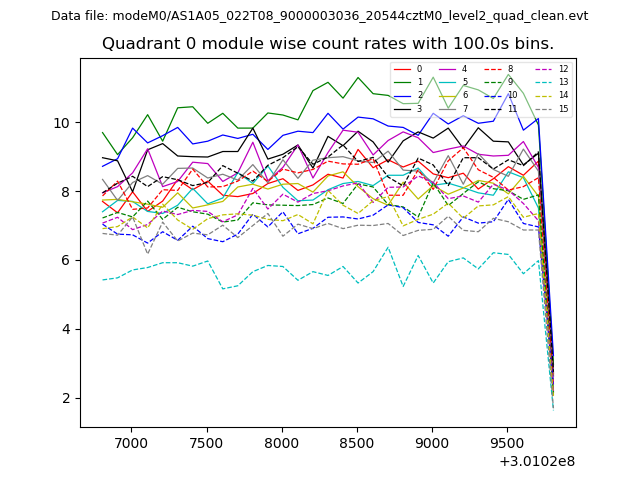 |
 |
| Module-wise count rates for Quadrant B Data is divided into 100 sec bins |
 |
 |
| Module-wise count rates for Quadrant C Data is divided into 100 sec bins |
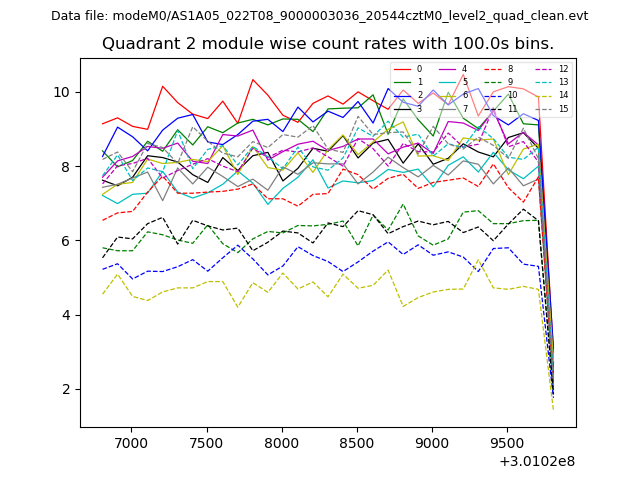 |
 |
| Module-wise count rates for Quadrant D Data is divided into 100 sec bins |
 |
 |
| Parameter | Plot |
|---|---|
| CZT HV Monitor | 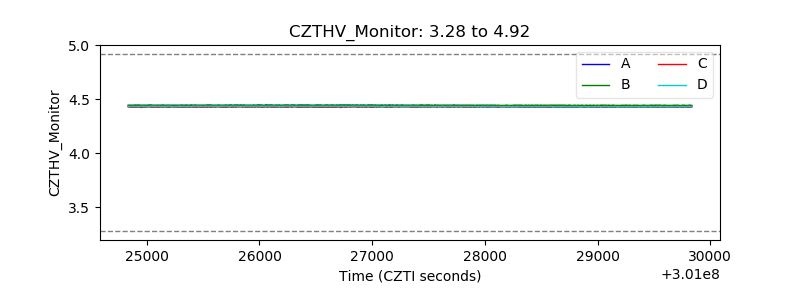 |
| D_VDD | 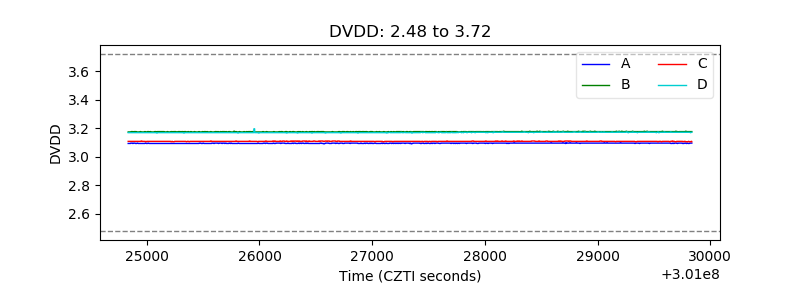 |
| Temperature 1 | 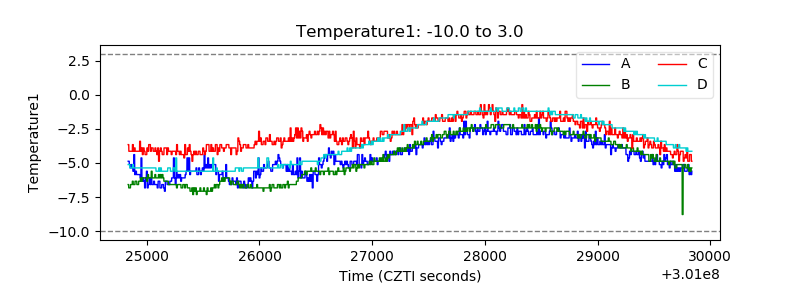 |
| Veto HV Monitor | 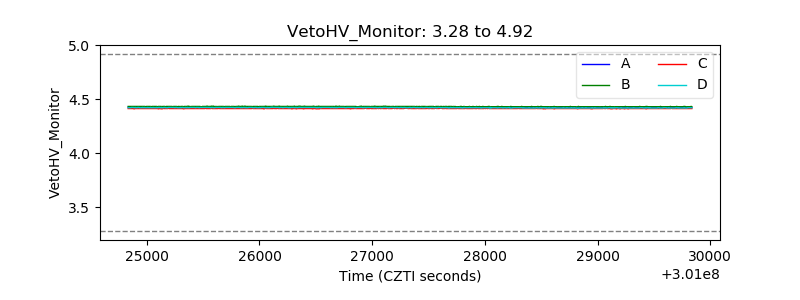 |
| Veto LLD |  |
| Alpha Counter | 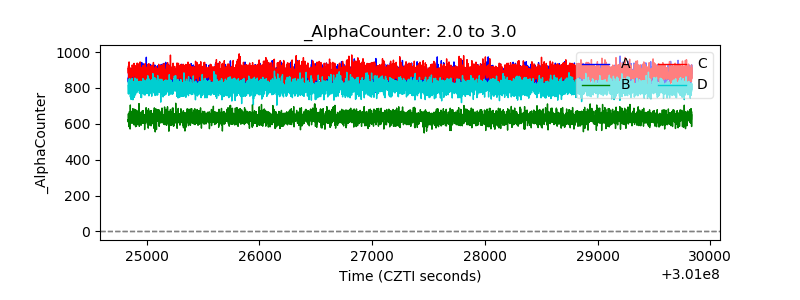 |
| _CPM_Rate | 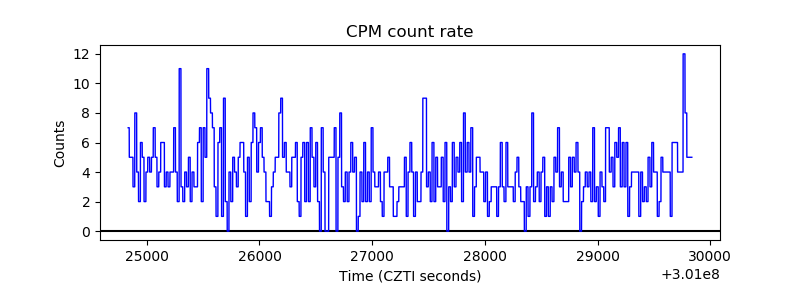 |
| CZT Counter | 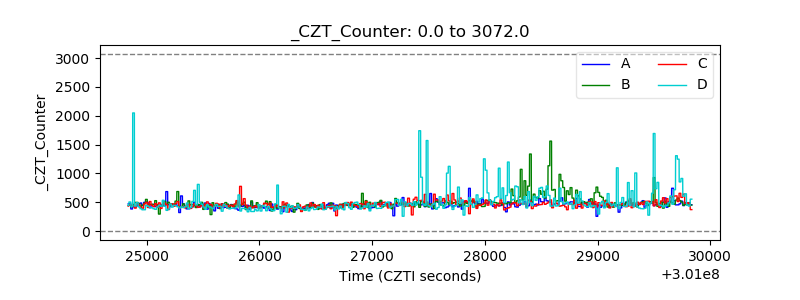 |
| +2.5 Volts monitor |  |
| +5 Volts monitor |  |
| _ROLL_ROT | 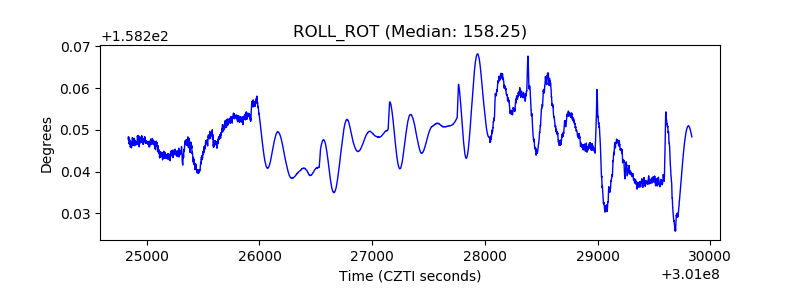 |
| _Roll_DEC | 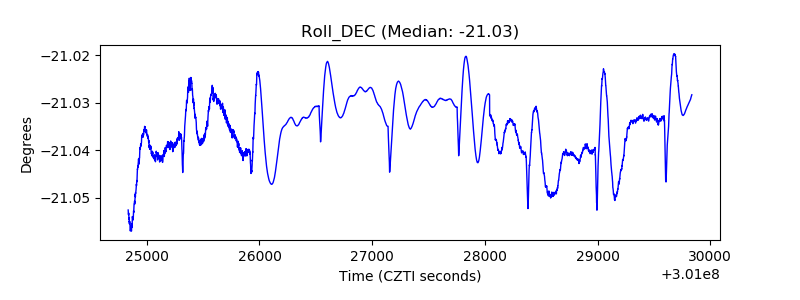 |
| _Roll_RA | 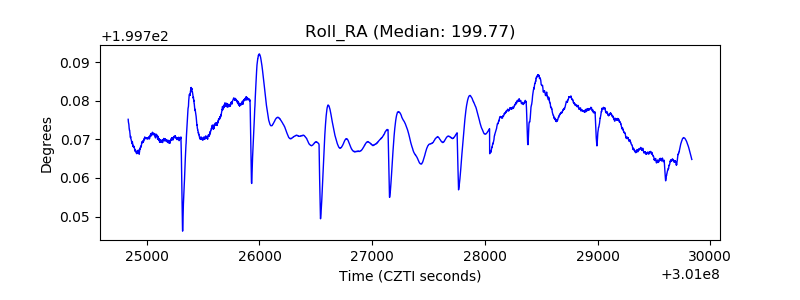 |
| Veto Counter |  |