| Param | Original file | Final file |
|---|---|---|
| Filename | modeM0/AS1A05_176T04_9000003034_20536cztM0_level2.evt | modeM0/AS1A05_176T04_9000003034_20536cztM0_level2_quad_clean.evt |
| Size (bytes) | 487,745,280 | 96,240,960 |
| Size | 465.2 MB | 91.8 MB |
| Events in quadrant A | 3,556,522 | 641,766 |
| Events in quadrant B | 3,788,554 | 633,666 |
| Events in quadrant C | 3,116,673 | 617,471 |
| Events in quadrant D | 3,903,413 | 603,327 |
| Mode SS | |||
|---|---|---|---|
| Quadrant | BADHDUFLAG | Total packets | Discarded packets |
| A | 0 | 122 | 0 |
| B | 0 | 122 | 0 |
| C | 0 | 122 | 0 |
| D | 0 | 122 | 0 |
| Mode M9 | |||
|---|---|---|---|
| Quadrant | BADHDUFLAG | Total packets | Discarded packets |
| A | 0 | 11 | 0 |
| B | 0 | 11 | 0 |
| C | 0 | 11 | 0 |
| D | 0 | 11 | 0 |
| Mode M0 | |||
|---|---|---|---|
| Quadrant | BADHDUFLAG | Total packets | Discarded packets |
| A | 0 | 14640 | 1 |
| B | 0 | 15333 | 1 |
| C | 0 | 13332 | 1 |
| D | 0 | 15647 | 1 |
| Quadrant | Total seconds | Saturated seconds | Saturation percentage |
|---|---|---|---|
| A | 5986 | 171 | 2.856666% |
| B | 5986 | 182 | 3.040428% |
| C | 5986 | 113 | 1.887738% |
| D | 5987 | 210 | 3.507600% |
Noise dominated data is calculated using 1-second bins in cleaned event files. If a bin has >2000 counts, and if more than 50% of those come from <1% of pixels, then it is considered to be noise-dominated and hence unusable.
| Quadrant | # 1 sec bins | Bins with >0 counts | Bins with >2000 counts | High rate bins dominated by noise | Noise dominated (total time) | Noise dominated (detector-on time) | Marked lightcurve |
|---|---|---|---|---|---|---|---|
| A | 7061 | 5987 | 71 | 71 | 1.01% | 1.19% | 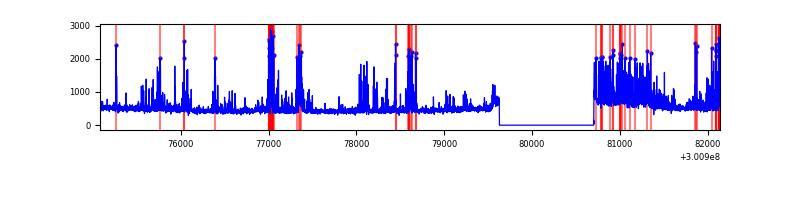 |
| B | 7061 | 5987 | 75 | 75 | 1.06% | 1.25% | 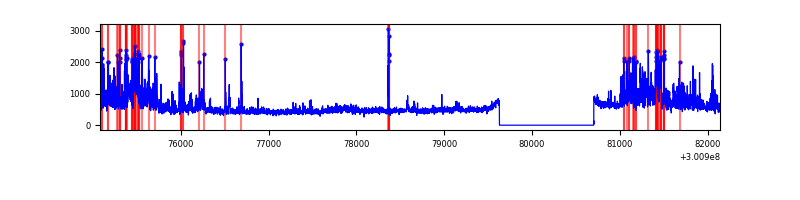 |
| C | 7061 | 5987 | 17 | 17 | 0.24% | 0.28% | 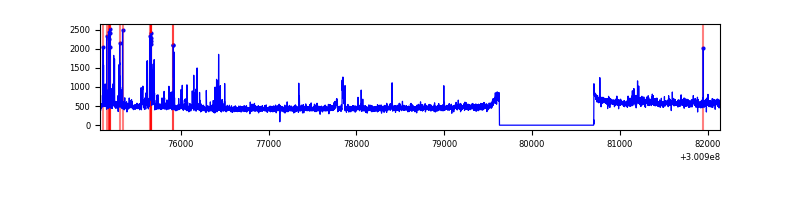 |
| D | 7062 | 5988 | 154 | 154 | 2.18% | 2.57% | 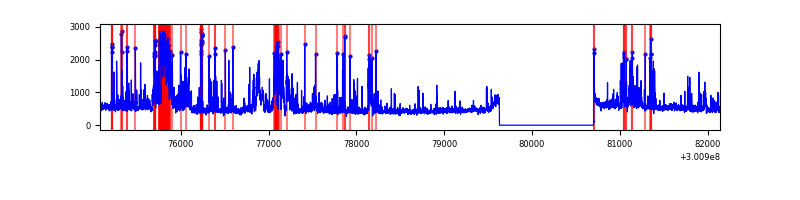 |
Top three noisy pixels from each quadrant. If the there are fewer than three noisy pixels in the level2.evt file, extra rows are filled as -1
| Pixel properties | Quadrant properties | ||||||
|---|---|---|---|---|---|---|---|
| Quadrant | DetID | PixID | Counts | Sigma | Mean | Median | Sigma |
| A | 6 | 16 | 757376 | 5183.1 | 722 | 706 | 146.0 |
| A | 11 | 29 | 11584 | 74.51 | 722 | 706 | 146.0 |
| A | 8 | 205 | 10953 | 70.19 | 722 | 706 | 146.0 |
| B | 7 | 220 | 382126 | 2876.44 | 713 | 695 | 132.6 |
| B | 0 | 197 | 242543 | 1823.82 | 713 | 695 | 132.6 |
| B | 0 | 189 | 144561 | 1084.92 | 713 | 695 | 132.6 |
| C | 0 | 207 | 180524 | 1111.23 | 696 | 700 | 161.8 |
| C | 14 | 238 | 109540 | 672.58 | 696 | 700 | 161.8 |
| C | 9 | 221 | 77396 | 473.95 | 696 | 700 | 161.8 |
| D | 12 | 238 | 518971 | 3052.16 | 703 | 683 | 169.8 |
| D | 13 | 153 | 183639 | 1077.41 | 703 | 683 | 169.8 |
| D | 2 | 184 | 141911 | 831.68 | 703 | 683 | 169.8 |
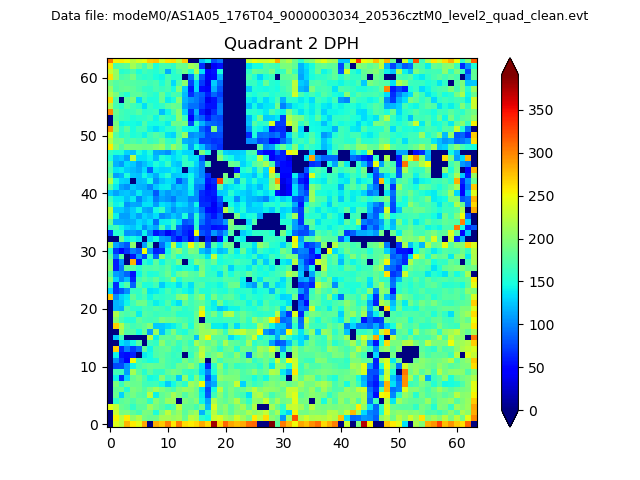
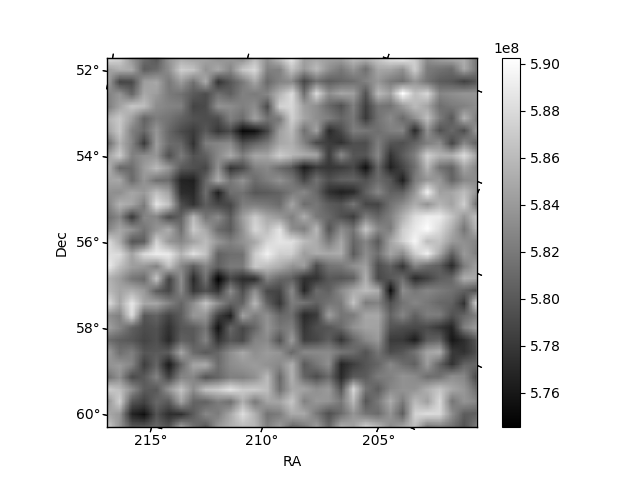
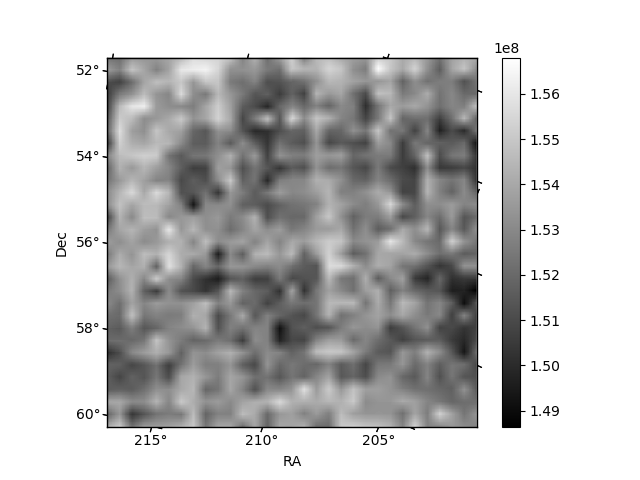
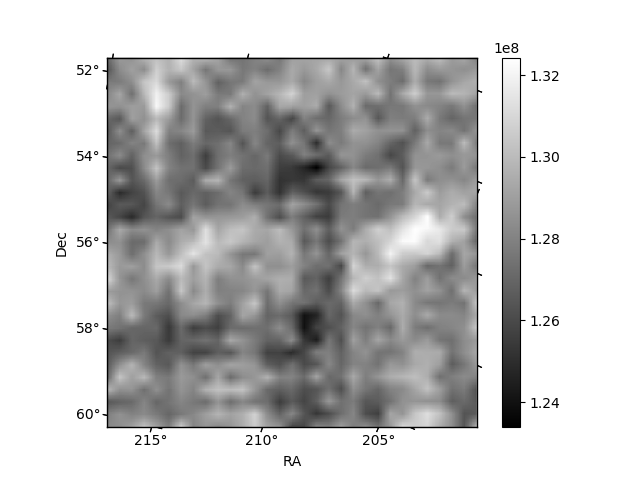
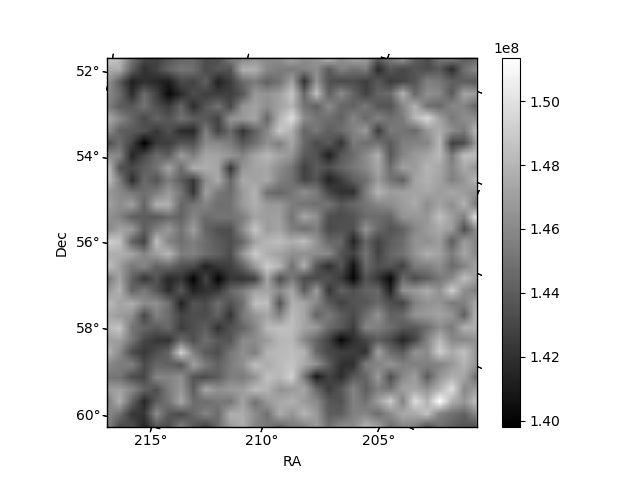
Histogram calculated using DETX and DETY for each event in the final _common_clean file
| Quadrant A | 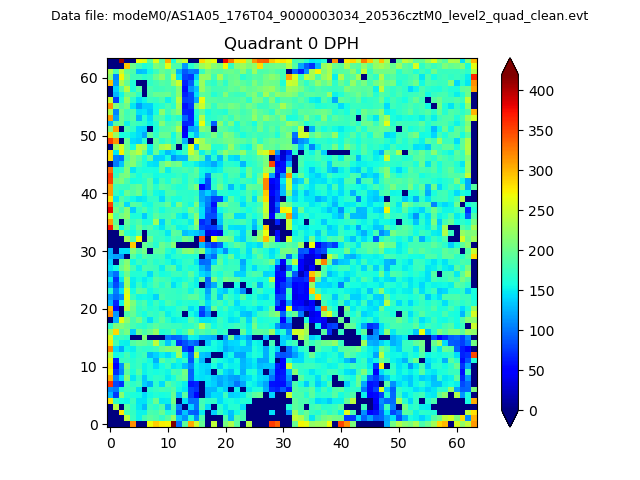 |
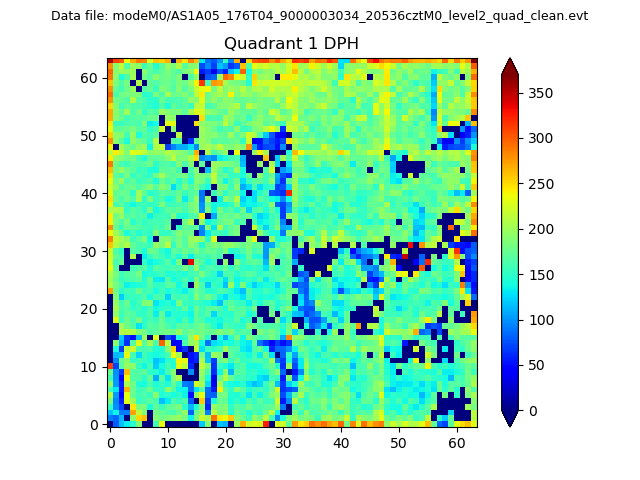 |
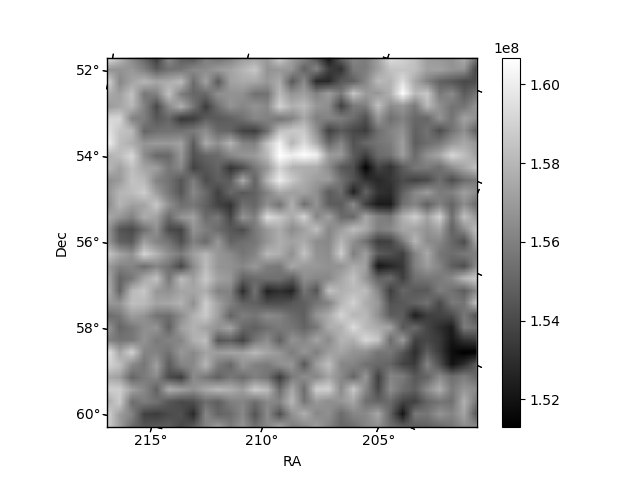
Quadrant B |
|---|---|---|---|
| Quadrant D | 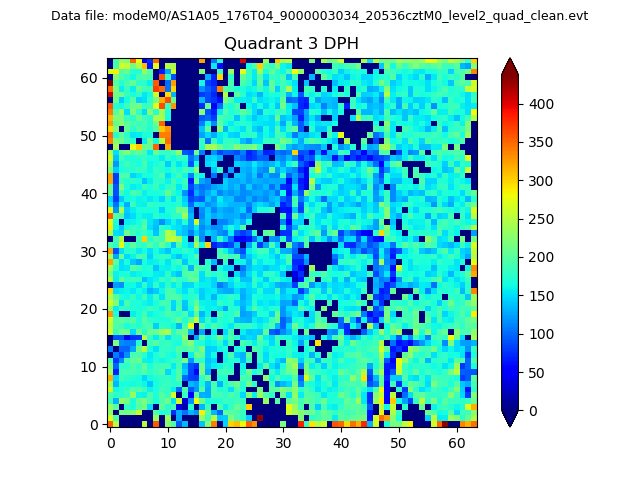 |
 |
Quadrant C |
| Plot type | Count rate plots | Images |
|---|---|---|
| Comparison with Poisson distribution Blue bars denote a histogram of data divided into 1 sec bins. Red curve is a Poisson curve with rate = median count rate of data. |
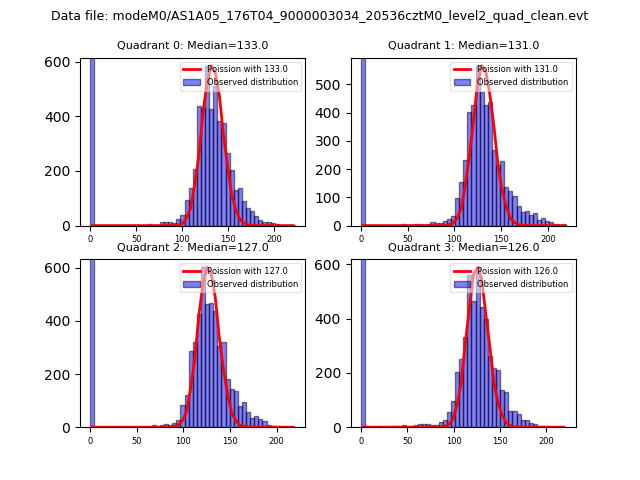 |
 |
| Quadrant-wise count rates Data is divided into 100 sec bins |
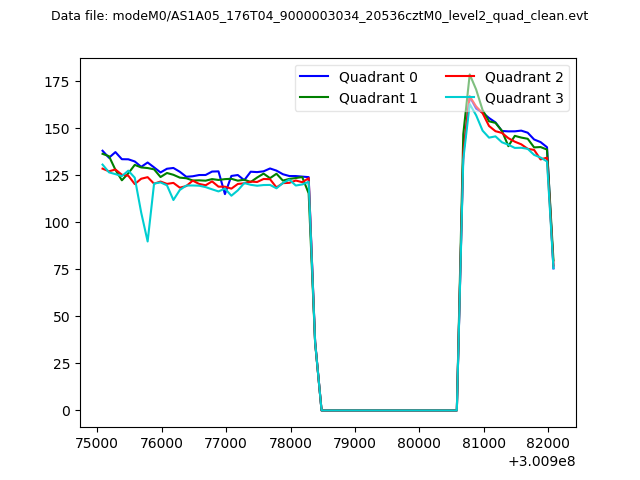 |
|
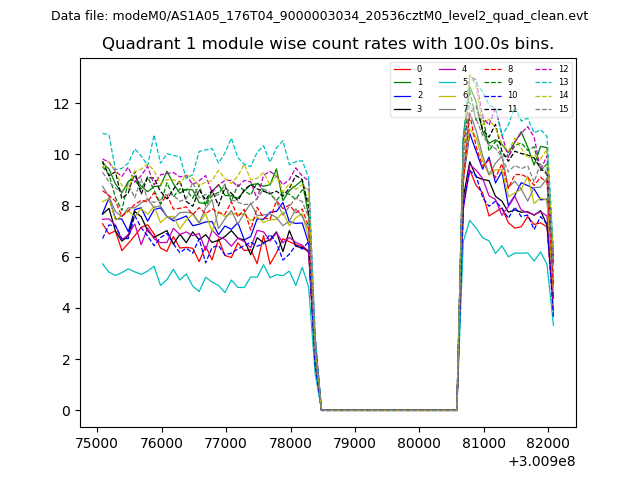
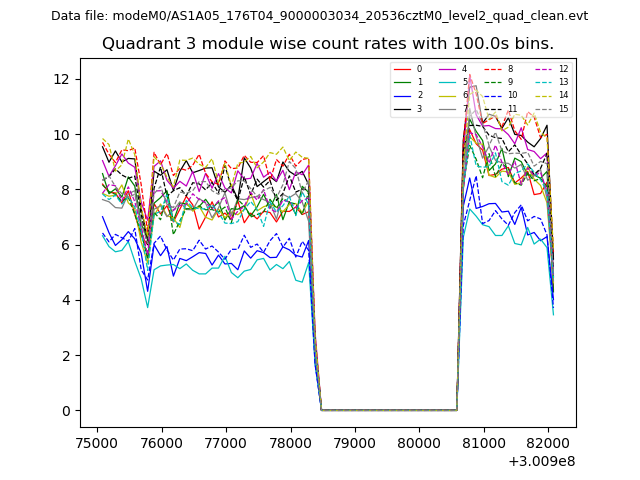
| Module-wise count rates for Quadrant A Data is divided into 100 sec bins |
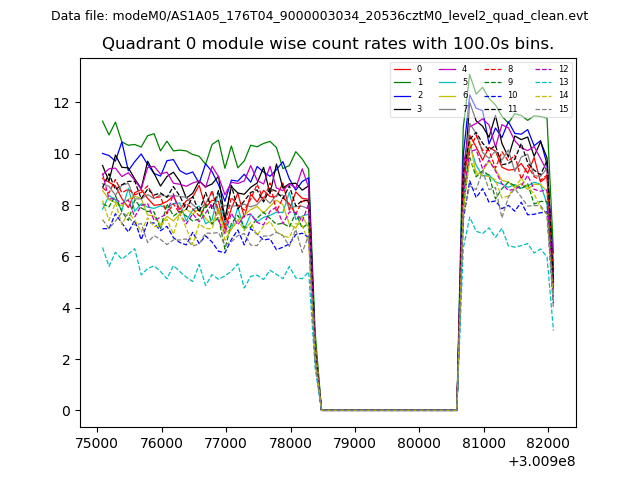 |
 |
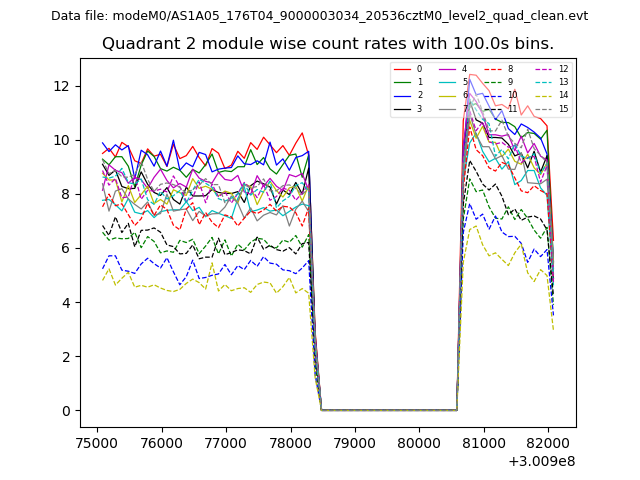
| Module-wise count rates for Quadrant B Data is divided into 100 sec bins |
 |
 |
| Module-wise count rates for Quadrant C Data is divided into 100 sec bins |
 |
 |
| Module-wise count rates for Quadrant D Data is divided into 100 sec bins |
 |
 |
| Parameter | Plot |
|---|---|
| CZT HV Monitor | 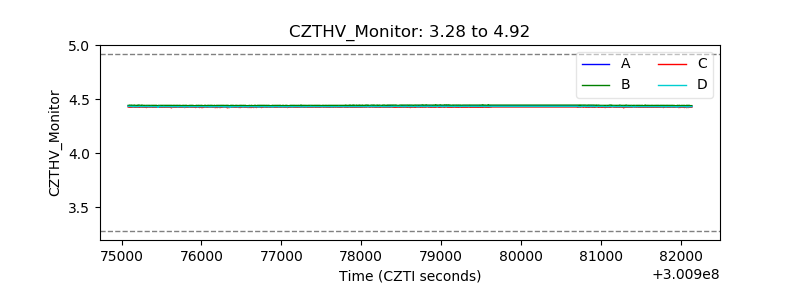 |
| D_VDD |  |
| Temperature 1 | 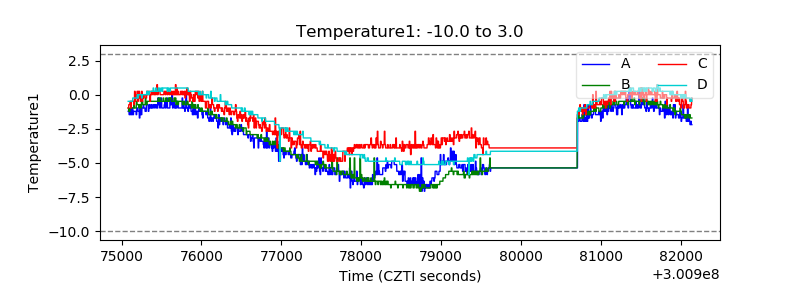 |
| Veto HV Monitor | 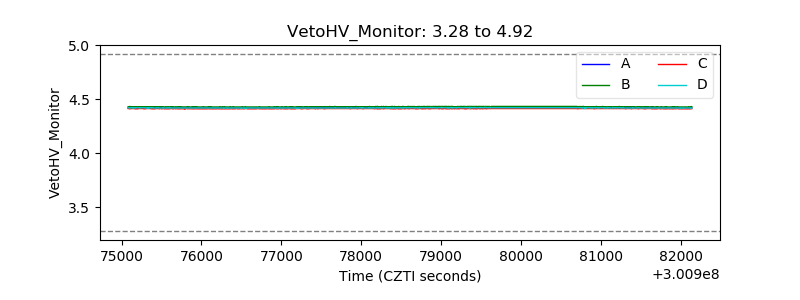 |
| Veto LLD | 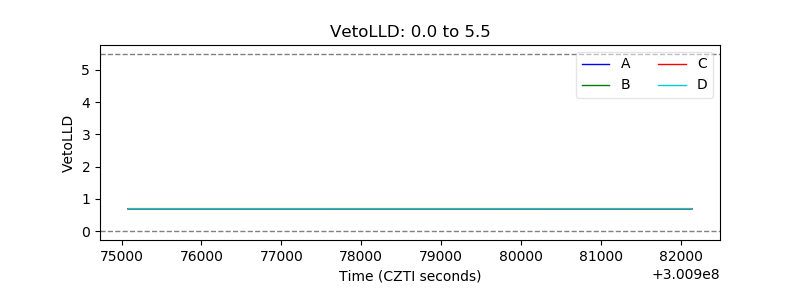 |
| Alpha Counter | 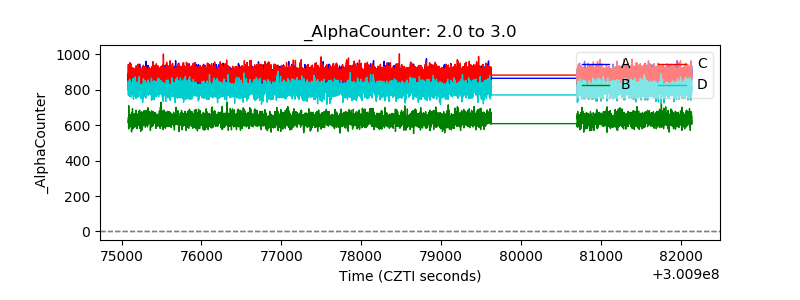 |
| _CPM_Rate | 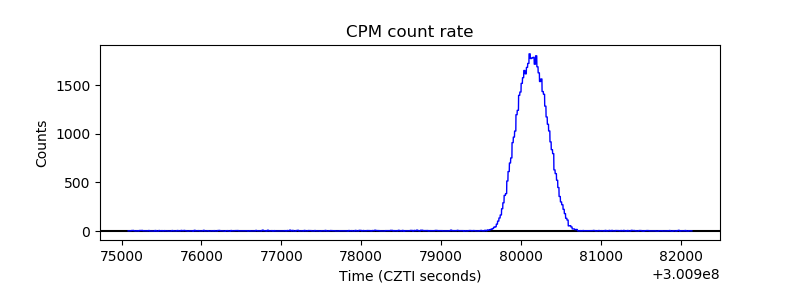 |
| CZT Counter | 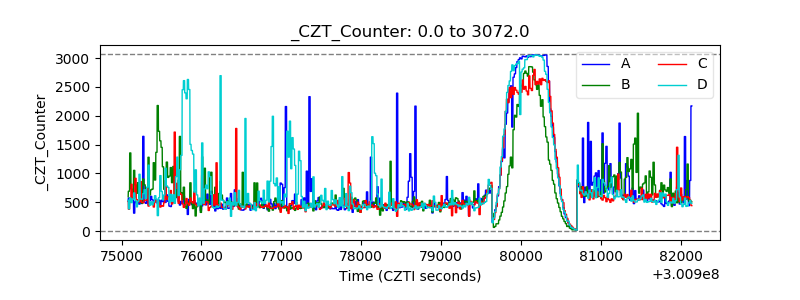 |
| +2.5 Volts monitor |  |
| +5 Volts monitor |  |
| _ROLL_ROT | 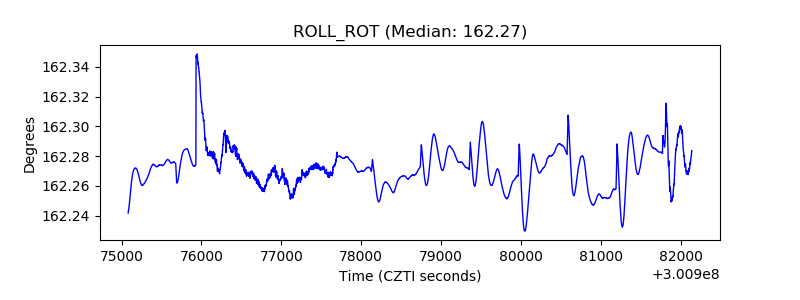 |
| _Roll_DEC | 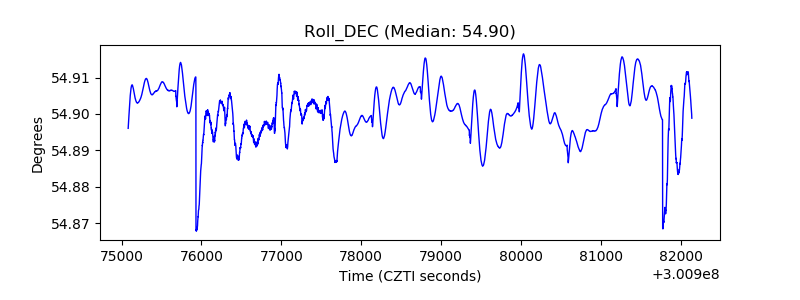 |
| _Roll_RA | 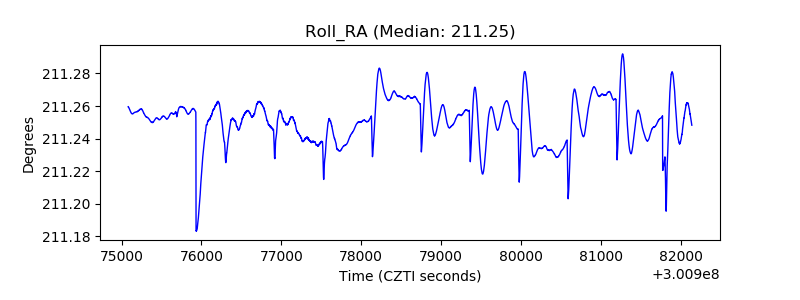 |
| Veto Counter | 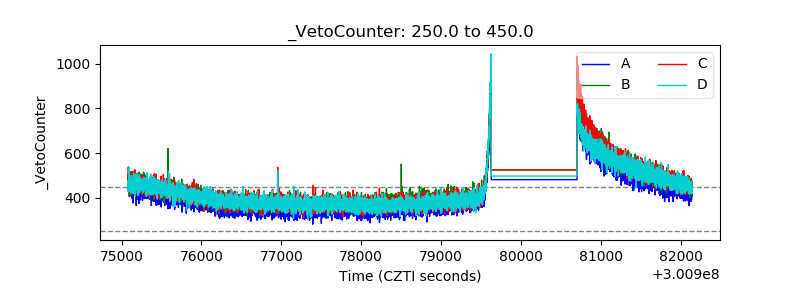 |