| Param | Original file | Final file |
|---|---|---|
| Filename | modeM0/AS1A05_176T04_9000003034_20537cztM0_level2.evt | modeM0/AS1A05_176T04_9000003034_20537cztM0_level2_quad_clean.evt |
| Size (bytes) | 482,500,800 | 98,187,840 |
| Size | 460.1 MB | 93.6 MB |
| Events in quadrant A | 4,002,112 | 654,350 |
| Events in quadrant B | 3,605,172 | 658,492 |
| Events in quadrant C | 3,211,861 | 639,753 |
| Events in quadrant D | 3,408,428 | 623,928 |
| Mode SS | |||
|---|---|---|---|
| Quadrant | BADHDUFLAG | Total packets | Discarded packets |
| A | 0 | 116 | 0 |
| B | 0 | 116 | 0 |
| C | 0 | 116 | 0 |
| D | 0 | 116 | 0 |
| Mode M9 | |||
|---|---|---|---|
| Quadrant | BADHDUFLAG | Total packets | Discarded packets |
| A | 0 | 10 | 0 |
| B | 0 | 10 | 0 |
| C | 0 | 10 | 0 |
| D | 0 | 10 | 0 |
| Mode M0 | |||
|---|---|---|---|
| Quadrant | BADHDUFLAG | Total packets | Discarded packets |
| A | 0 | 15665 | 2 |
| B | 0 | 14599 | 2 |
| C | 0 | 13110 | 2 |
| D | 0 | 13849 | 2 |
| Quadrant | Total seconds | Saturated seconds | Saturation percentage |
|---|---|---|---|
| A | 5673 | 217 | 3.825137% |
| B | 5674 | 140 | 2.467395% |
| C | 5674 | 82 | 1.445189% |
| D | 5674 | 138 | 2.432147% |
Noise dominated data is calculated using 1-second bins in cleaned event files. If a bin has >2000 counts, and if more than 50% of those come from <1% of pixels, then it is considered to be noise-dominated and hence unusable.
| Quadrant | # 1 sec bins | Bins with >0 counts | Bins with >2000 counts | High rate bins dominated by noise | Noise dominated (total time) | Noise dominated (detector-on time) | Marked lightcurve |
|---|---|---|---|---|---|---|---|
| A | 11504 | 5675 | 163 | 163 | 1.42% | 2.87% | 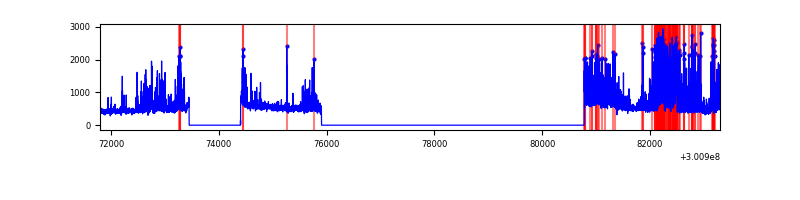 |
| B | 11504 | 5676 | 63 | 63 | 0.55% | 1.11% | 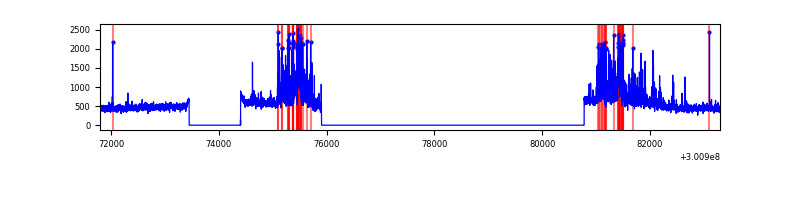 |
| C | 11504 | 5676 | 15 | 15 | 0.13% | 0.26% | 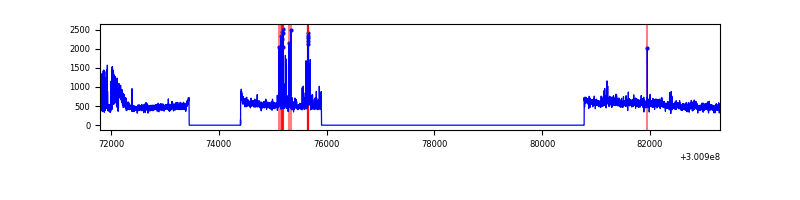 |
| D | 11504 | 5676 | 117 | 117 | 1.02% | 2.06% | 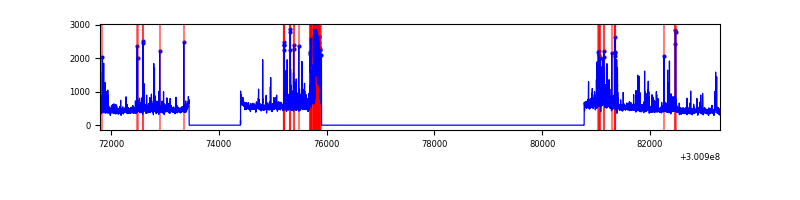 |
Top three noisy pixels from each quadrant. If the there are fewer than three noisy pixels in the level2.evt file, extra rows are filled as -1
| Pixel properties | Quadrant properties | ||||||
|---|---|---|---|---|---|---|---|
| Quadrant | DetID | PixID | Counts | Sigma | Mean | Median | Sigma |
| A | 6 | 16 | 1259297 | 8761.37 | 708 | 694 | 143.7 |
| A | 8 | 205 | 9553 | 61.67 | 708 | 694 | 143.7 |
| A | 11 | 29 | 9397 | 60.58 | 708 | 694 | 143.7 |
| B | 7 | 220 | 376526 | 2880.08 | 701 | 684 | 130.5 |
| B | 0 | 197 | 246214 | 1881.5 | 701 | 684 | 130.5 |
| B | 0 | 189 | 92579 | 704.19 | 701 | 684 | 130.5 |
| C | 8 | 208 | 183726 | 1162.67 | 680 | 686 | 157.4 |
| C | 0 | 207 | 136183 | 860.68 | 680 | 686 | 157.4 |
| C | 9 | 221 | 131095 | 828.36 | 680 | 686 | 157.4 |
| D | 12 | 238 | 323366 | 1936.14 | 690 | 670 | 166.7 |
| D | 13 | 153 | 126774 | 756.61 | 690 | 670 | 166.7 |
| D | 7 | 38 | 100760 | 600.53 | 690 | 670 | 166.7 |
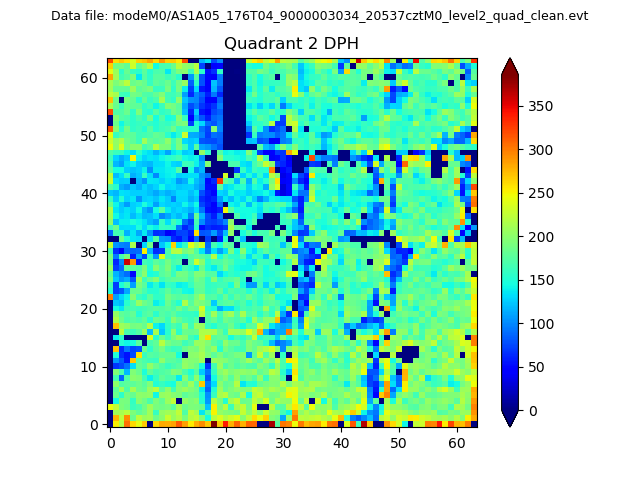
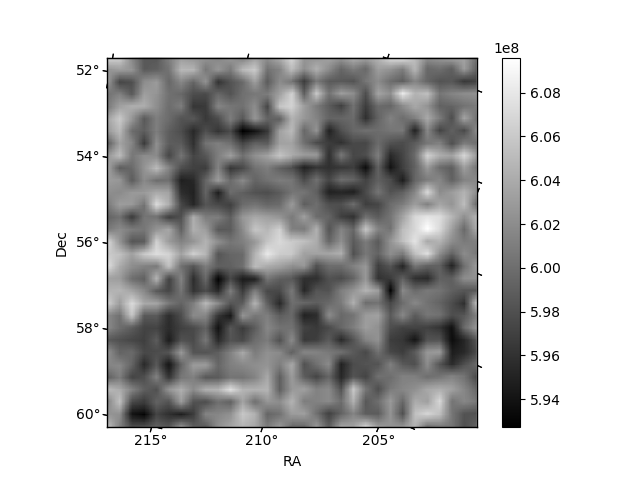
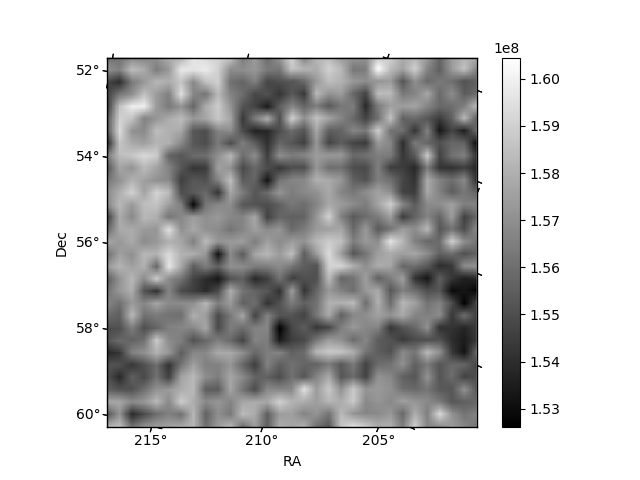
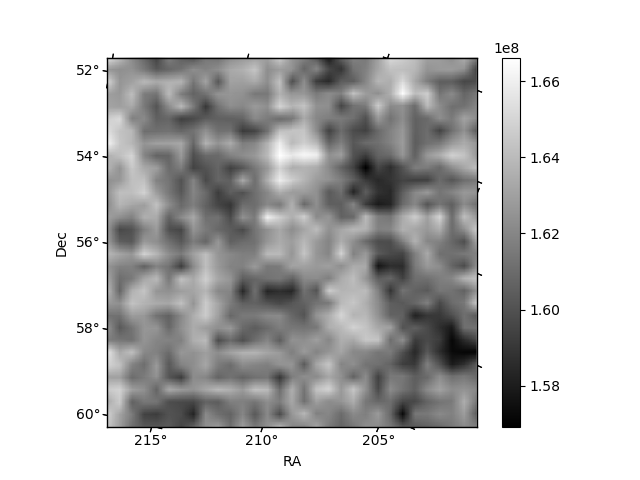
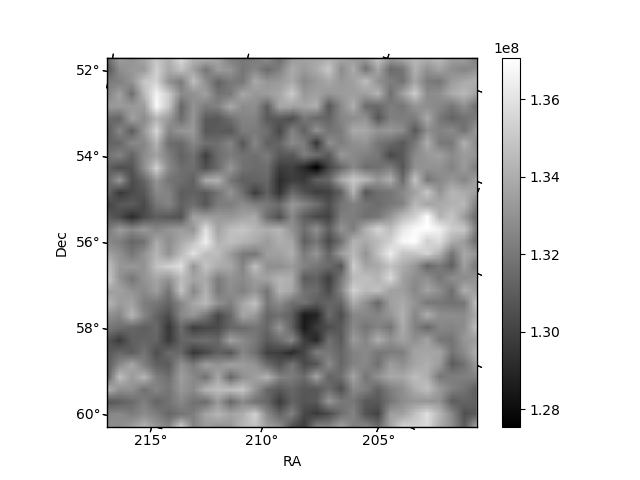
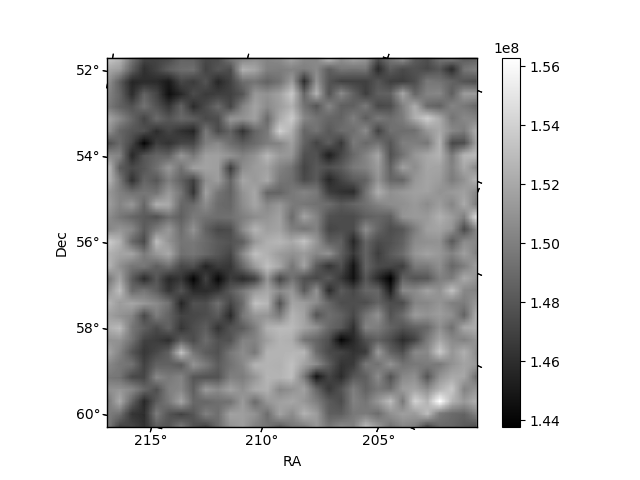
Histogram calculated using DETX and DETY for each event in the final _common_clean file
| Quadrant A | 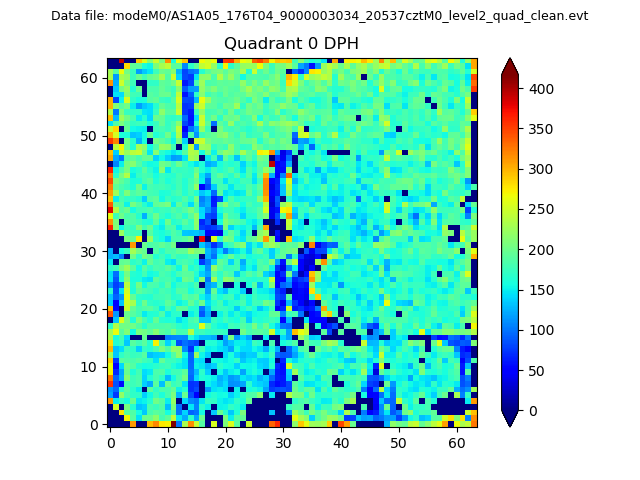 |
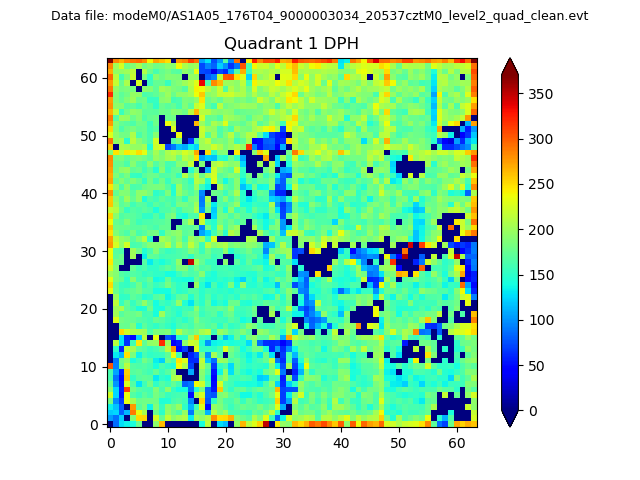 |
Quadrant B |
|---|---|---|---|
| Quadrant D | 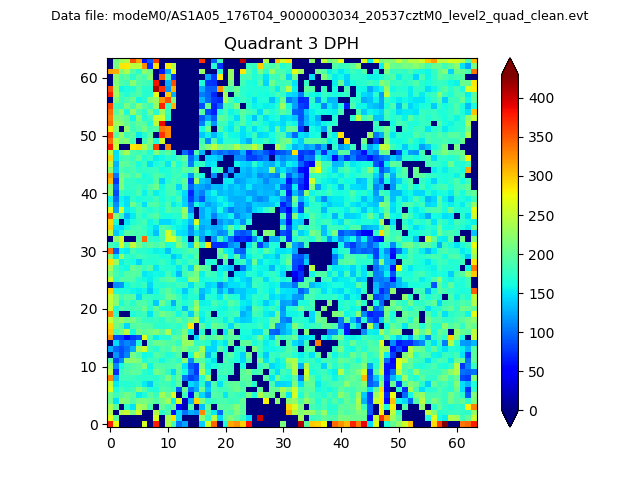 |
 |
Quadrant C |
| Plot type | Count rate plots | Images |
|---|---|---|
| Comparison with Poisson distribution Blue bars denote a histogram of data divided into 1 sec bins. Red curve is a Poisson curve with rate = median count rate of data. |
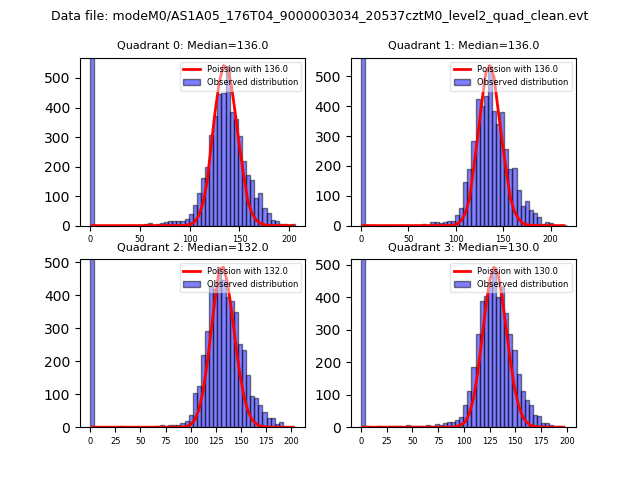 |
 |
| Quadrant-wise count rates Data is divided into 100 sec bins |
 |
|
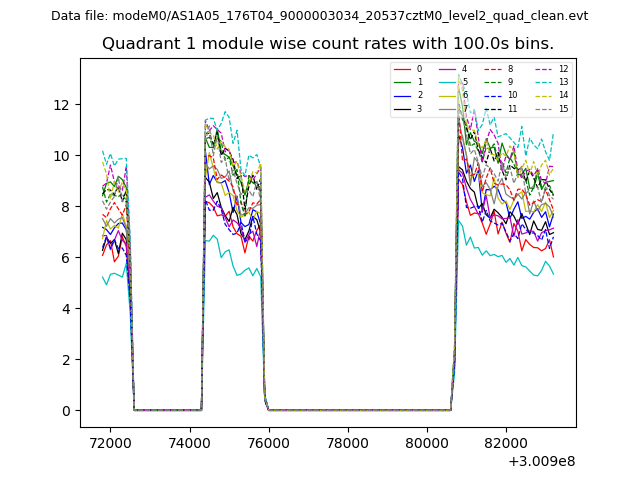
| Module-wise count rates for Quadrant A Data is divided into 100 sec bins |
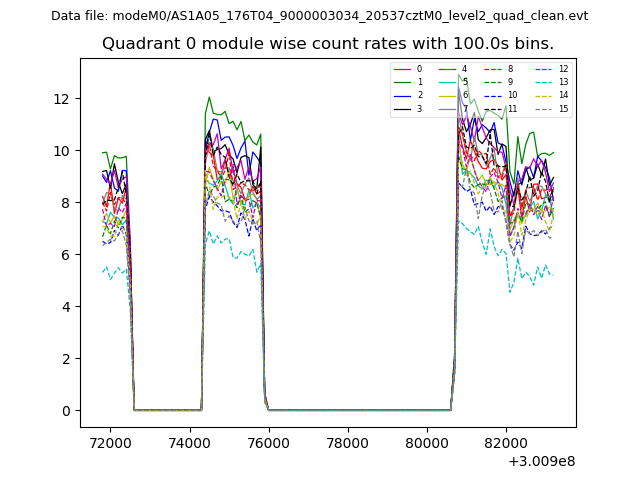 |
 |
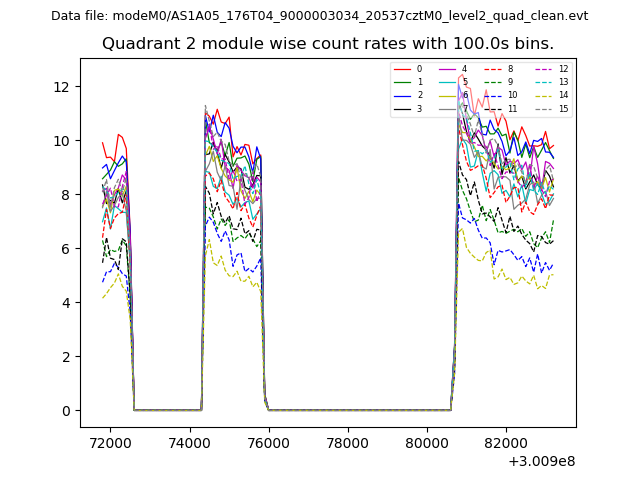
| Module-wise count rates for Quadrant B Data is divided into 100 sec bins |
 |
 |
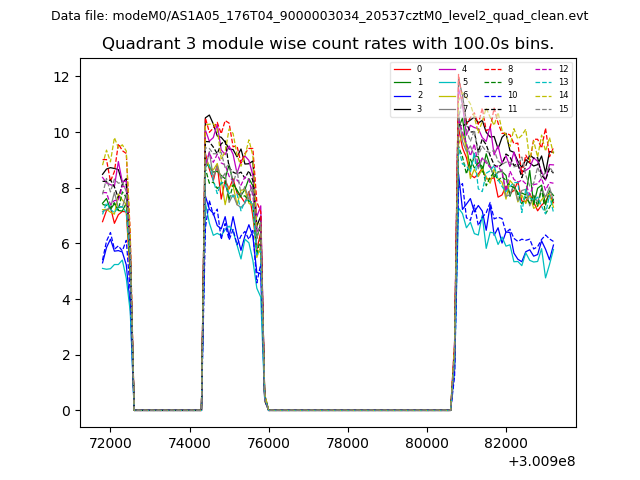
| Module-wise count rates for Quadrant C Data is divided into 100 sec bins |
 |
 |
| Module-wise count rates for Quadrant D Data is divided into 100 sec bins |
 |
 |
| Parameter | Plot |
|---|---|
| CZT HV Monitor | 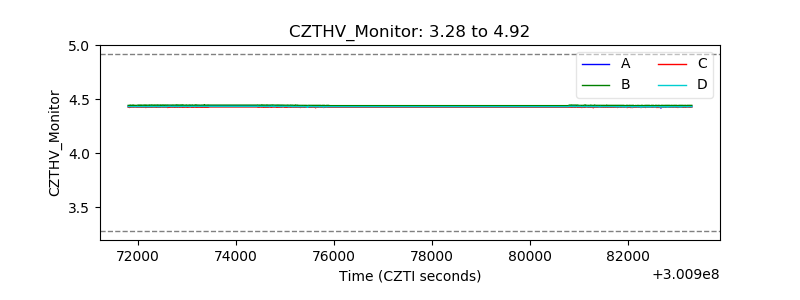 |
| D_VDD | 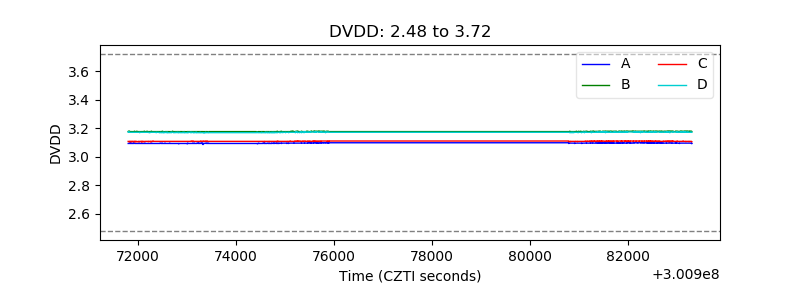 |
| Temperature 1 | 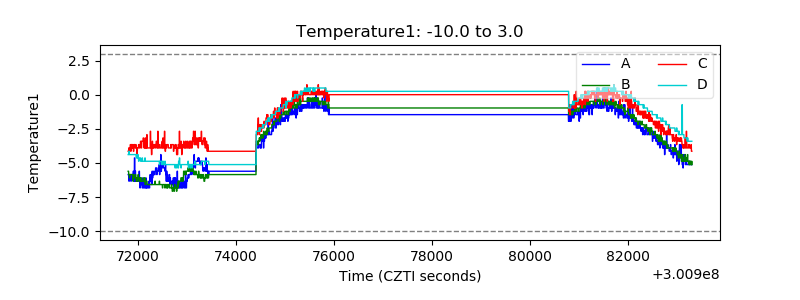 |
| Veto HV Monitor | 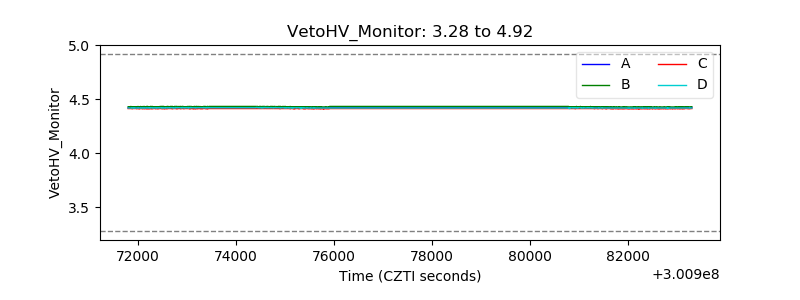 |
| Veto LLD | 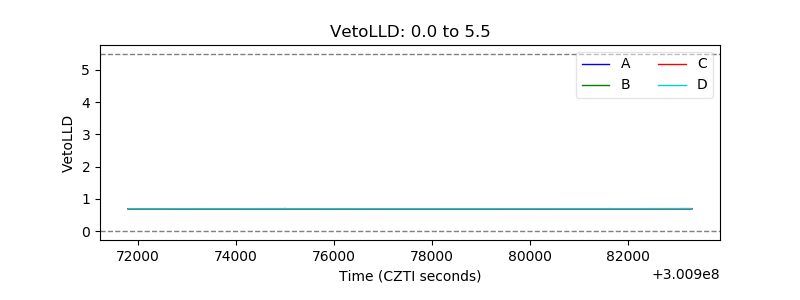 |
| Alpha Counter | 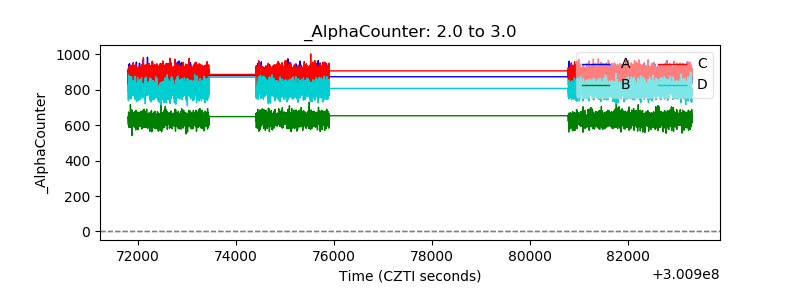 |
| _CPM_Rate | 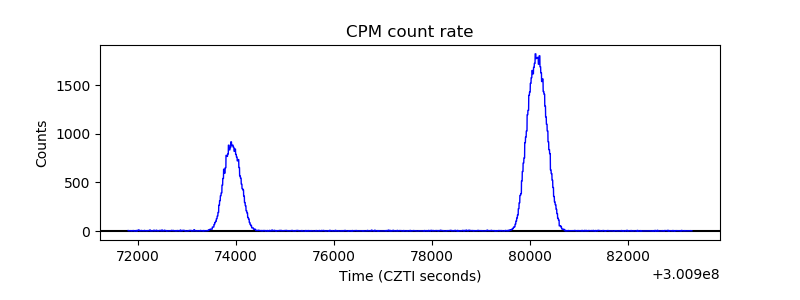 |
| CZT Counter | 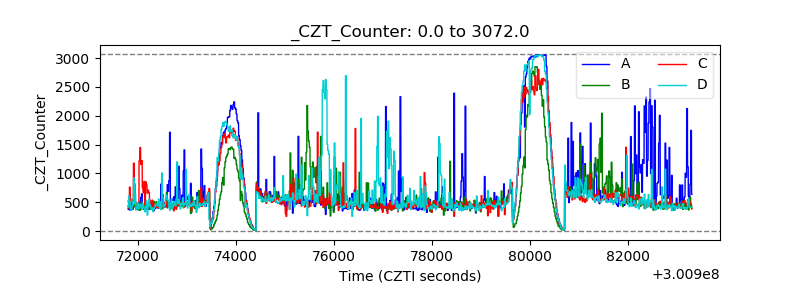 |
| +2.5 Volts monitor |  |
| +5 Volts monitor |  |
| _ROLL_ROT | 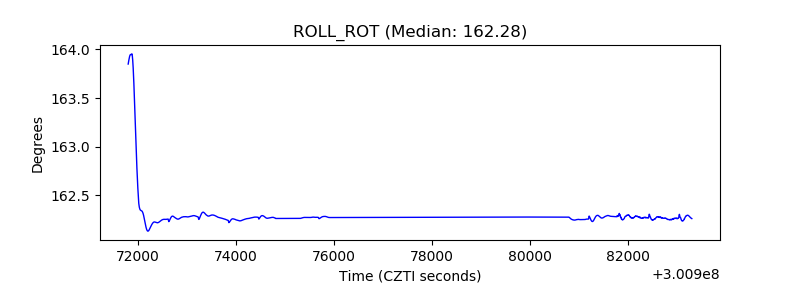 |
| _Roll_DEC | 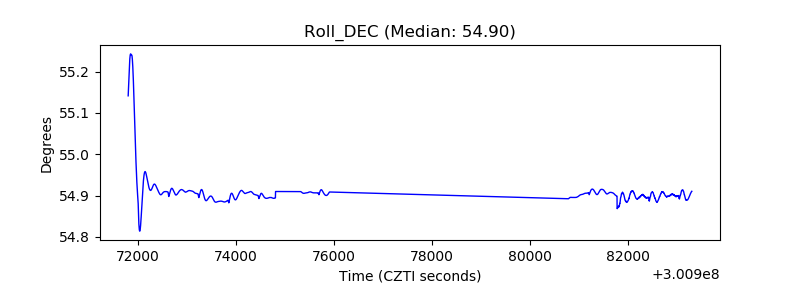 |
| _Roll_RA | 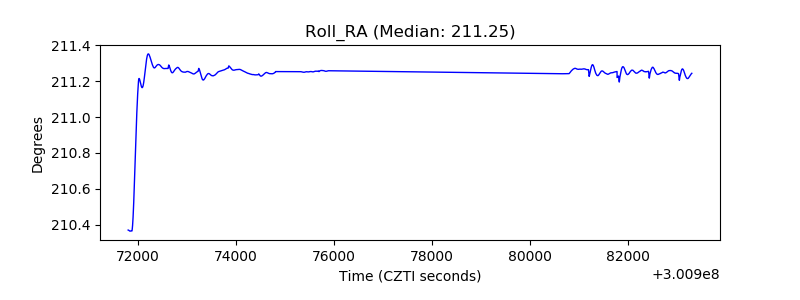 |
| Veto Counter | 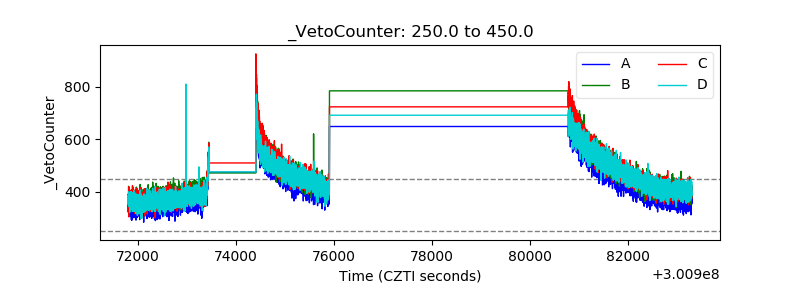 |