| Param | Original file | Final file |
|---|---|---|
| Filename | modeM0/AS1A05_069T02_9000003038cztM0_level2.fits | modeM0/AS1A05_069T02_9000003038cztM0_level2_quad_clean.evt |
| Size (bytes) | 400,547,520 | 368,432,640 |
| Size | 382.0 MB | 351.4 MB |
| Events in quadrant A | 2,451,342 | 2,191,256 |
| Events in quadrant B | 2,367,344 | 2,213,549 |
| Events in quadrant C | 2,405,876 | 2,058,751 |
| Events in quadrant D | 2,108,368 | 1,895,964 |
| Mode M0 | |||
|---|---|---|---|
| Quadrant | BADHDUFLAG | Total packets | Discarded packets |
| A | 0 | 86312 | 0 |
| B | 0 | 85041 | 0 |
| C | 0 | 84629 | 0 |
| D | 0 | 91962 | 0 |
| Mode M9 | |||
|---|---|---|---|
| Quadrant | BADHDUFLAG | Total packets | Discarded packets |
| A | 0 | 57 | 0 |
| B | 0 | 57 | 0 |
| C | 0 | 57 | 0 |
| D | 0 | 57 | 0 |
| Mode SS | |||
|---|---|---|---|
| Quadrant | BADHDUFLAG | Total packets | Discarded packets |
| A | 0 | 830 | 0 |
| B | 0 | 830 | 0 |
| C | 0 | 830 | 0 |
| D | 0 | 830 | 0 |
| Quadrant | Total seconds | Saturated seconds | Saturation percentage |
|---|---|---|---|
| A | 40749 | 456 | 1.119046% |
| B | 40749 | 473 | 1.160765% |
| C | 40749 | 528 | 1.295737% |
| D | 40749 | 672 | 1.649120% |
Noise dominated data is calculated using 1-second bins in cleaned event files. If a bin has >2000 counts, and if more than 50% of those come from <1% of pixels, then it is considered to be noise-dominated and hence unusable.
| Quadrant | # 1 sec bins | Bins with >0 counts | Bins with >2000 counts | High rate bins dominated by noise | Noise dominated (total time) | Noise dominated (detector-on time) | Marked lightcurve |
|---|---|---|---|---|---|---|---|
| A | 46509 | 40749 | 0 | 0 | 0.00% | 0.00% | 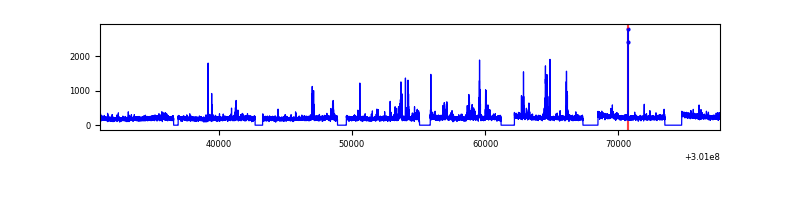 |
| B | 46509 | 40749 | 0 | 0 | 0.00% | 0.00% | 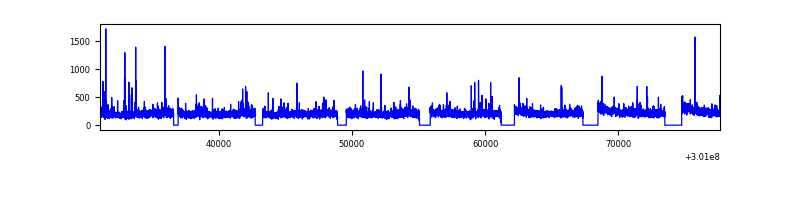 |
| C | 46509 | 40749 | 0 | 0 | 0.00% | 0.00% | 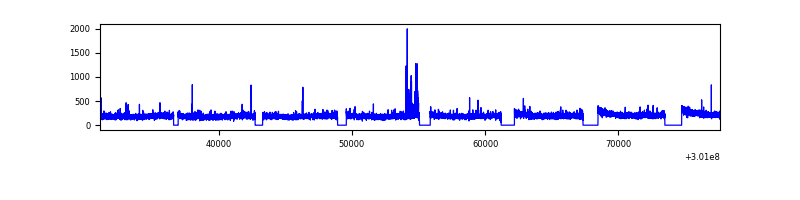 |
| D | 46509 | 40741 | 0 | 0 | 0.00% | 0.00% |  |
Top three noisy pixels from each quadrant. If the there are fewer than three noisy pixels in the level2.evt file, extra rows are filled as -1
| Pixel properties | Quadrant properties | ||||||
|---|---|---|---|---|---|---|---|
| Quadrant | DetID | PixID | Counts | Sigma | Mean | Median | Sigma |
| A | 0 | 29 | 2422 | 11.43 | 638 | 597 | 159.7 |
| A | 7 | 110 | 1922 | 8.3 | 638 | 597 | 159.7 |
| A | 9 | 19 | 1887 | 8.08 | 638 | 597 | 159.7 |
| B | 2 | 9 | 1917 | 10.59 | 624 | 594 | 124.9 |
| B | 2 | 8 | 1655 | 8.49 | 624 | 594 | 124.9 |
| B | 5 | 128 | 1547 | 7.63 | 624 | 594 | 124.9 |
| C | 1 | 80 | 1796 | 7.43 | 634 | 591 | 162.3 |
| C | 1 | 81 | 1780 | 7.33 | 634 | 591 | 162.3 |
| C | 12 | 241 | 1721 | 6.96 | 634 | 591 | 162.3 |
| D | 3 | 14 | 1486 | 5.93 | 600 | 547 | 158.4 |
| D | 10 | 189 | 1468 | 5.81 | 600 | 547 | 158.4 |
| D | 7 | 5 | 1463 | 5.78 | 600 | 547 | 158.4 |
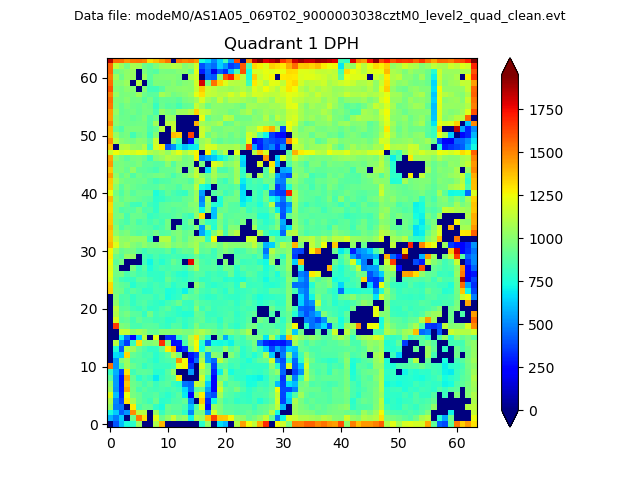
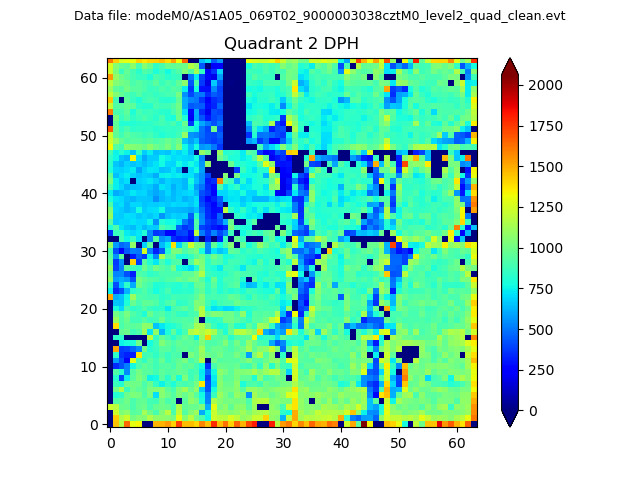
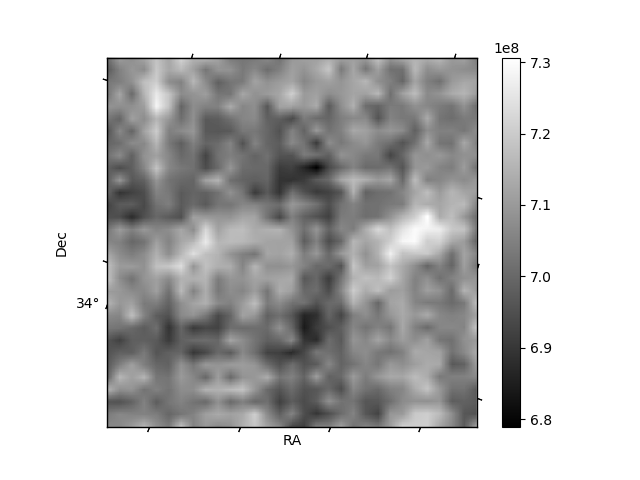
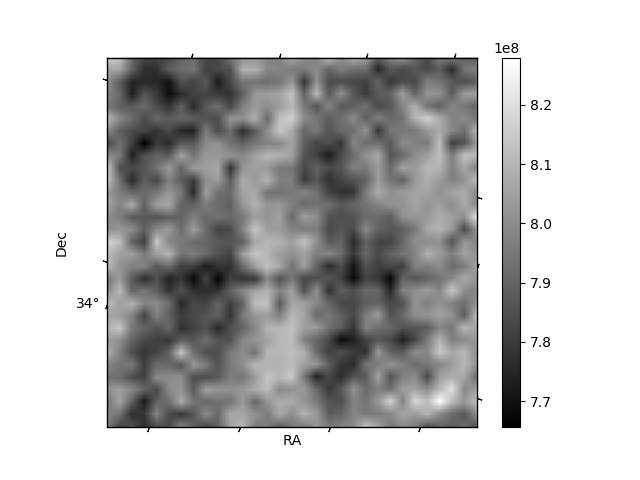
Histogram calculated using DETX and DETY for each event in the final _common_clean file
| Quadrant A | 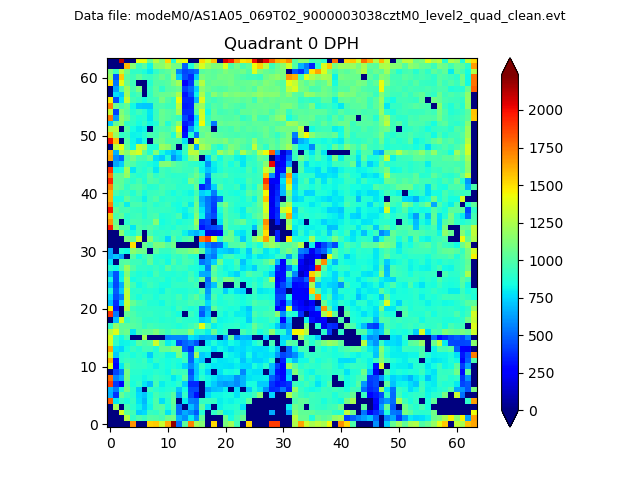 |
 |
Quadrant B |
|---|---|---|---|
| Quadrant D | 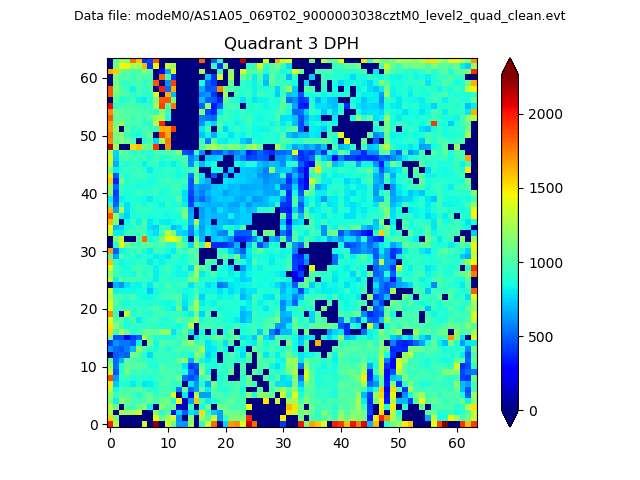 |
 |
Quadrant C |
| Plot type | Count rate plots | Images |
|---|---|---|
| Comparison with Poisson distribution Blue bars denote a histogram of data divided into 1 sec bins. Red curve is a Poisson curve with rate = median count rate of data. |
 |
 |
| Quadrant-wise count rates Data is divided into 100 sec bins |
 |
|
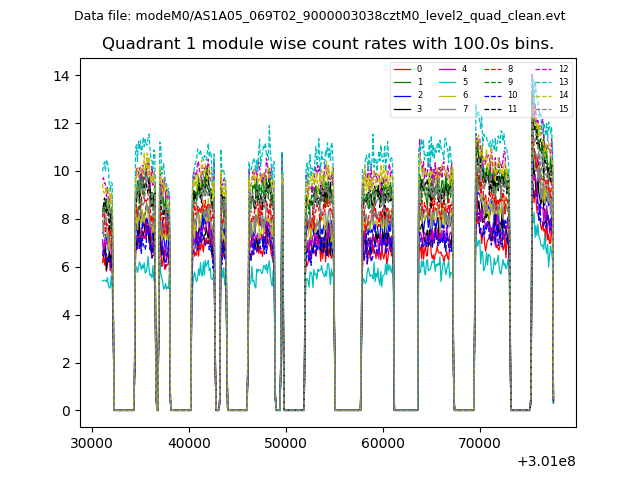
| Module-wise count rates for Quadrant A Data is divided into 100 sec bins |
 |
 |
| Module-wise count rates for Quadrant B Data is divided into 100 sec bins |
 |
 |
| Module-wise count rates for Quadrant C Data is divided into 100 sec bins |
 |
 |
| Module-wise count rates for Quadrant D Data is divided into 100 sec bins |
 |
 |
| Parameter | Plot |
|---|---|
| CZT HV Monitor |  |
| D_VDD | 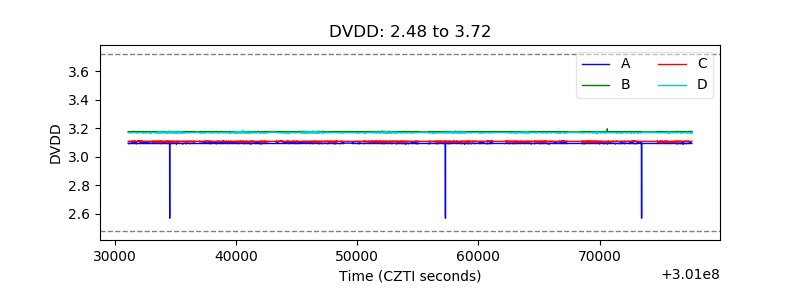 |
| Temperature 1 |  |
| Veto HV Monitor |  |
| Veto LLD | 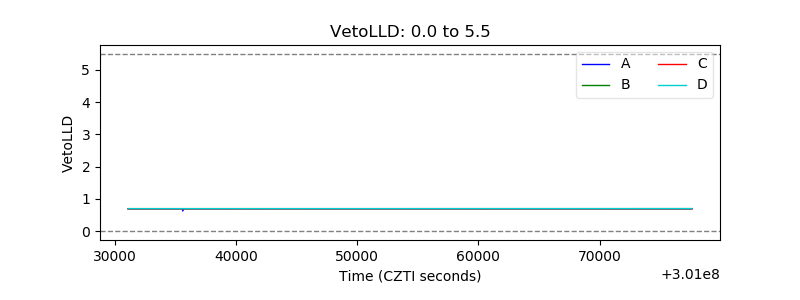 |
| Alpha Counter |  |
| _CPM_Rate | 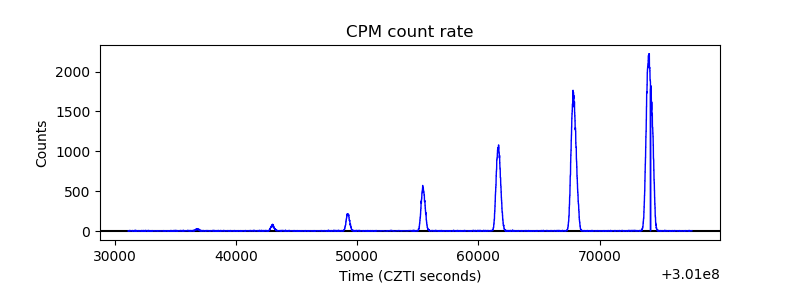 |
| CZT Counter |  |
| +2.5 Volts monitor |  |
| +5 Volts monitor |  |
| _ROLL_ROT | 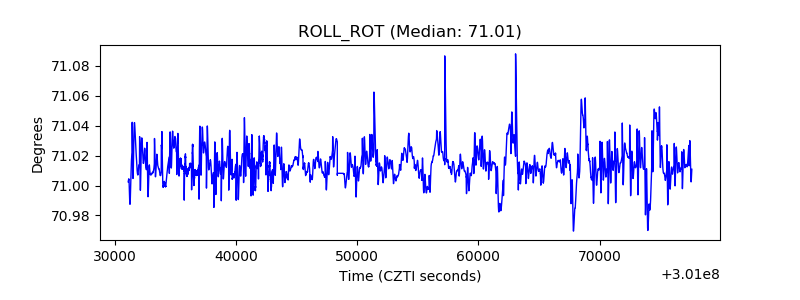 |
| _Roll_DEC | 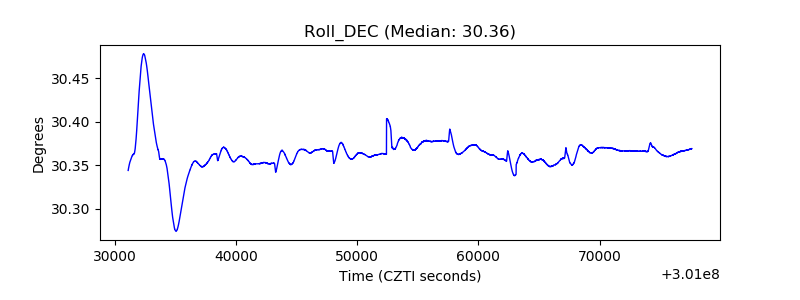 |
| _Roll_RA | 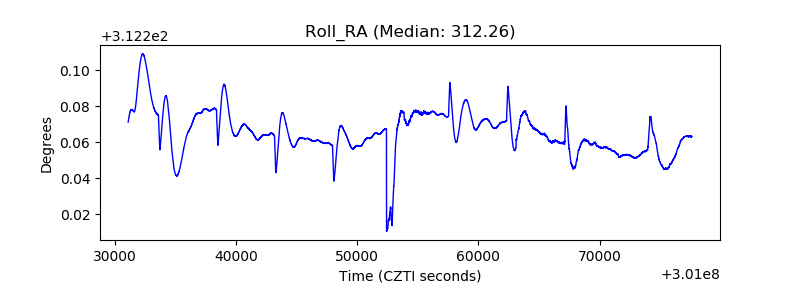 |
| Veto Counter |  |