| Param | Original file | Final file |
|---|---|---|
| Filename | modeM0/AS1A05_069T02_9000003038_20544cztM0_level2.evt | modeM0/AS1A05_069T02_9000003038_20544cztM0_level2_quad_clean.evt |
| Size (bytes) | 68,506,560 | 20,612,160 |
| Size | 65.3 MB | 19.7 MB |
| Events in quadrant A | 477,258 | 135,445 |
| Events in quadrant B | 523,861 | 138,672 |
| Events in quadrant C | 480,947 | 132,871 |
| Events in quadrant D | 512,020 | 130,346 |
| Mode M0 | |||
|---|---|---|---|
| Quadrant | BADHDUFLAG | Total packets | Discarded packets |
| A | 0 | 2284 | 0 |
| B | 0 | 2327 | 0 |
| C | 0 | 2281 | 0 |
| D | 0 | 2431 | 0 |
| Mode SS | |||
|---|---|---|---|
| Quadrant | BADHDUFLAG | Total packets | Discarded packets |
| A | 0 | 22 | 0 |
| B | 0 | 22 | 0 |
| C | 0 | 22 | 0 |
| D | 0 | 22 | 0 |
| Quadrant | Total seconds | Saturated seconds | Saturation percentage |
|---|---|---|---|
| A | 1140 | 0 | 0.000000% |
| B | 1140 | 2 | 0.175439% |
| C | 1140 | 0 | 0.000000% |
| D | 1140 | 4 | 0.350877% |
Noise dominated data is calculated using 1-second bins in cleaned event files. If a bin has >2000 counts, and if more than 50% of those come from <1% of pixels, then it is considered to be noise-dominated and hence unusable.
| Quadrant | # 1 sec bins | Bins with >0 counts | Bins with >2000 counts | High rate bins dominated by noise | Noise dominated (total time) | Noise dominated (detector-on time) | Marked lightcurve |
|---|---|---|---|---|---|---|---|
| A | 1140 | 1140 | 0 | 0 | 0.00% | 0.00% | 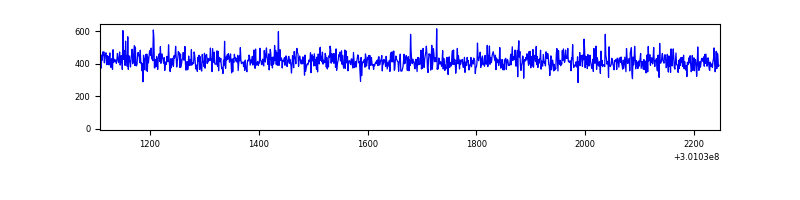 |
| B | 1140 | 1140 | 1 | 1 | 0.09% | 0.09% | 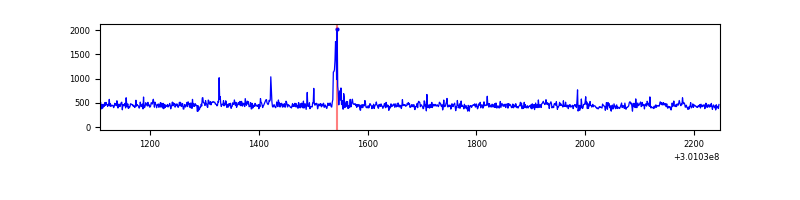 |
| C | 1140 | 1140 | 0 | 0 | 0.00% | 0.00% | 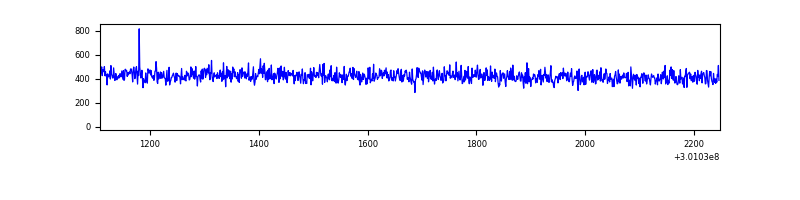 |
| D | 1140 | 1140 | 8 | 8 | 0.70% | 0.70% | 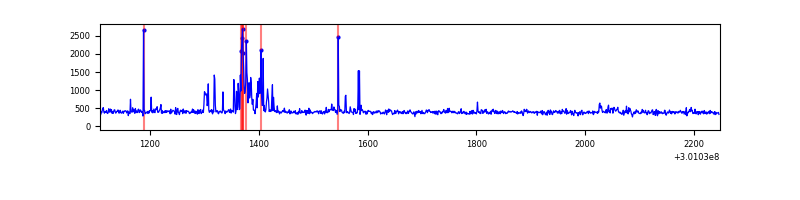 |
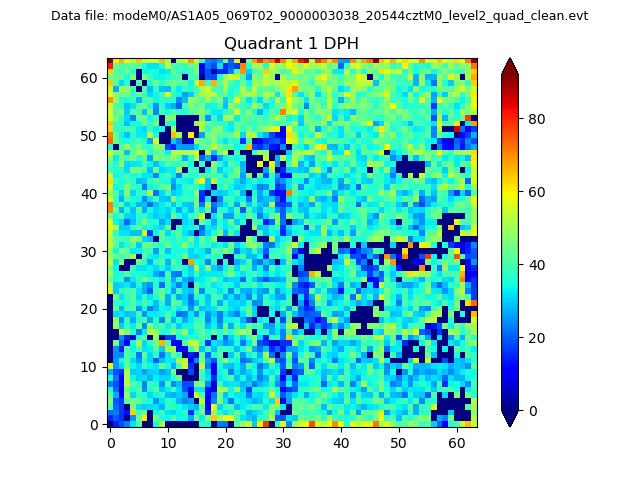
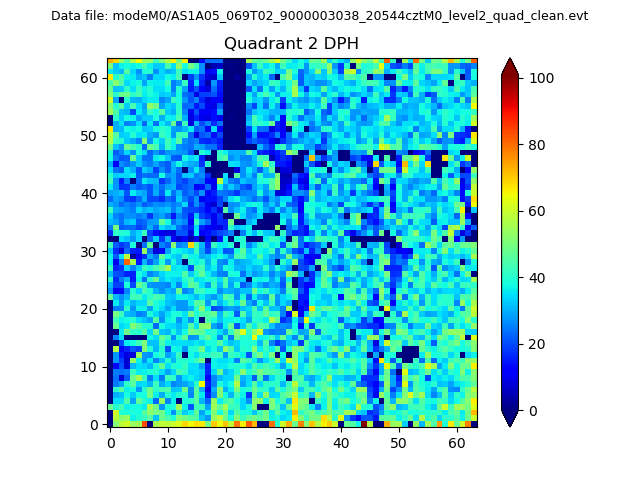
Top three noisy pixels from each quadrant. If the there are fewer than three noisy pixels in the level2.evt file, extra rows are filled as -1
| Pixel properties | Quadrant properties | ||||||
|---|---|---|---|---|---|---|---|
| Quadrant | DetID | PixID | Counts | Sigma | Mean | Median | Sigma |
| A | 8 | 205 | 1259 | 42.14 | 123 | 121 | 27.0 |
| A | 3 | 137 | 1086 | 35.73 | 123 | 121 | 27.0 |
| A | 0 | 226 | 1040 | 34.03 | 123 | 121 | 27.0 |
| B | 0 | 219 | 17673 | 673.86 | 124 | 121 | 26.0 |
| B | 3 | 64 | 11530 | 438.02 | 124 | 121 | 26.0 |
| B | 12 | 111 | 2887 | 106.19 | 124 | 121 | 26.0 |
| C | 14 | 238 | 18084 | 600.56 | 118 | 118 | 29.9 |
| C | 8 | 208 | 2757 | 88.21 | 118 | 118 | 29.9 |
| C | 13 | 61 | 815 | 23.3 | 118 | 118 | 29.9 |
| D | 13 | 153 | 43824 | 1416.81 | 117 | 113 | 30.9 |
| D | 1 | 52 | 9647 | 309.03 | 117 | 113 | 30.9 |
| D | 7 | 238 | 5216 | 165.4 | 117 | 113 | 30.9 |
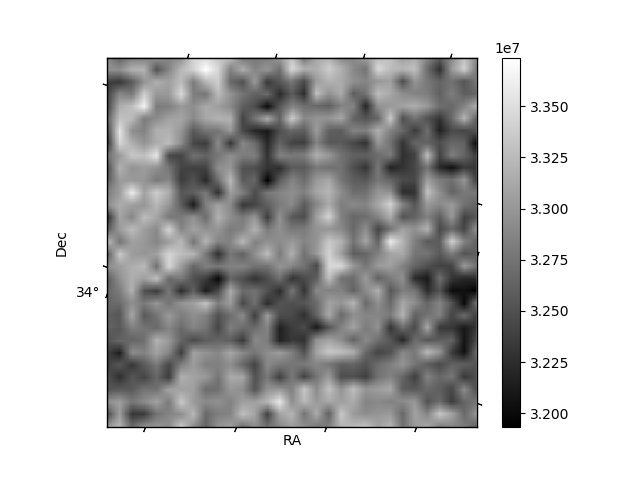
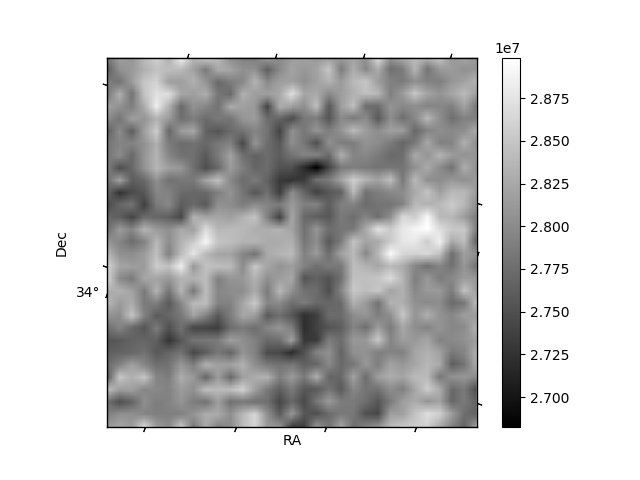
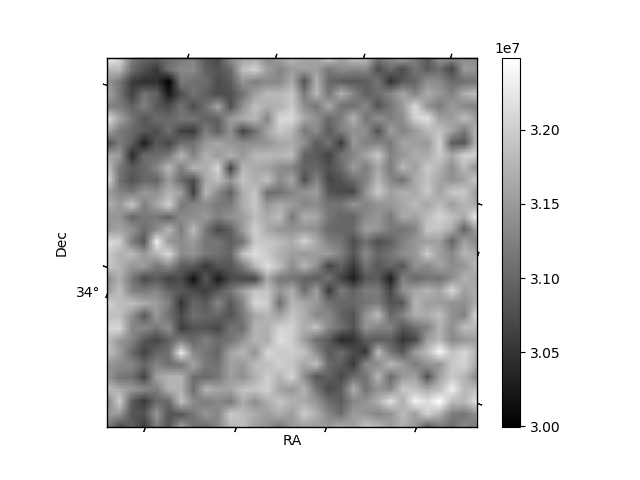
Histogram calculated using DETX and DETY for each event in the final _common_clean file
| Quadrant A | 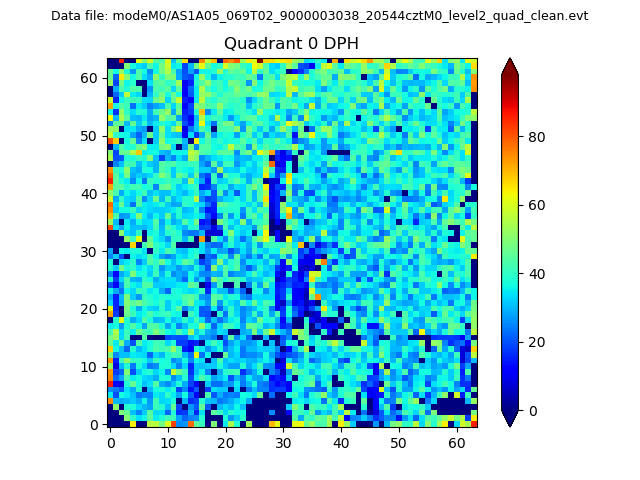 |
 |
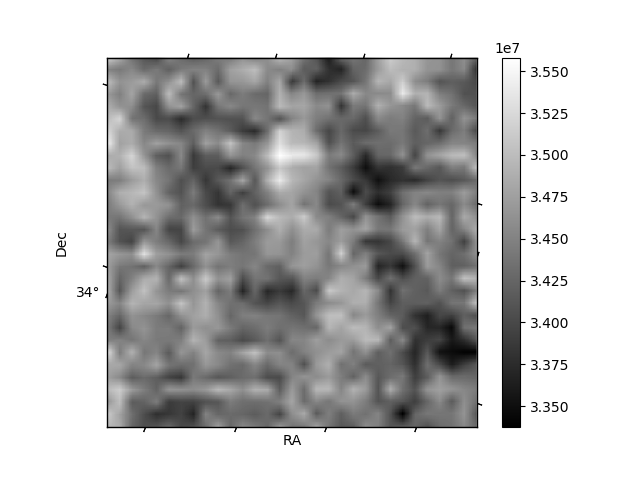
Quadrant B |
|---|---|---|---|
| Quadrant D | 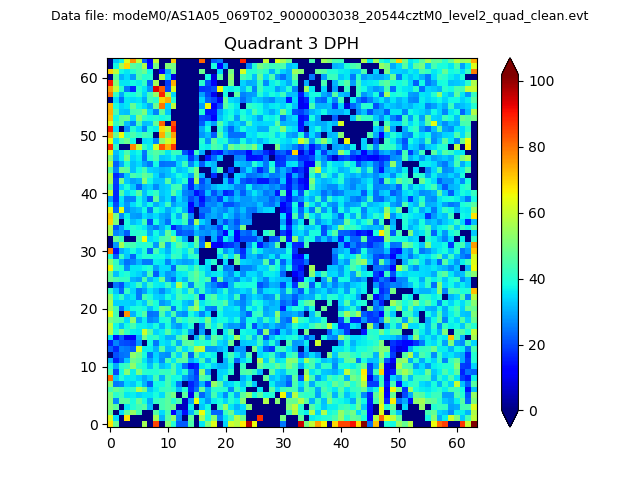 |
 |
Quadrant C |
| Plot type | Count rate plots | Images |
|---|---|---|
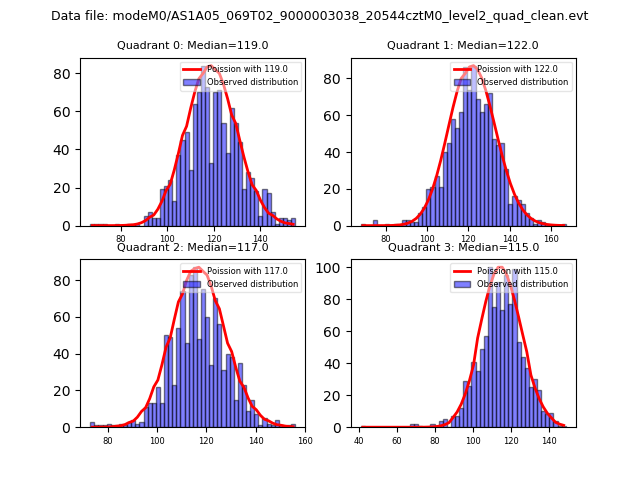
| Comparison with Poisson distribution Blue bars denote a histogram of data divided into 1 sec bins. Red curve is a Poisson curve with rate = median count rate of data. |
 |
 |
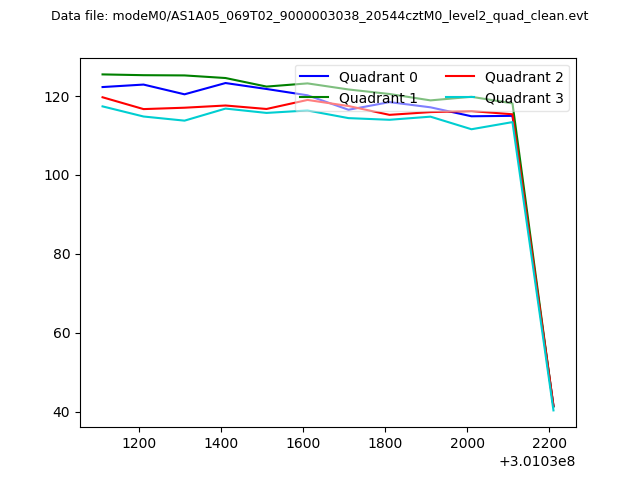
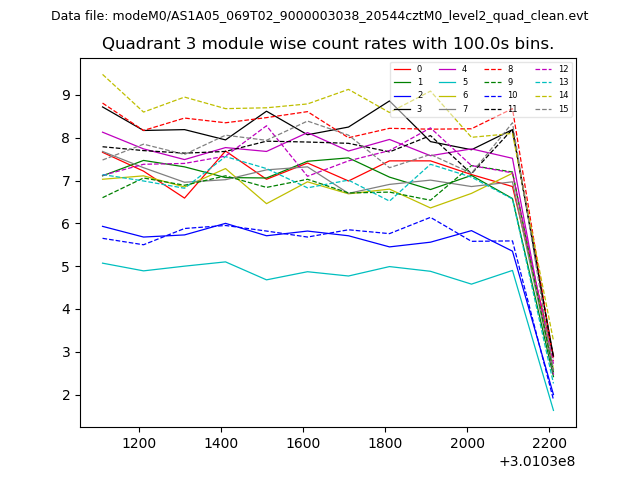
| Quadrant-wise count rates Data is divided into 100 sec bins |
 |
|
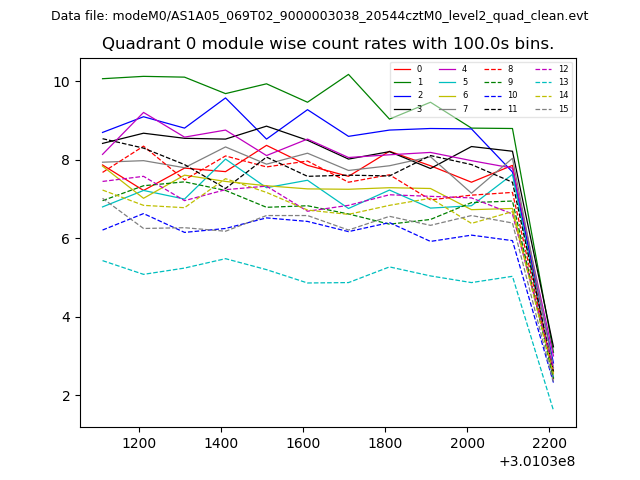
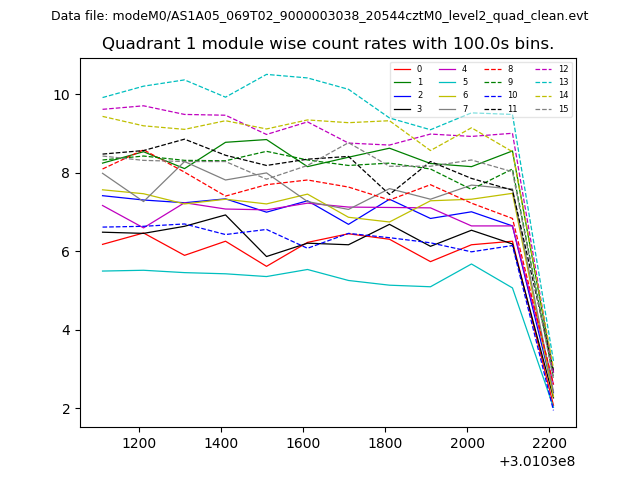
| Module-wise count rates for Quadrant A Data is divided into 100 sec bins |
 |
 |
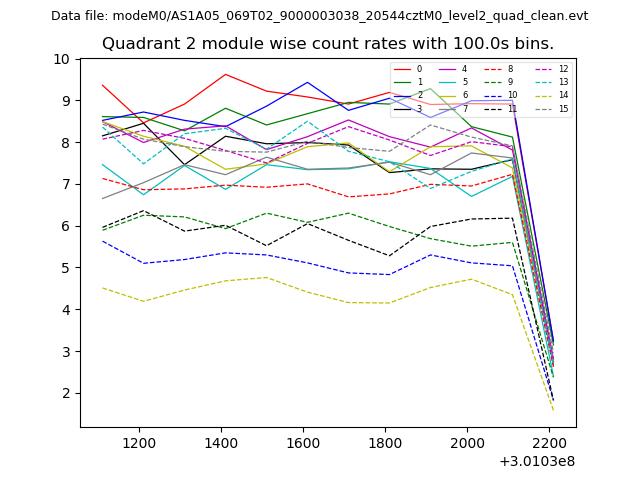
| Module-wise count rates for Quadrant B Data is divided into 100 sec bins |
 |
 |
| Module-wise count rates for Quadrant C Data is divided into 100 sec bins |
 |
 |
| Module-wise count rates for Quadrant D Data is divided into 100 sec bins |
 |
 |
| Parameter | Plot |
|---|---|
| CZT HV Monitor | 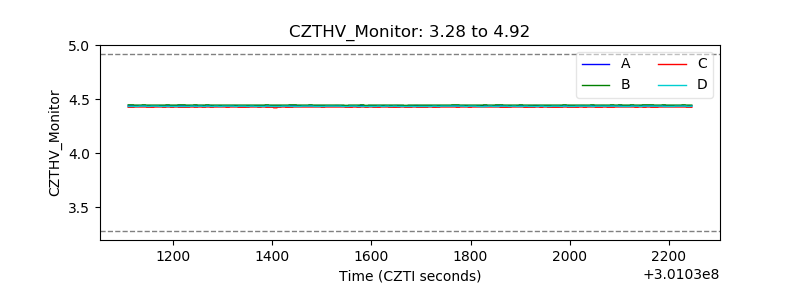 |
| D_VDD | 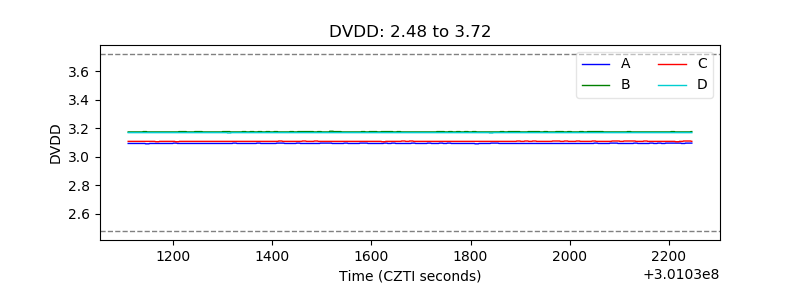 |
| Temperature 1 | 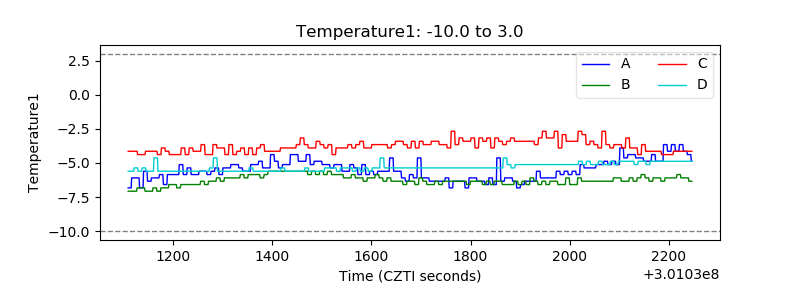 |
| Veto HV Monitor | 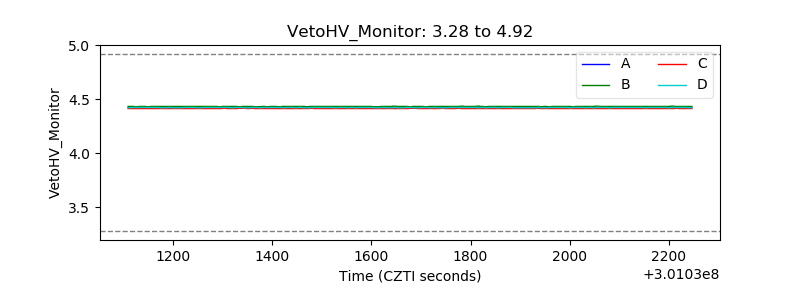 |
| Veto LLD | 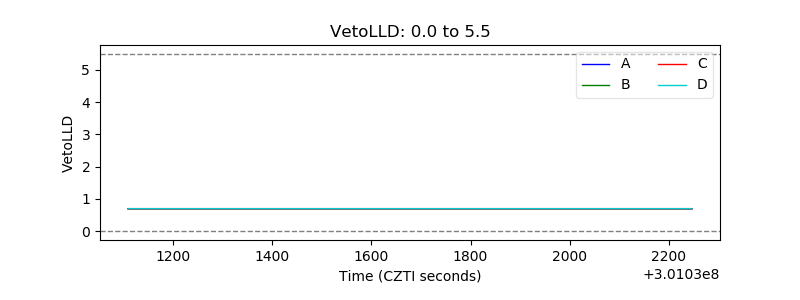 |
| Alpha Counter | 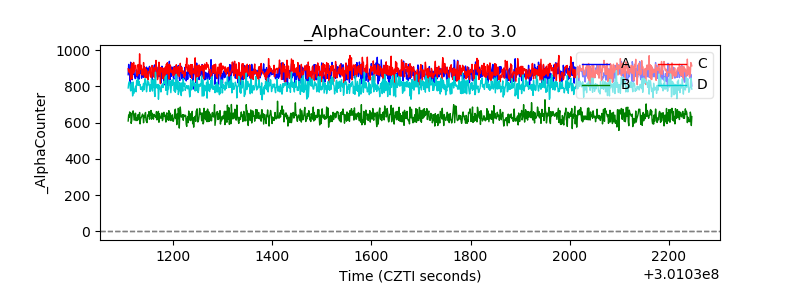 |
| _CPM_Rate | 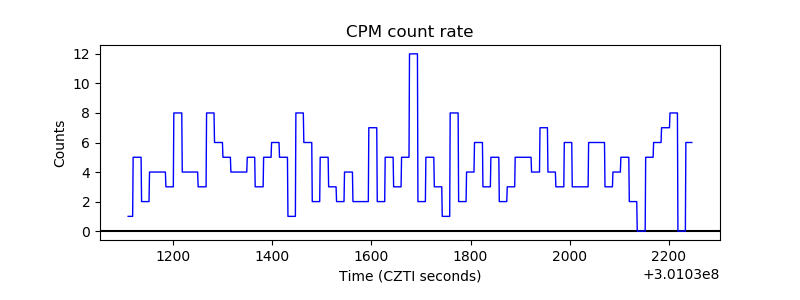 |
| CZT Counter | 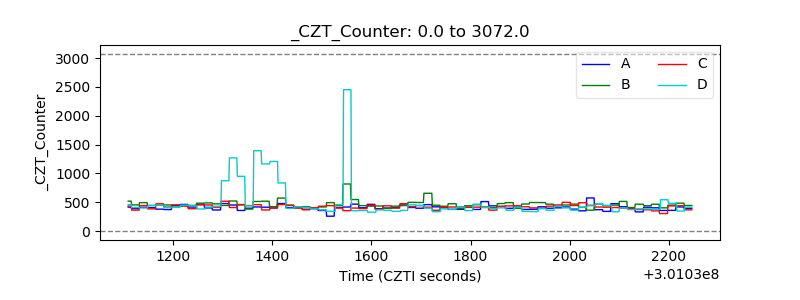 |
| +2.5 Volts monitor |  |
| +5 Volts monitor | 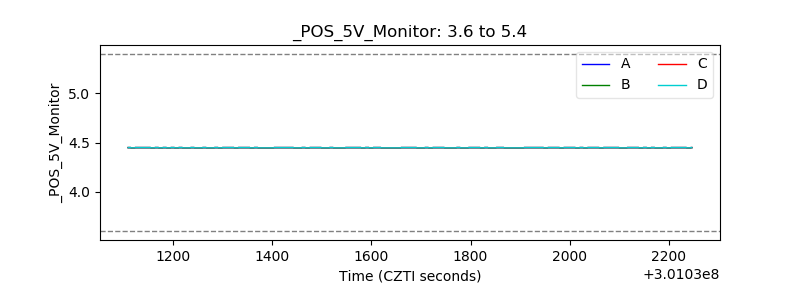 |
| _ROLL_ROT | 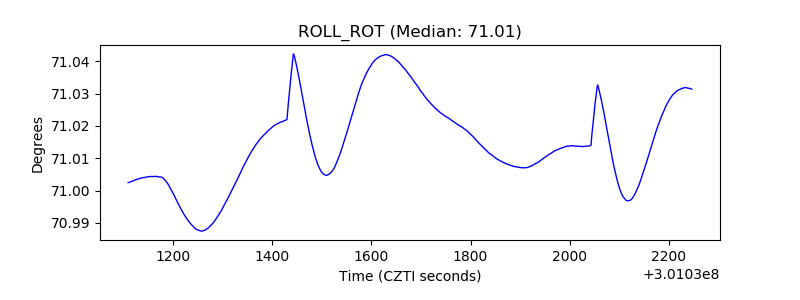 |
| _Roll_DEC | 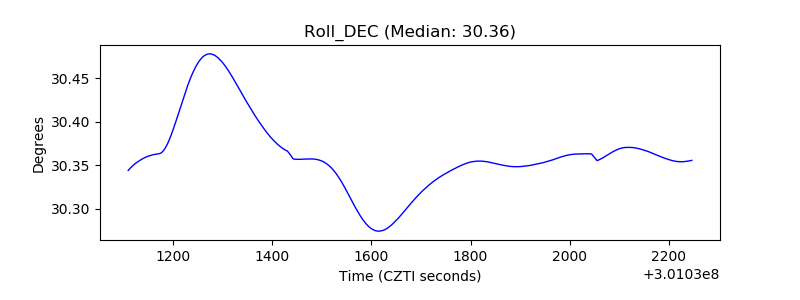 |
| _Roll_RA | 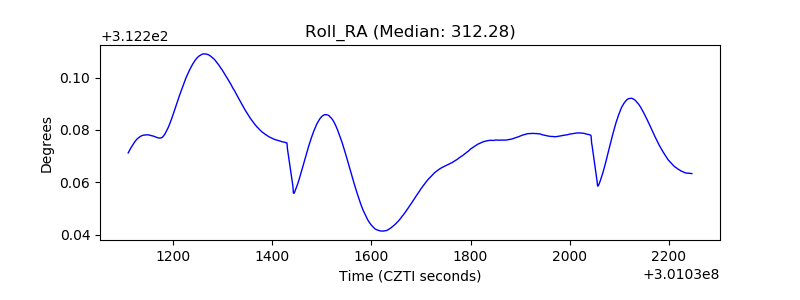 |
| Veto Counter | 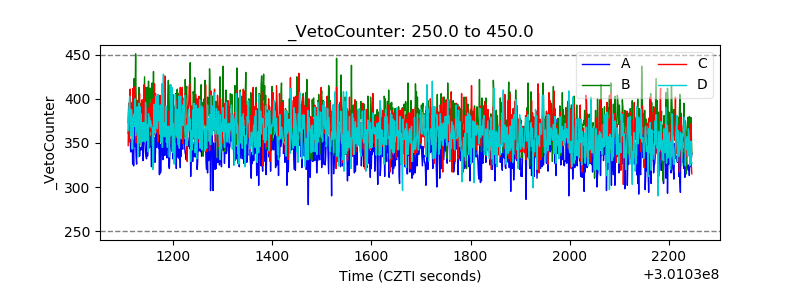 |