| Param | Original file | Final file |
|---|---|---|
| Filename | modeM0/AS1A05_069T02_9000003038_20547cztM0_level2.evt | modeM0/AS1A05_069T02_9000003038_20547cztM0_level2_quad_clean.evt |
| Size (bytes) | 906,419,520 | 158,817,600 |
| Size | 864.4 MB | 151.5 MB |
| Events in quadrant A | 6,322,279 | 989,392 |
| Events in quadrant B | 6,459,898 | 1,009,637 |
| Events in quadrant C | 6,280,232 | 954,272 |
| Events in quadrant D | 7,477,227 | 926,492 |
| Mode M0 | |||
|---|---|---|---|
| Quadrant | BADHDUFLAG | Total packets | Discarded packets |
| A | 0 | 27621 | 3 |
| B | 0 | 27605 | 3 |
| C | 0 | 27425 | 3 |
| D | 0 | 31455 | 3 |
| Mode M9 | |||
|---|---|---|---|
| Quadrant | BADHDUFLAG | Total packets | Discarded packets |
| A | 0 | 15 | 0 |
| B | 0 | 15 | 0 |
| C | 0 | 15 | 0 |
| D | 0 | 15 | 0 |
| Mode SS | |||
|---|---|---|---|
| Quadrant | BADHDUFLAG | Total packets | Discarded packets |
| A | 0 | 276 | 0 |
| B | 0 | 276 | 0 |
| C | 0 | 276 | 0 |
| D | 0 | 276 | 0 |
| Quadrant | Total seconds | Saturated seconds | Saturation percentage |
|---|---|---|---|
| A | 13456 | 158 | 1.174197% |
| B | 13456 | 181 | 1.345125% |
| C | 13456 | 165 | 1.226219% |
| D | 13456 | 337 | 2.504459% |
Noise dominated data is calculated using 1-second bins in cleaned event files. If a bin has >2000 counts, and if more than 50% of those come from <1% of pixels, then it is considered to be noise-dominated and hence unusable.
| Quadrant | # 1 sec bins | Bins with >0 counts | Bins with >2000 counts | High rate bins dominated by noise | Noise dominated (total time) | Noise dominated (detector-on time) | Marked lightcurve |
|---|---|---|---|---|---|---|---|
| A | 15021 | 13459 | 4 | 4 | 0.03% | 0.03% | 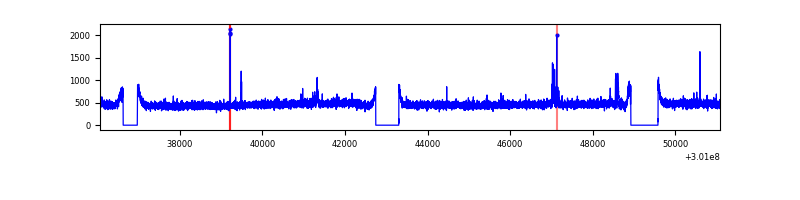 |
| B | 15021 | 13459 | 0 | 0 | 0.00% | 0.00% | 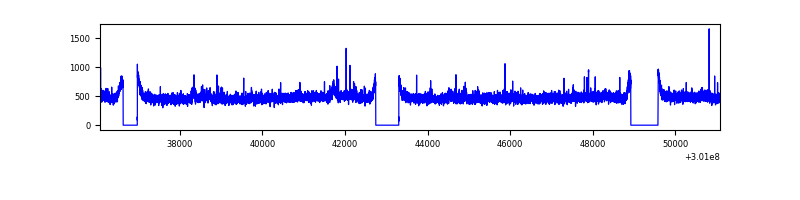 |
| C | 15021 | 13459 | 1 | 1 | 0.01% | 0.01% | 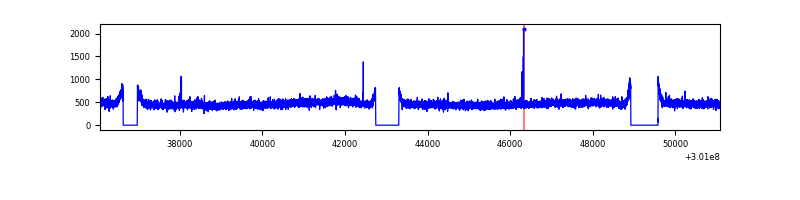 |
| D | 15021 | 13459 | 219 | 219 | 1.46% | 1.63% | 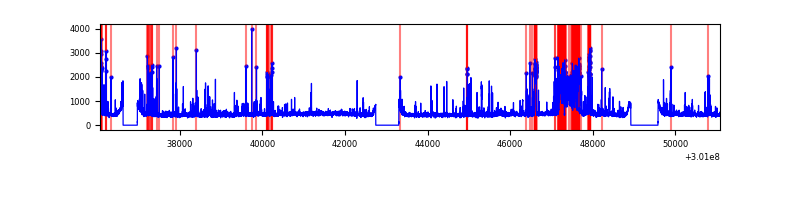 |
Top three noisy pixels from each quadrant. If the there are fewer than three noisy pixels in the level2.evt file, extra rows are filled as -1
| Pixel properties | Quadrant properties | ||||||
|---|---|---|---|---|---|---|---|
| Quadrant | DetID | PixID | Counts | Sigma | Mean | Median | Sigma |
| A | 15 | 174 | 78086 | 233.34 | 1614 | 1578 | 327.9 |
| A | 9 | 143 | 14599 | 39.71 | 1614 | 1578 | 327.9 |
| A | 3 | 137 | 14119 | 38.25 | 1614 | 1578 | 327.9 |
| B | 0 | 230 | 69063 | 216.37 | 1611 | 1569 | 311.9 |
| B | 12 | 111 | 39538 | 121.72 | 1611 | 1569 | 311.9 |
| B | 11 | 111 | 34323 | 105.0 | 1611 | 1569 | 311.9 |
| C | 14 | 238 | 239762 | 654.05 | 1543 | 1548 | 364.2 |
| C | 8 | 208 | 24162 | 62.09 | 1543 | 1548 | 364.2 |
| C | 13 | 61 | 10525 | 24.65 | 1543 | 1548 | 364.2 |
| D | 2 | 165 | 806506 | 2109.65 | 1558 | 1510 | 381.6 |
| D | 1 | 52 | 641476 | 1677.16 | 1558 | 1510 | 381.6 |
| D | 13 | 153 | 69443 | 178.03 | 1558 | 1510 | 381.6 |
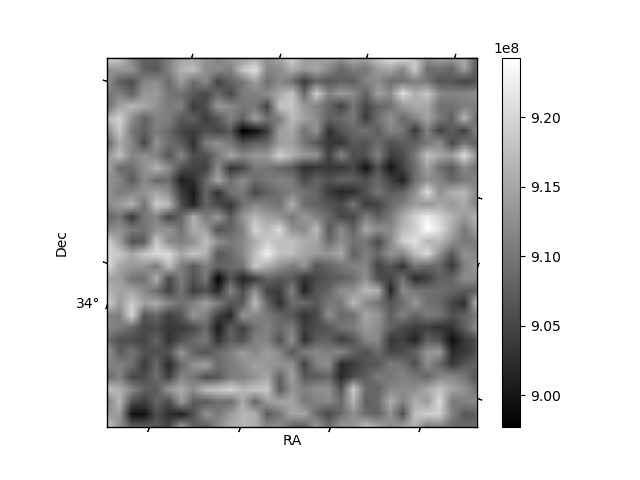
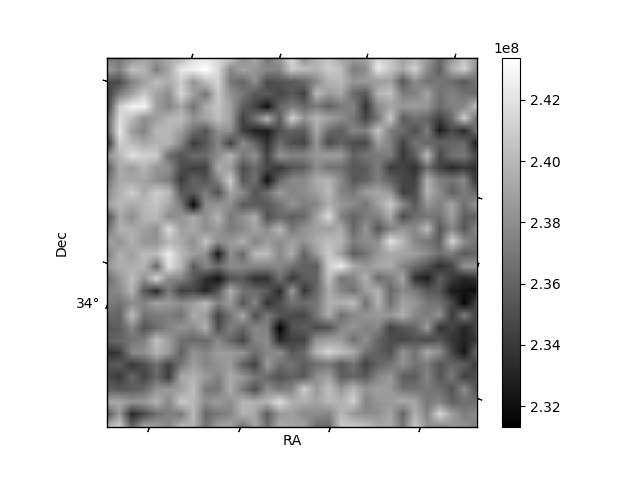
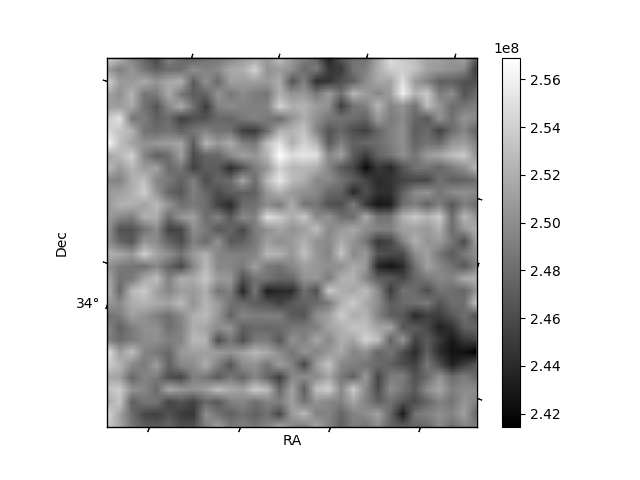
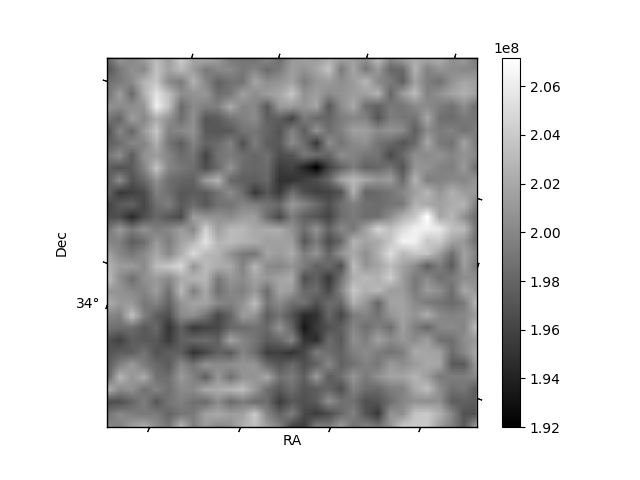
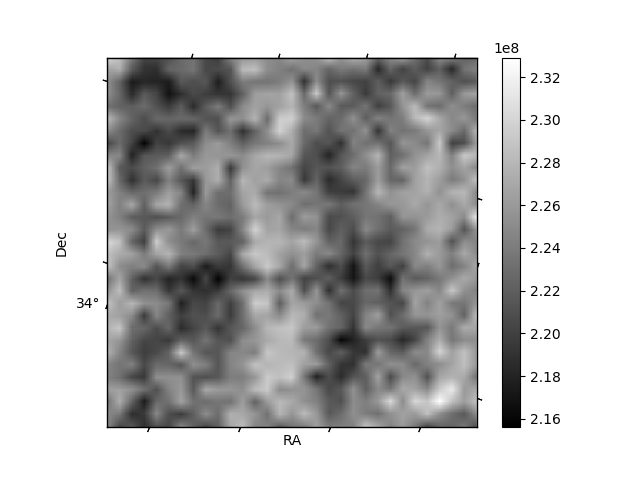
Histogram calculated using DETX and DETY for each event in the final _common_clean file
| Quadrant A | 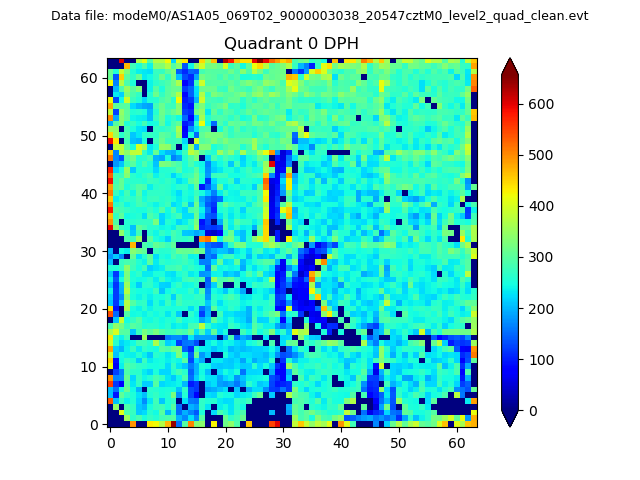 |
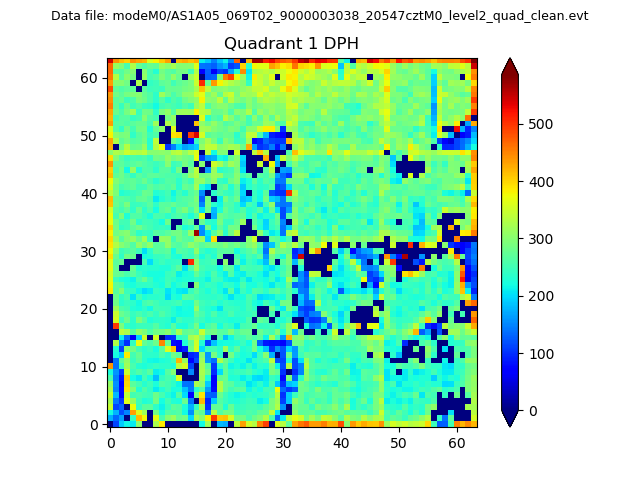 |
Quadrant B |
|---|---|---|---|
| Quadrant D | 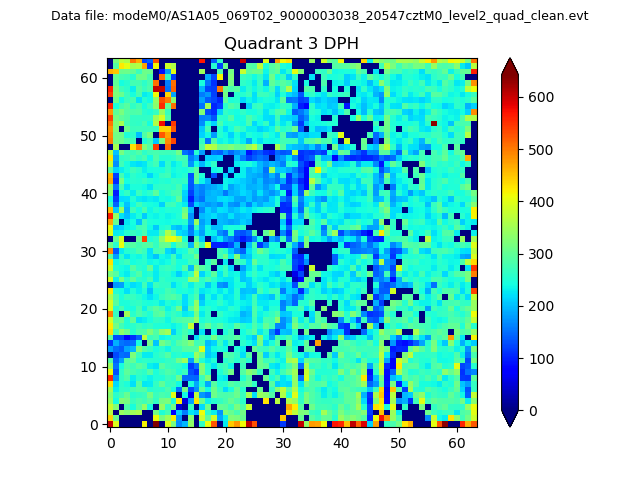 |
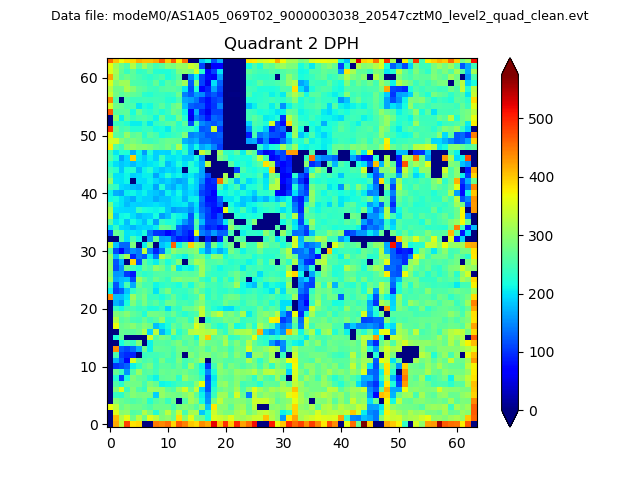 |
Quadrant C |
| Plot type | Count rate plots | Images |
|---|---|---|
| Comparison with Poisson distribution Blue bars denote a histogram of data divided into 1 sec bins. Red curve is a Poisson curve with rate = median count rate of data. |
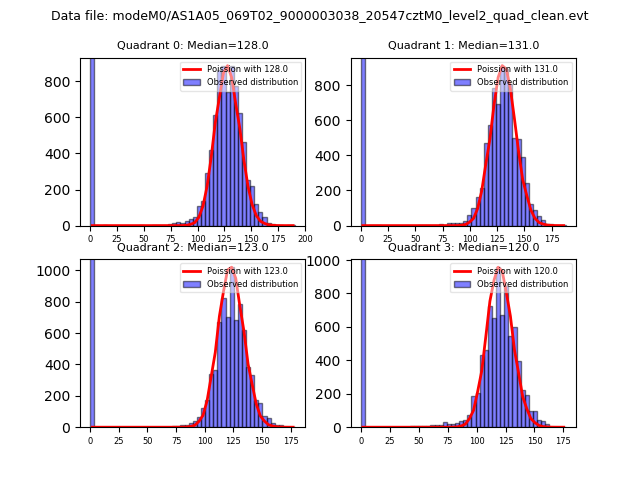 |
 |
| Quadrant-wise count rates Data is divided into 100 sec bins |
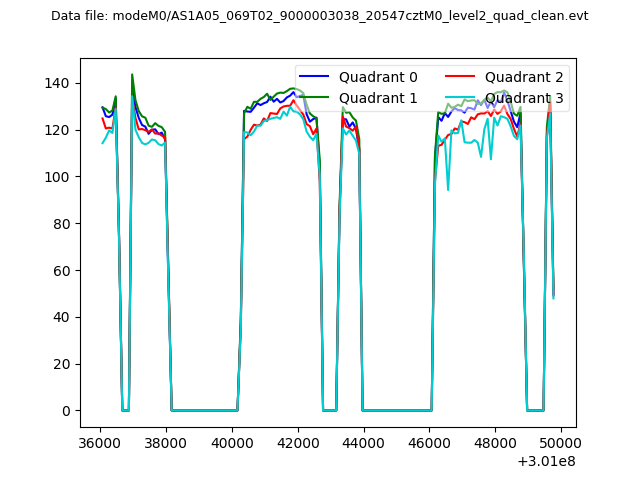 |
|
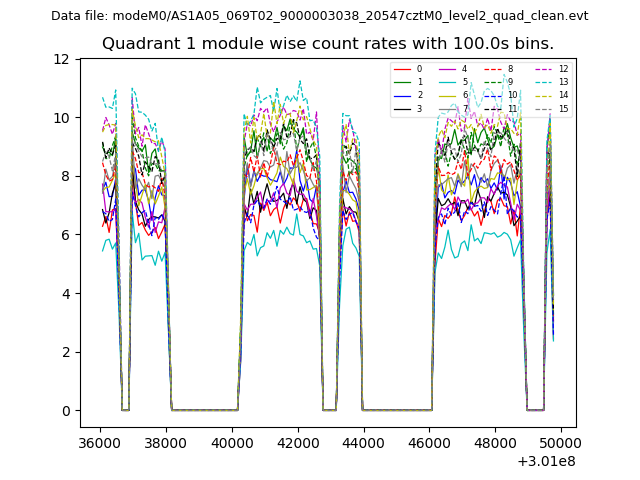
| Module-wise count rates for Quadrant A Data is divided into 100 sec bins |
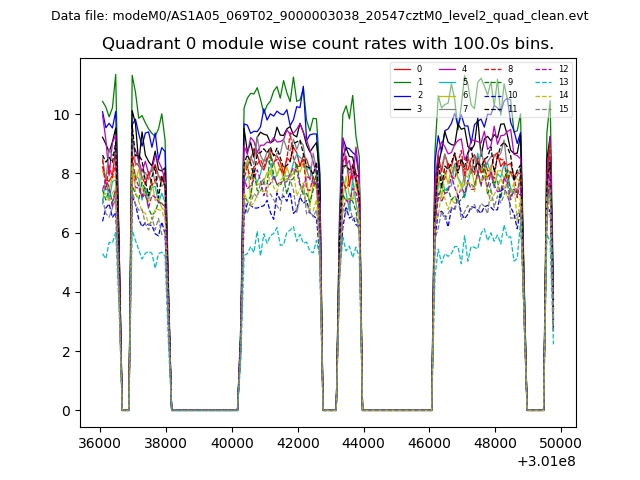 |
 |
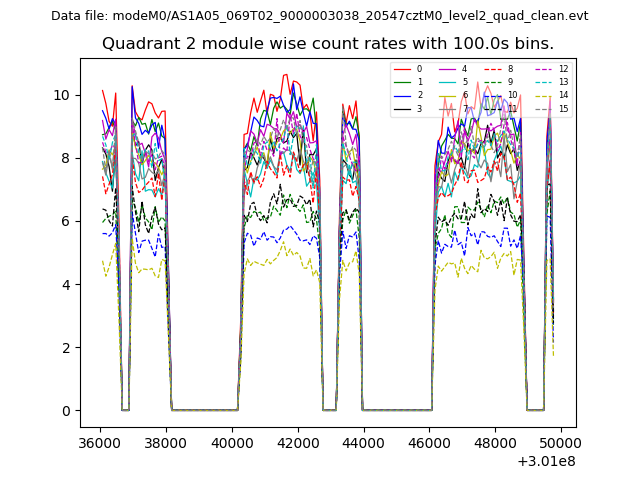
| Module-wise count rates for Quadrant B Data is divided into 100 sec bins |
 |
 |
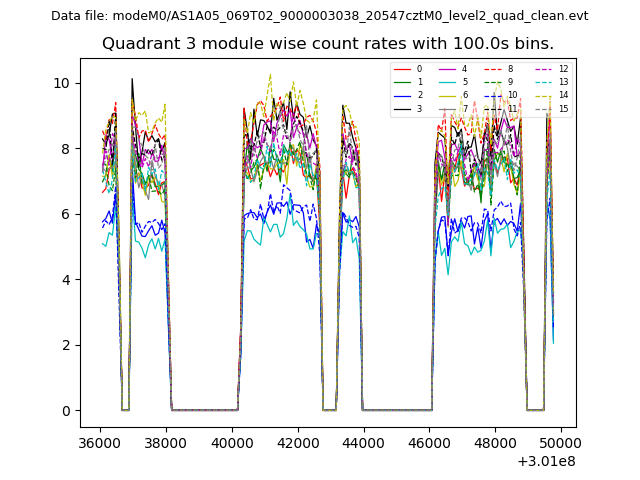
| Module-wise count rates for Quadrant C Data is divided into 100 sec bins |
 |
 |
| Module-wise count rates for Quadrant D Data is divided into 100 sec bins |
 |
 |
| Parameter | Plot |
|---|---|
| CZT HV Monitor | 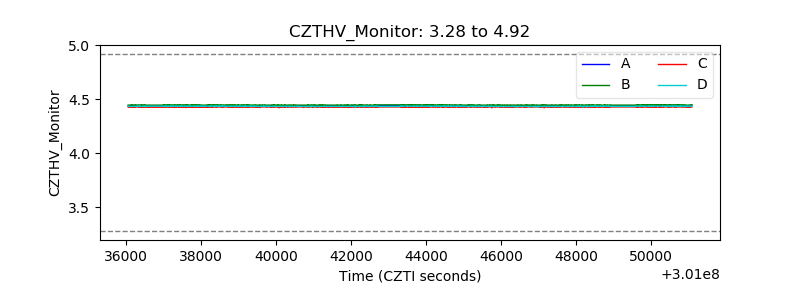 |
| D_VDD | 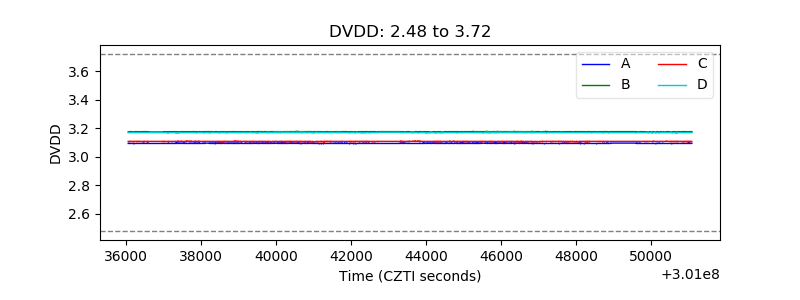 |
| Temperature 1 | 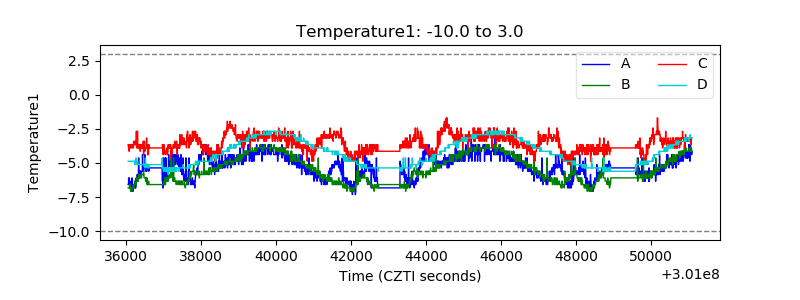 |
| Veto HV Monitor |  |
| Veto LLD | 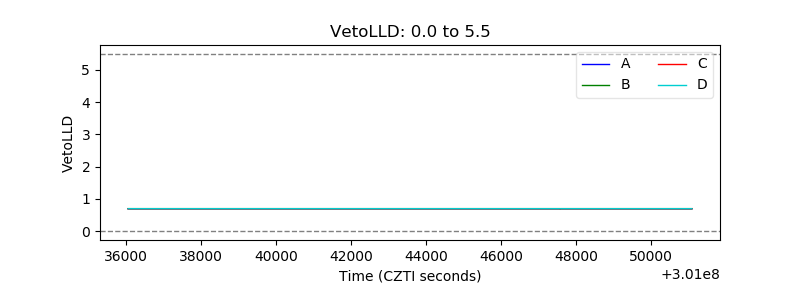 |
| Alpha Counter | 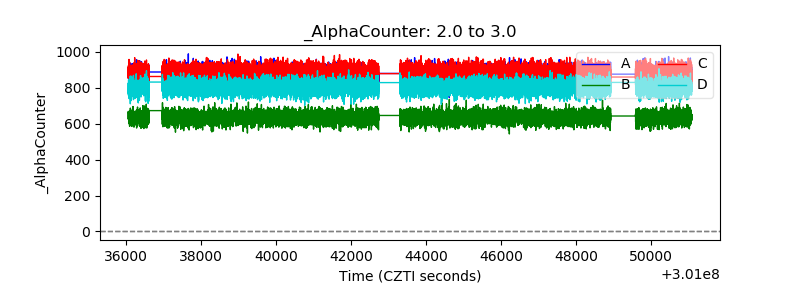 |
| _CPM_Rate | 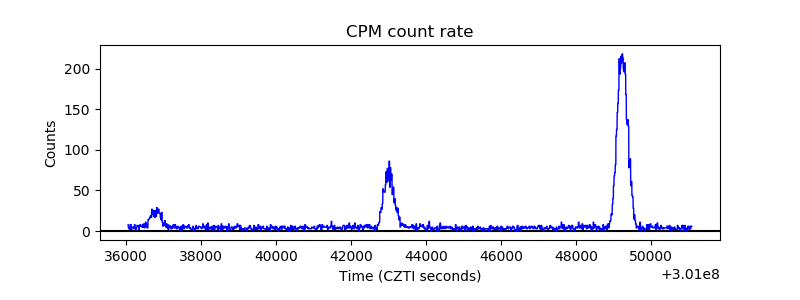 |
| CZT Counter | 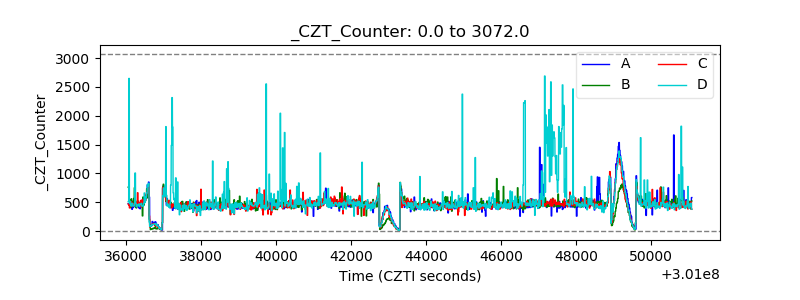 |
| +2.5 Volts monitor |  |
| +5 Volts monitor |  |
| _ROLL_ROT | 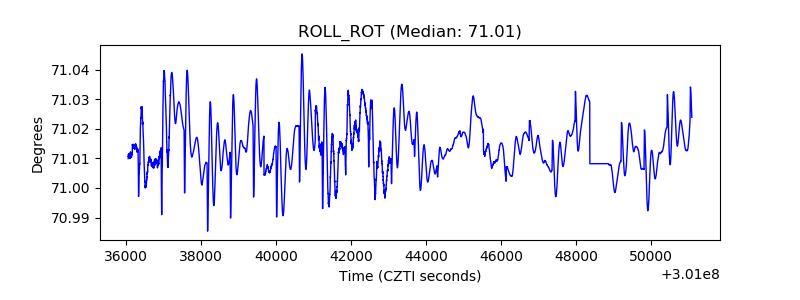 |
| _Roll_DEC | 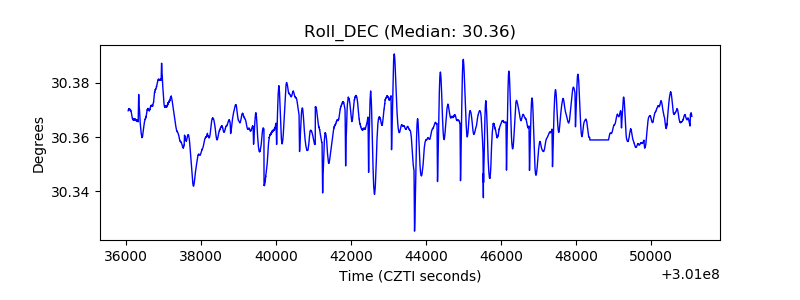 |
| _Roll_RA | 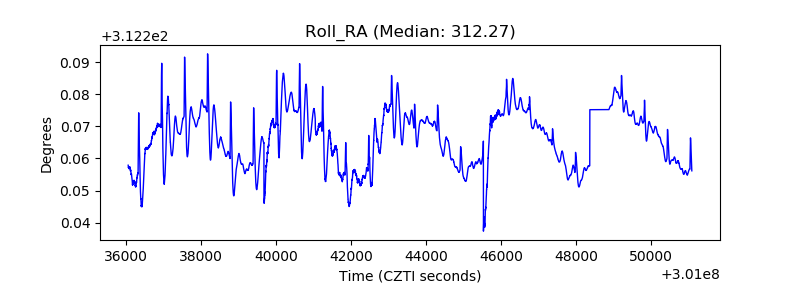 |
| Veto Counter | 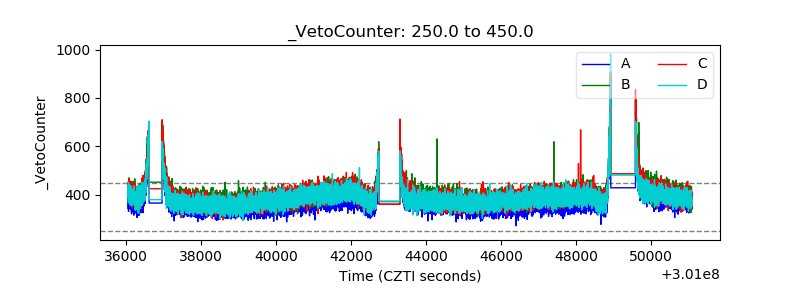 |