| Param | Original file | Final file |
|---|---|---|
| Filename | modeM0/AS1A05_069T02_9000003038_20548cztM0_level2.evt | modeM0/AS1A05_069T02_9000003038_20548cztM0_level2_quad_clean.evt |
| Size (bytes) | 471,447,360 | 69,819,840 |
| Size | 449.6 MB | 66.6 MB |
| Events in quadrant A | 3,490,663 | 415,657 |
| Events in quadrant B | 3,368,416 | 425,228 |
| Events in quadrant C | 3,347,061 | 397,845 |
| Events in quadrant D | 3,601,834 | 393,792 |
| Mode M0 | |||
|---|---|---|---|
| Quadrant | BADHDUFLAG | Total packets | Discarded packets |
| A | 0 | 14678 | 2 |
| B | 0 | 14234 | 2 |
| C | 0 | 14281 | 2 |
| D | 0 | 15284 | 2 |
| Mode M9 | |||
|---|---|---|---|
| Quadrant | BADHDUFLAG | Total packets | Discarded packets |
| A | 0 | 10 | 0 |
| B | 0 | 11 | 0 |
| C | 0 | 11 | 0 |
| D | 0 | 11 | 0 |
| Mode SS | |||
|---|---|---|---|
| Quadrant | BADHDUFLAG | Total packets | Discarded packets |
| A | 0 | 142 | 0 |
| B | 0 | 142 | 0 |
| C | 0 | 142 | 0 |
| D | 0 | 142 | 0 |
| Quadrant | Total seconds | Saturated seconds | Saturation percentage |
|---|---|---|---|
| A | 6904 | 120 | 1.738123% |
| B | 6904 | 112 | 1.622248% |
| C | 6904 | 126 | 1.825029% |
| D | 6903 | 115 | 1.665942% |
Noise dominated data is calculated using 1-second bins in cleaned event files. If a bin has >2000 counts, and if more than 50% of those come from <1% of pixels, then it is considered to be noise-dominated and hence unusable.
| Quadrant | # 1 sec bins | Bins with >0 counts | Bins with >2000 counts | High rate bins dominated by noise | Noise dominated (total time) | Noise dominated (detector-on time) | Marked lightcurve |
|---|---|---|---|---|---|---|---|
| A | 7709 | 6905 | 2 | 2 | 0.03% | 0.03% | 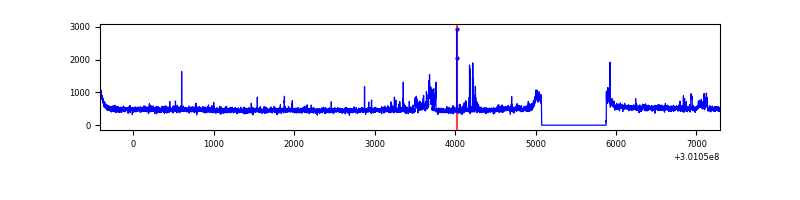 |
| B | 7709 | 6905 | 0 | 0 | 0.00% | 0.00% | 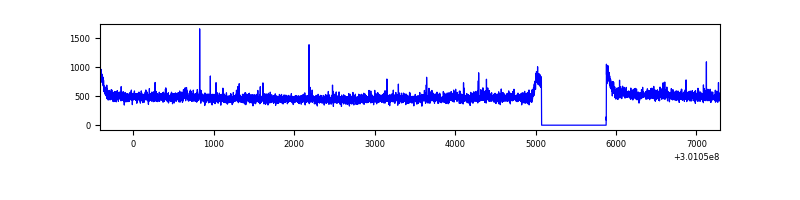 |
| C | 7709 | 6905 | 2 | 2 | 0.03% | 0.03% | 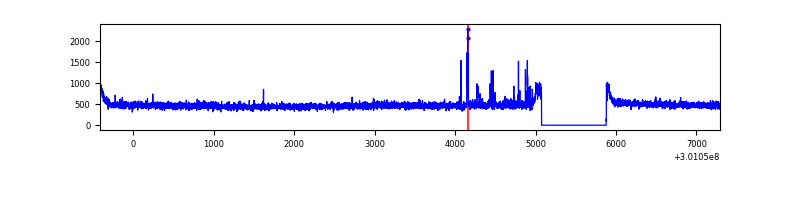 |
| D | 7708 | 6904 | 35 | 35 | 0.45% | 0.51% | 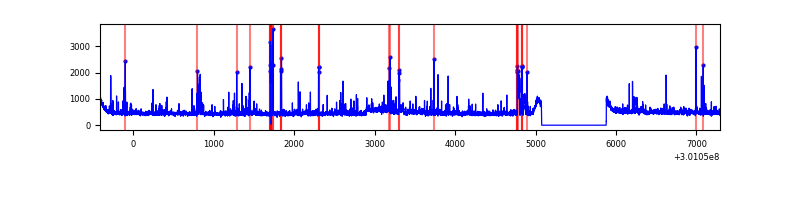 |
Top three noisy pixels from each quadrant. If the there are fewer than three noisy pixels in the level2.evt file, extra rows are filled as -1
| Pixel properties | Quadrant properties | ||||||
|---|---|---|---|---|---|---|---|
| Quadrant | DetID | PixID | Counts | Sigma | Mean | Median | Sigma |
| A | 15 | 174 | 169478 | 966.84 | 856 | 837 | 174.4 |
| A | 14 | 111 | 17491 | 95.48 | 856 | 837 | 174.4 |
| A | 8 | 205 | 7752 | 39.64 | 856 | 837 | 174.4 |
| B | 12 | 111 | 21112 | 122.5 | 850 | 828 | 165.6 |
| B | 11 | 111 | 18469 | 106.54 | 850 | 828 | 165.6 |
| B | 14 | 111 | 16469 | 94.46 | 850 | 828 | 165.6 |
| C | 14 | 238 | 127196 | 657.31 | 811 | 814 | 192.3 |
| C | 8 | 208 | 59841 | 307.0 | 811 | 814 | 192.3 |
| C | 13 | 61 | 5640 | 25.1 | 811 | 814 | 192.3 |
| D | 1 | 52 | 263413 | 1297.39 | 825 | 798 | 202.4 |
| D | 7 | 238 | 99215 | 486.21 | 825 | 798 | 202.4 |
| D | 2 | 184 | 50031 | 243.23 | 825 | 798 | 202.4 |
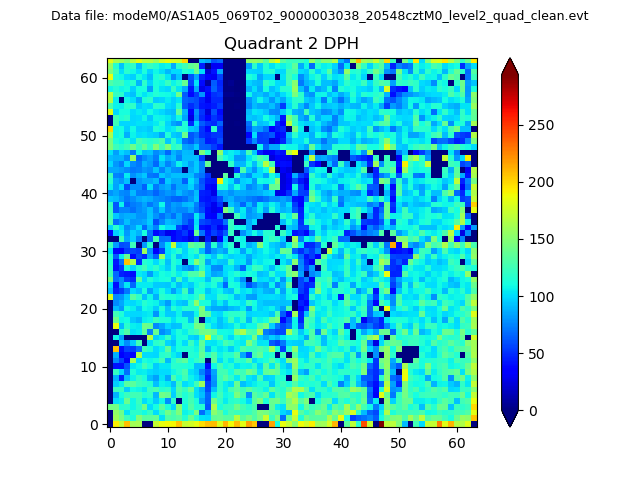
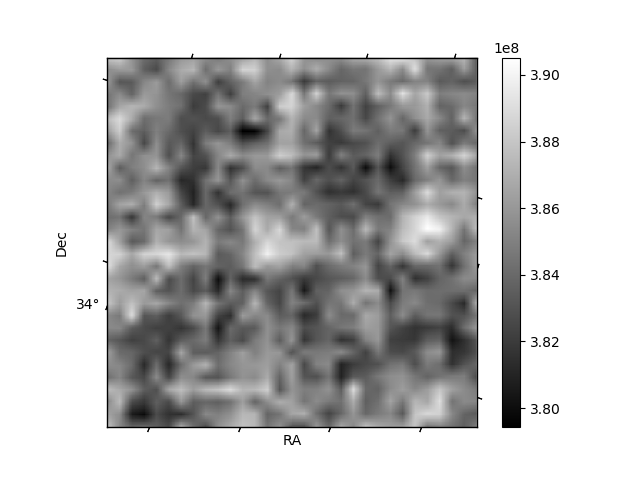
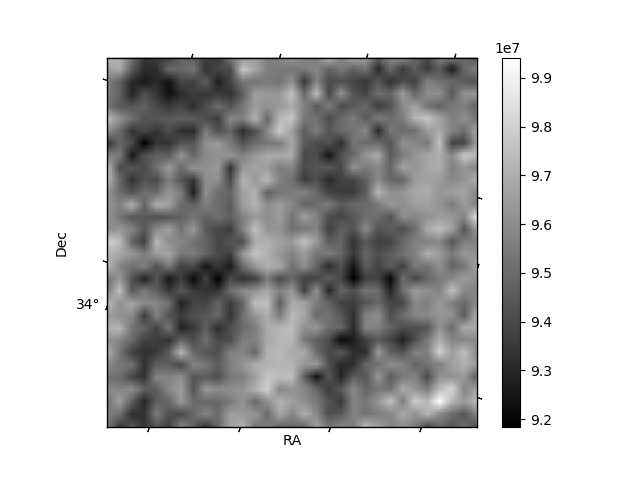
Histogram calculated using DETX and DETY for each event in the final _common_clean file
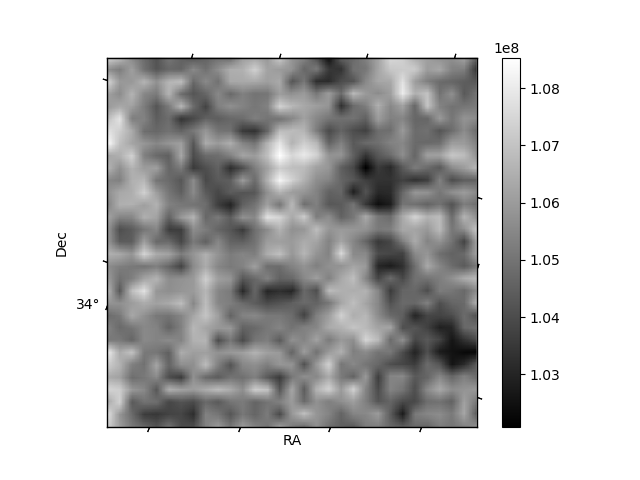
| Quadrant A | 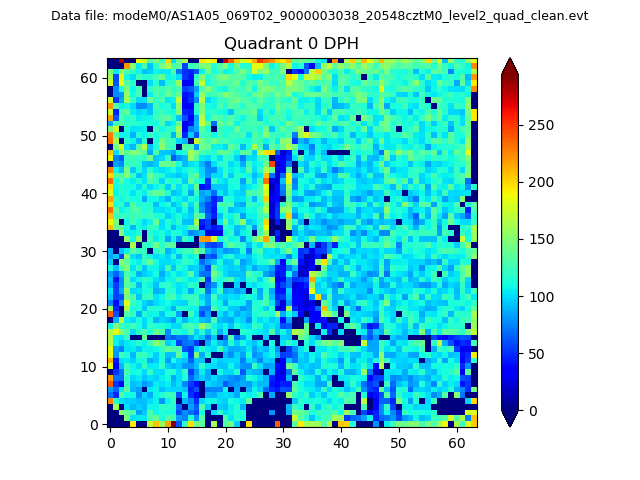 |
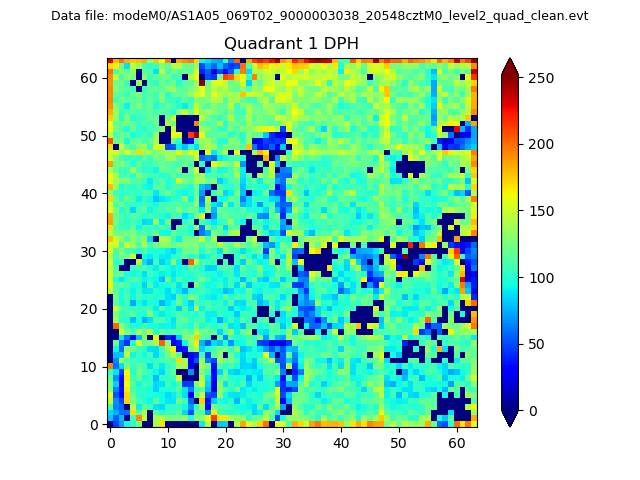 |
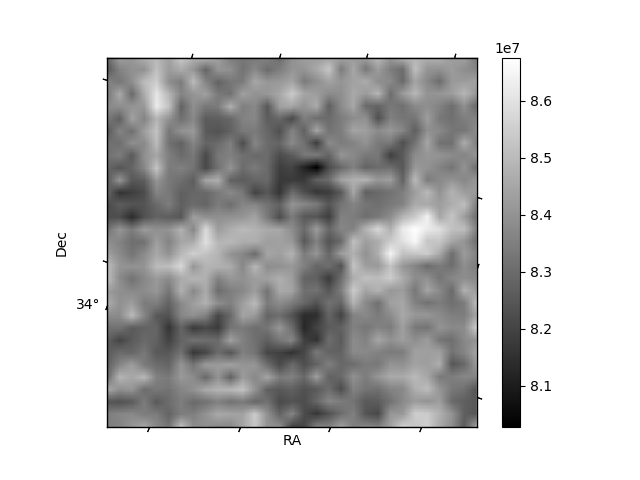
Quadrant B |
|---|---|---|---|
| Quadrant D | 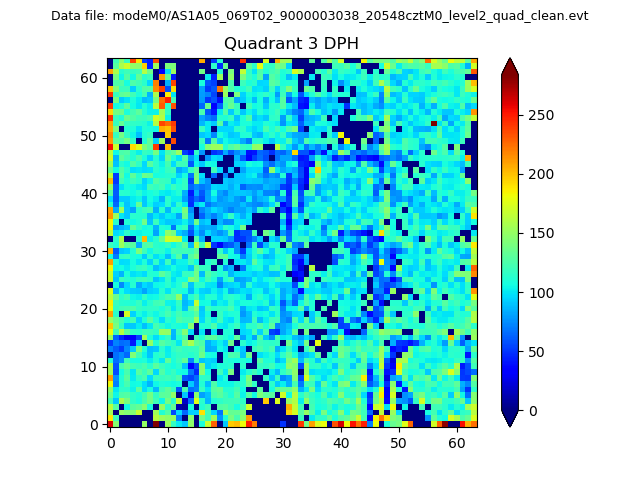 |
 |
Quadrant C |
| Plot type | Count rate plots | Images |
|---|---|---|
| Comparison with Poisson distribution Blue bars denote a histogram of data divided into 1 sec bins. Red curve is a Poisson curve with rate = median count rate of data. |
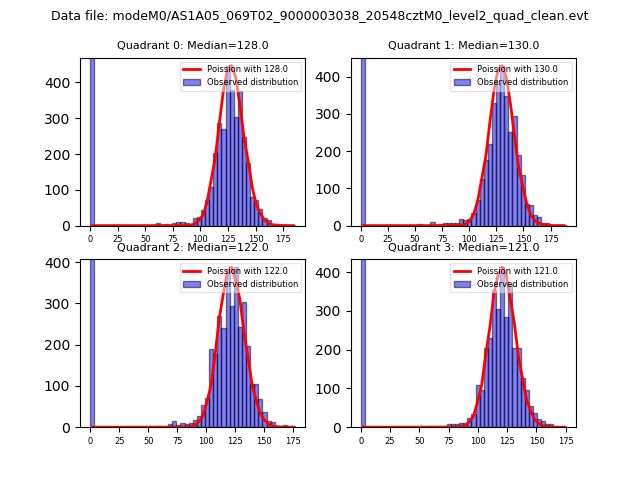 |
 |
| Quadrant-wise count rates Data is divided into 100 sec bins |
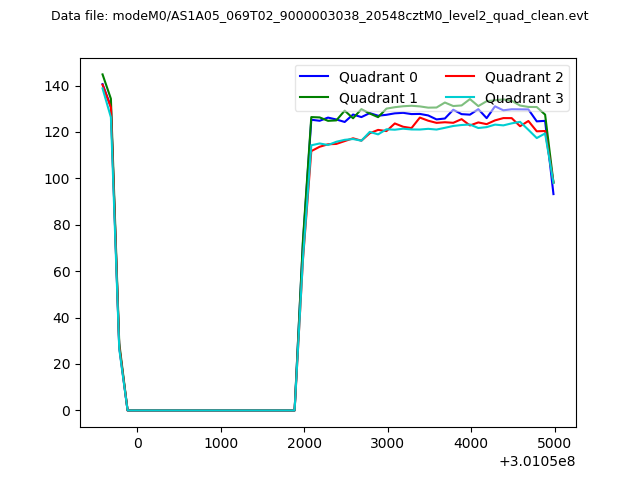 |
|
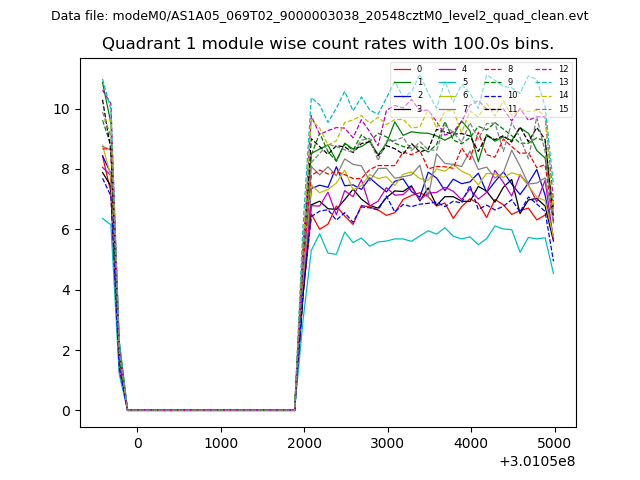
| Module-wise count rates for Quadrant A Data is divided into 100 sec bins |
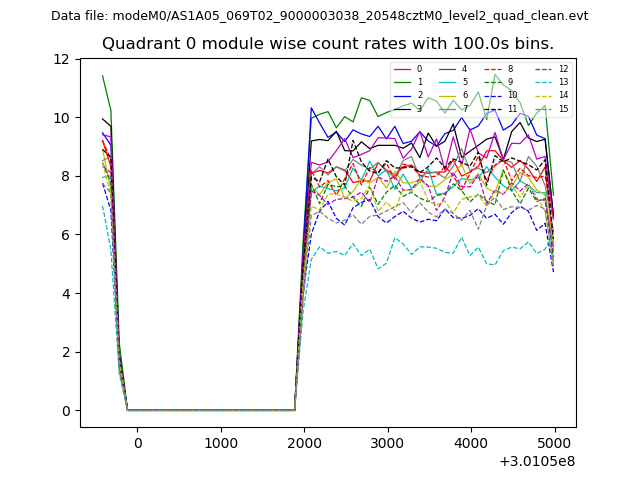 |
 |
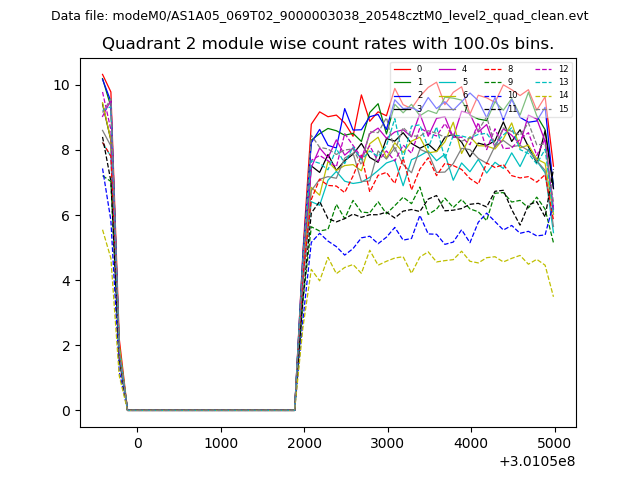
| Module-wise count rates for Quadrant B Data is divided into 100 sec bins |
 |
 |
| Module-wise count rates for Quadrant C Data is divided into 100 sec bins |
 |
 |
| Module-wise count rates for Quadrant D Data is divided into 100 sec bins |
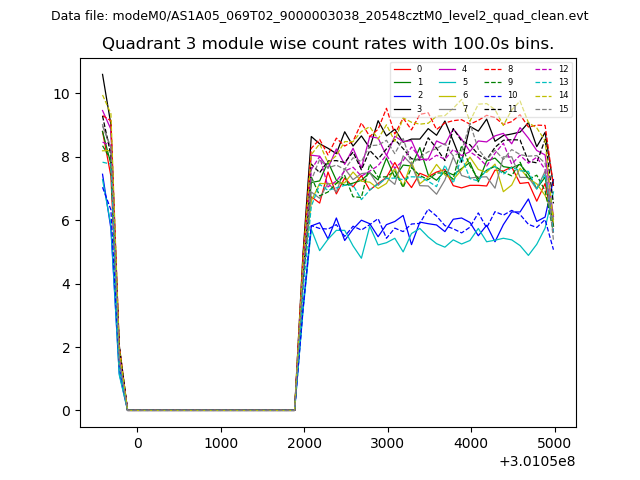 |
 |
| Parameter | Plot |
|---|---|
| CZT HV Monitor | 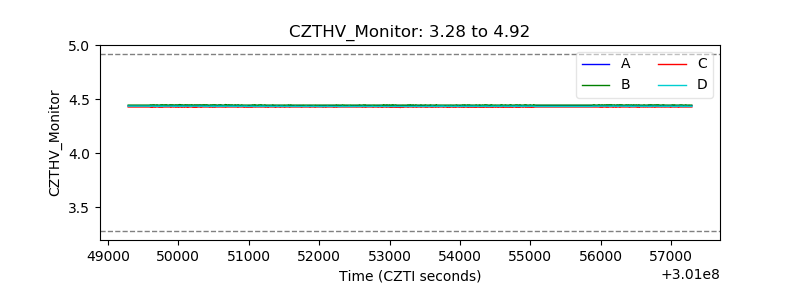 |
| D_VDD | 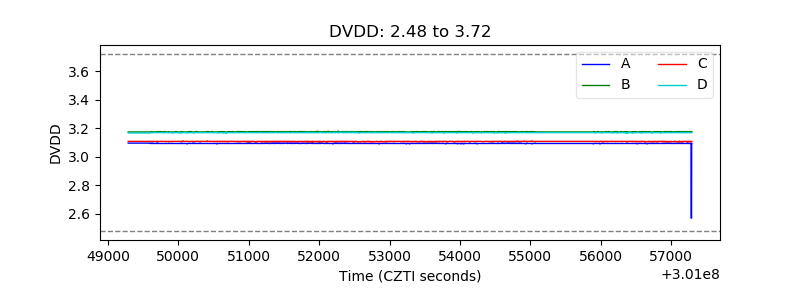 |
| Temperature 1 | 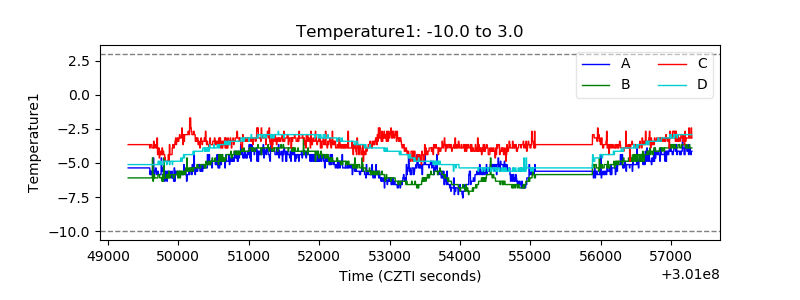 |
| Veto HV Monitor | 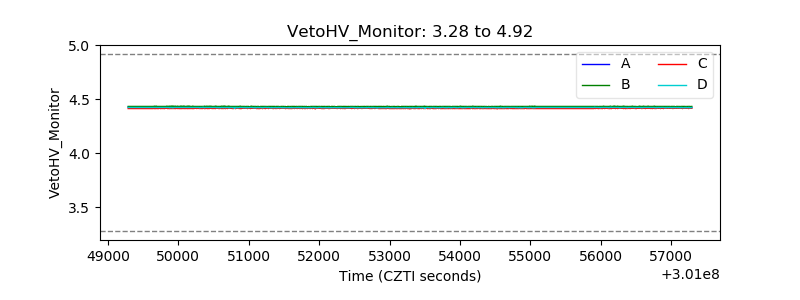 |
| Veto LLD | 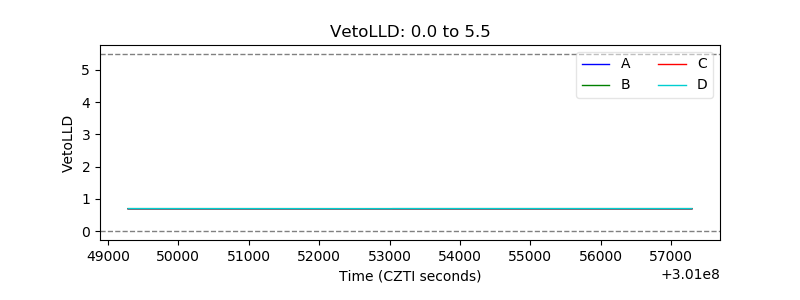 |
| Alpha Counter | 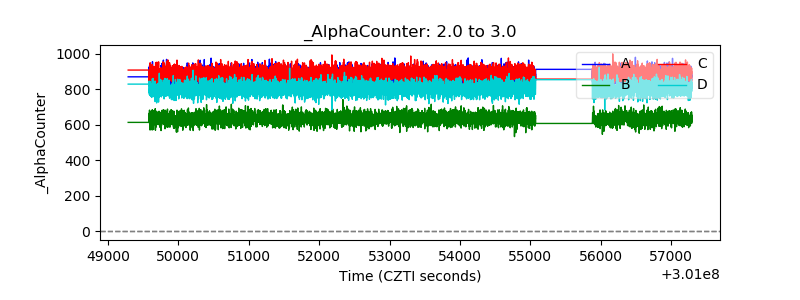 |
| _CPM_Rate | 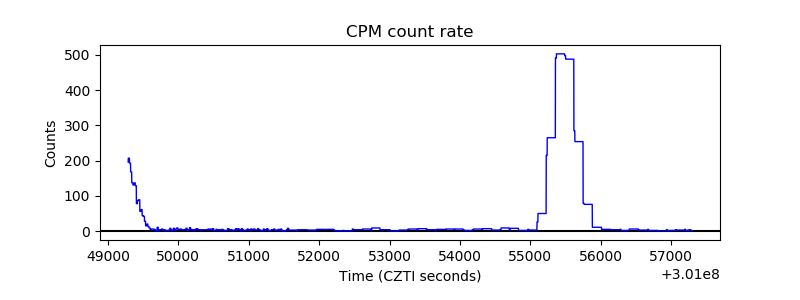 |
| CZT Counter | 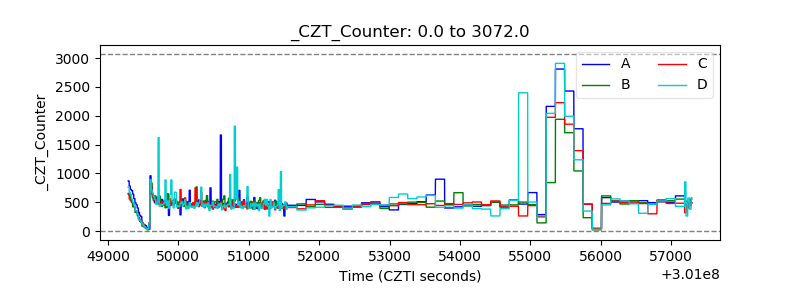 |
| +2.5 Volts monitor |  |
| +5 Volts monitor |  |
| _ROLL_ROT | 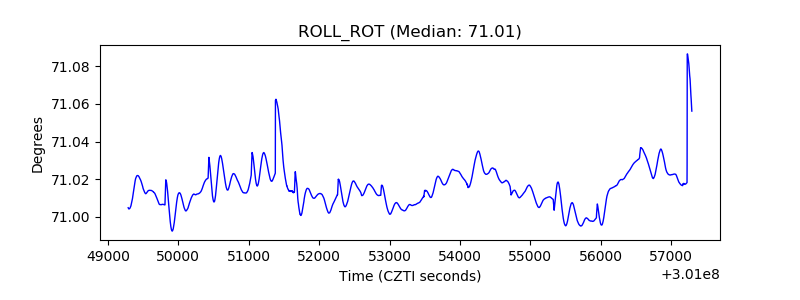 |
| _Roll_DEC | 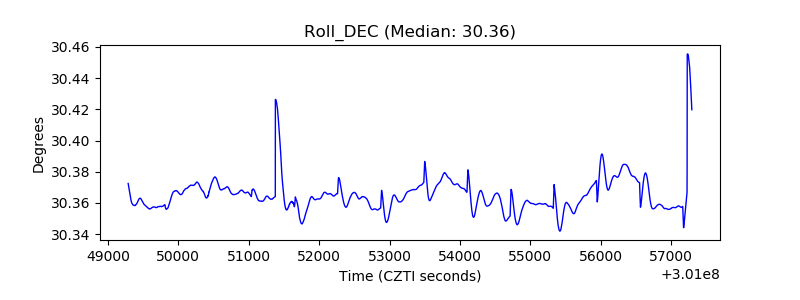 |
| _Roll_RA | 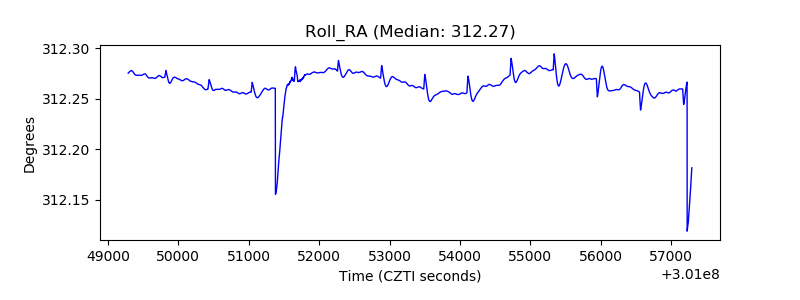 |
| Veto Counter | 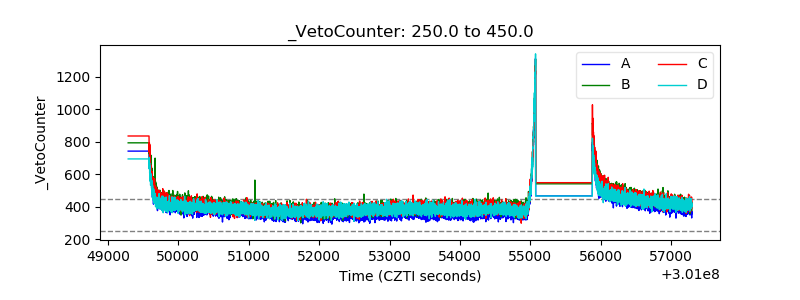 |