| Param | Original file | Final file |
|---|---|---|
| Filename | modeM0/AS1A05_069T02_9000003038_20551cztM0_level2.evt | modeM0/AS1A05_069T02_9000003038_20551cztM0_level2_quad_clean.evt |
| Size (bytes) | 480,934,080 | 85,109,760 |
| Size | 458.7 MB | 81.2 MB |
| Events in quadrant A | 3,634,119 | 538,960 |
| Events in quadrant B | 3,488,650 | 546,058 |
| Events in quadrant C | 3,443,635 | 516,184 |
| Events in quadrant D | 3,546,232 | 511,718 |
| Mode M0 | |||
|---|---|---|---|
| Quadrant | BADHDUFLAG | Total packets | Discarded packets |
| A | 0 | 15188 | 2 |
| B | 0 | 14621 | 2 |
| C | 0 | 14430 | 2 |
| D | 0 | 14968 | 2 |
| Mode M9 | |||
|---|---|---|---|
| Quadrant | BADHDUFLAG | Total packets | Discarded packets |
| A | 0 | 21 | 0 |
| B | 0 | 21 | 0 |
| C | 0 | 21 | 0 |
| D | 0 | 21 | 0 |
| Mode SS | |||
|---|---|---|---|
| Quadrant | BADHDUFLAG | Total packets | Discarded packets |
| A | 0 | 138 | 0 |
| B | 0 | 138 | 0 |
| C | 0 | 138 | 0 |
| D | 0 | 138 | 0 |
| Quadrant | Total seconds | Saturated seconds | Saturation percentage |
|---|---|---|---|
| A | 6659 | 135 | 2.027331% |
| B | 6659 | 134 | 2.012314% |
| C | 6659 | 155 | 2.327677% |
| D | 6660 | 106 | 1.591592% |
Noise dominated data is calculated using 1-second bins in cleaned event files. If a bin has >2000 counts, and if more than 50% of those come from <1% of pixels, then it is considered to be noise-dominated and hence unusable.
| Quadrant | # 1 sec bins | Bins with >0 counts | Bins with >2000 counts | High rate bins dominated by noise | Noise dominated (total time) | Noise dominated (detector-on time) | Marked lightcurve |
|---|---|---|---|---|---|---|---|
| A | 8784 | 6661 | 5 | 5 | 0.06% | 0.08% | 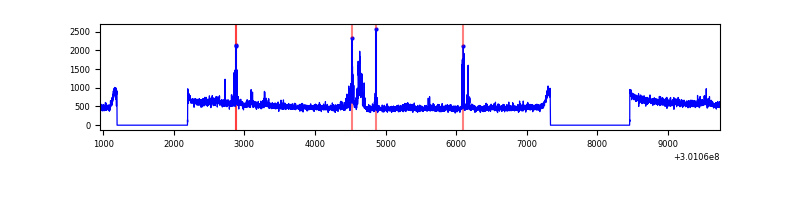 |
| B | 8784 | 6661 | 0 | 0 | 0.00% | 0.00% | 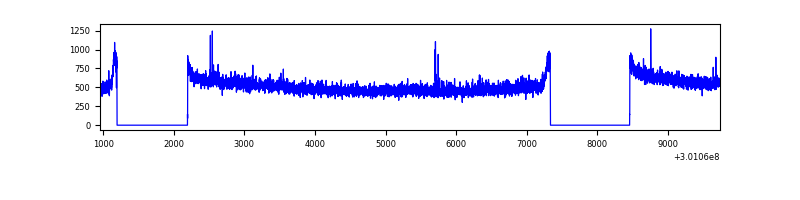 |
| C | 8784 | 6661 | 0 | 0 | 0.00% | 0.00% | 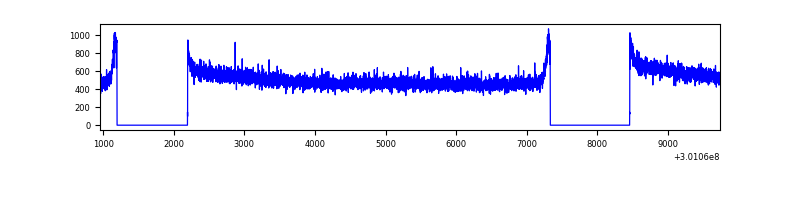 |
| D | 8785 | 6662 | 11 | 11 | 0.13% | 0.17% | 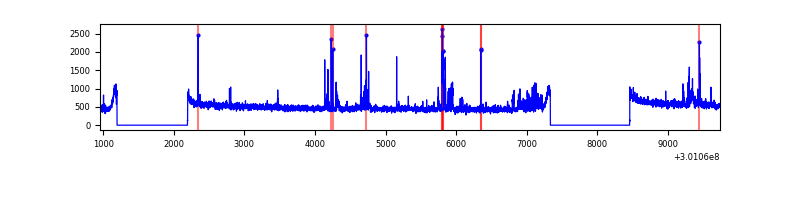 |
Top three noisy pixels from each quadrant. If the there are fewer than three noisy pixels in the level2.evt file, extra rows are filled as -1
| Pixel properties | Quadrant properties | ||||||
|---|---|---|---|---|---|---|---|
| Quadrant | DetID | PixID | Counts | Sigma | Mean | Median | Sigma |
| A | 15 | 174 | 162898 | 910.18 | 886 | 867 | 178.0 |
| A | 14 | 111 | 51505 | 284.45 | 886 | 867 | 178.0 |
| A | 0 | 226 | 7508 | 37.3 | 886 | 867 | 178.0 |
| B | 12 | 111 | 20095 | 114.46 | 878 | 856 | 168.1 |
| B | 0 | 219 | 19554 | 111.24 | 878 | 856 | 168.1 |
| B | 11 | 111 | 17983 | 101.89 | 878 | 856 | 168.1 |
| C | 14 | 238 | 131239 | 660.4 | 846 | 851 | 197.4 |
| C | 8 | 208 | 12642 | 59.72 | 846 | 851 | 197.4 |
| C | 13 | 61 | 5840 | 25.27 | 846 | 851 | 197.4 |
| D | 1 | 52 | 275249 | 1314.78 | 863 | 838 | 208.7 |
| D | 2 | 234 | 23679 | 109.44 | 863 | 838 | 208.7 |
| D | 13 | 153 | 8801 | 38.15 | 863 | 838 | 208.7 |
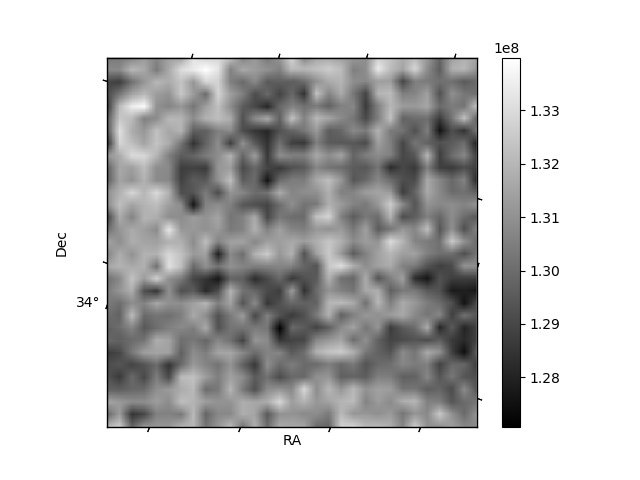
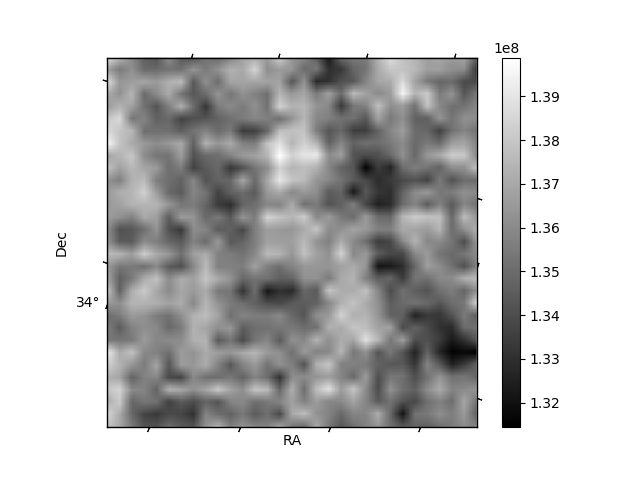
Histogram calculated using DETX and DETY for each event in the final _common_clean file
| Quadrant A |  |
 |
Quadrant B |
|---|---|---|---|
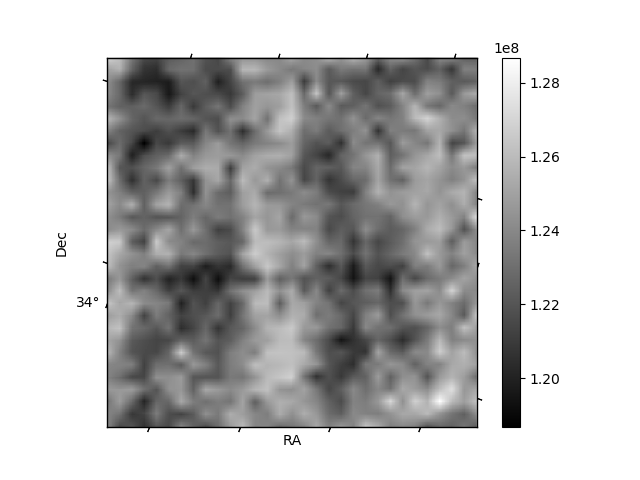
| Quadrant D | 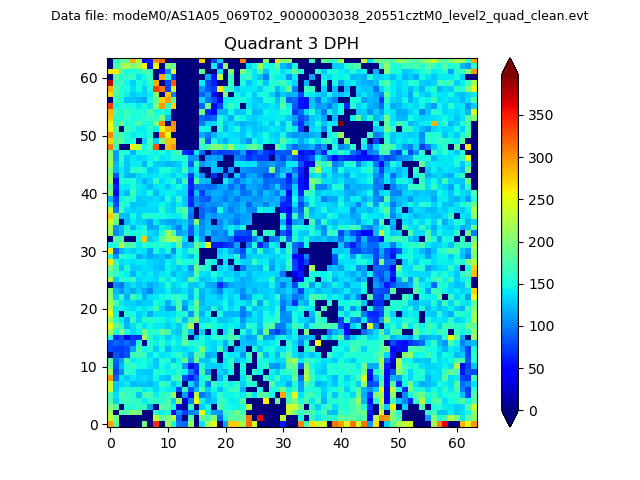 |
 |
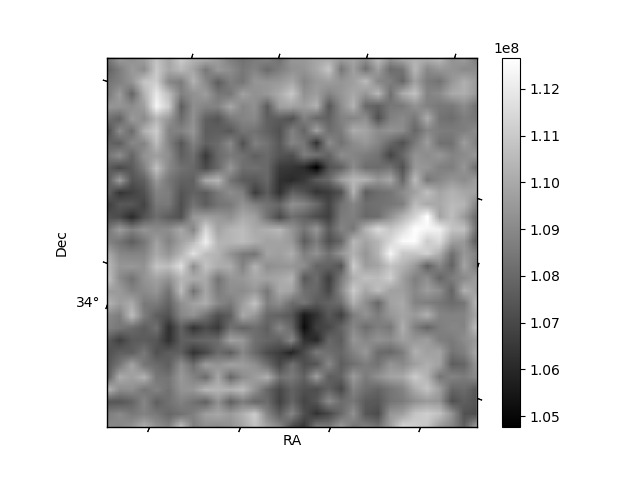
Quadrant C |
| Plot type | Count rate plots | Images |
|---|---|---|
| Comparison with Poisson distribution Blue bars denote a histogram of data divided into 1 sec bins. Red curve is a Poisson curve with rate = median count rate of data. |
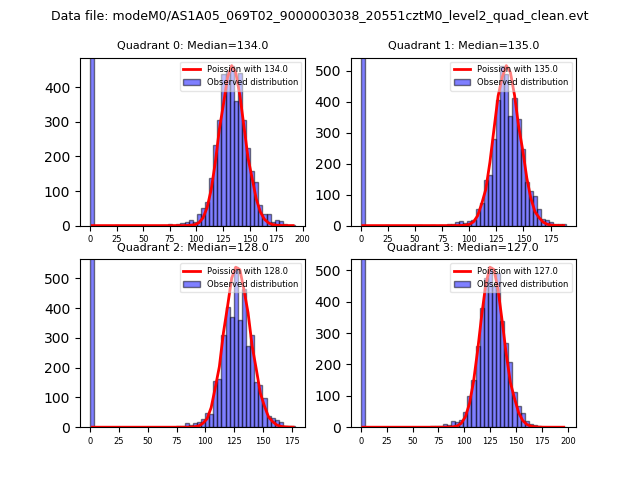 |
 |
| Quadrant-wise count rates Data is divided into 100 sec bins |
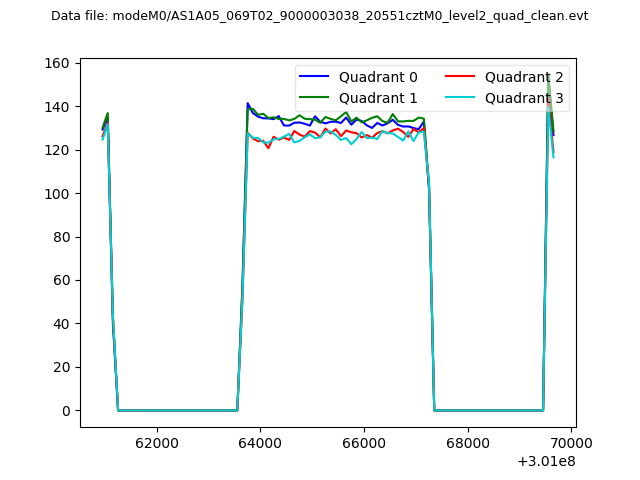 |
|
| Module-wise count rates for Quadrant A Data is divided into 100 sec bins |
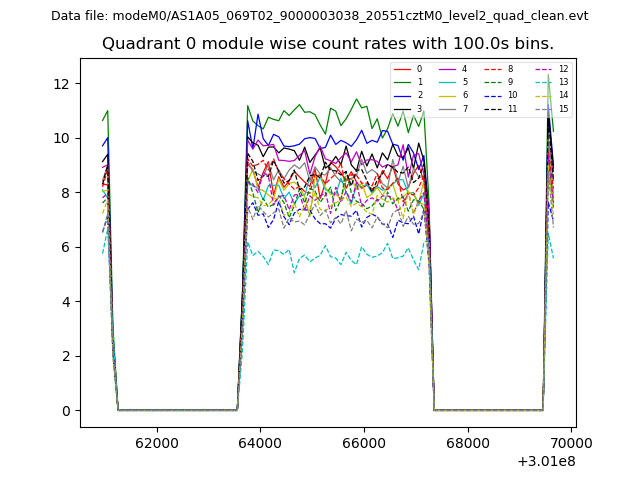 |
 |
| Module-wise count rates for Quadrant B Data is divided into 100 sec bins |
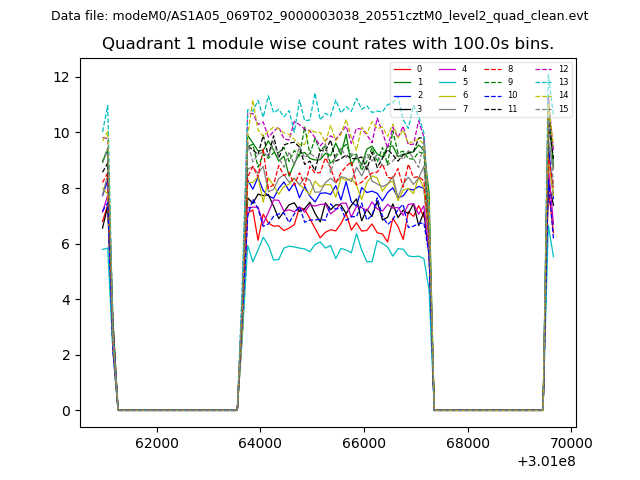 |
 |
| Module-wise count rates for Quadrant C Data is divided into 100 sec bins |
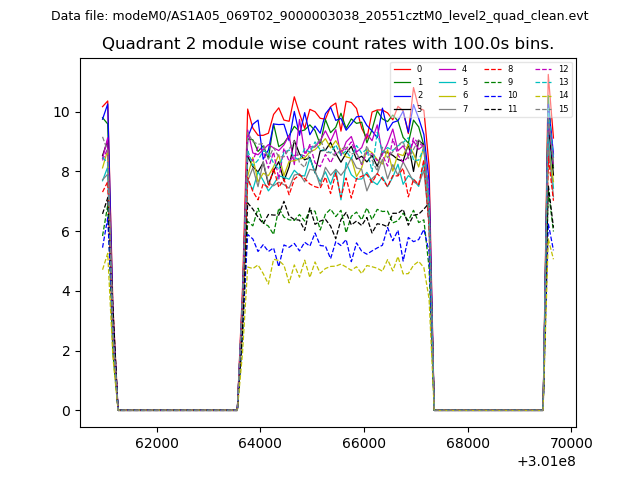 |
 |
| Module-wise count rates for Quadrant D Data is divided into 100 sec bins |
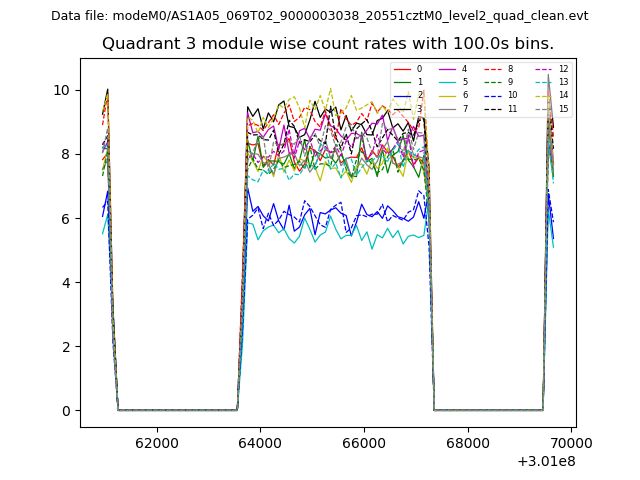 |
 |
| Parameter | Plot |
|---|---|
| CZT HV Monitor |  |
| D_VDD | 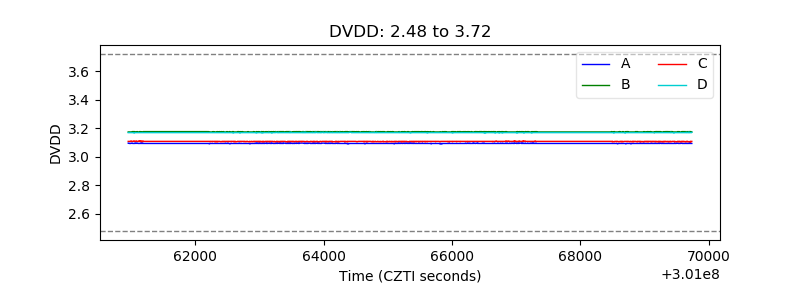 |
| Temperature 1 | 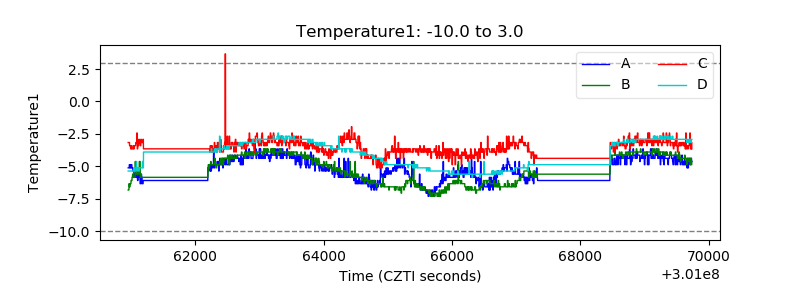 |
| Veto HV Monitor | 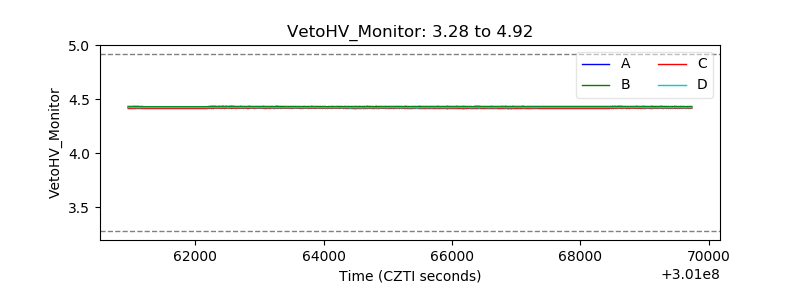 |
| Veto LLD | 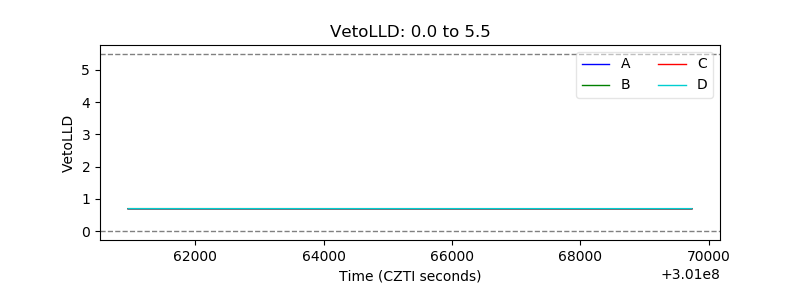 |
| Alpha Counter | 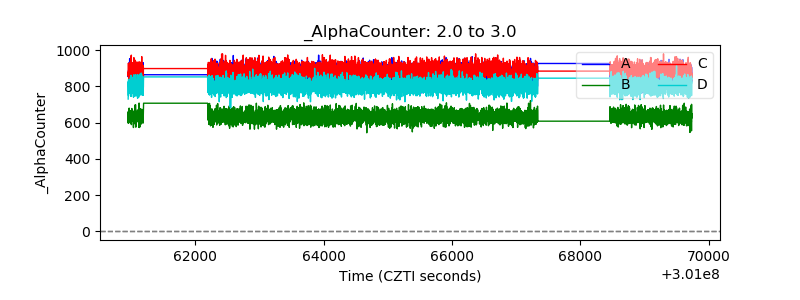 |
| _CPM_Rate | 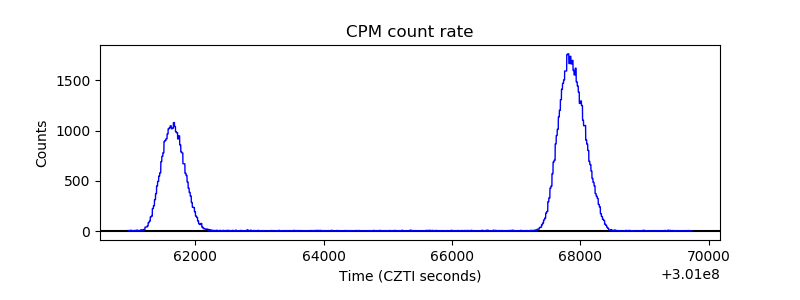 |
| CZT Counter | 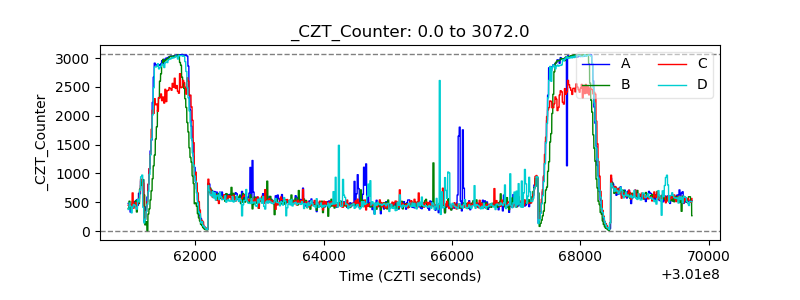 |
| +2.5 Volts monitor |  |
| +5 Volts monitor |  |
| _ROLL_ROT | 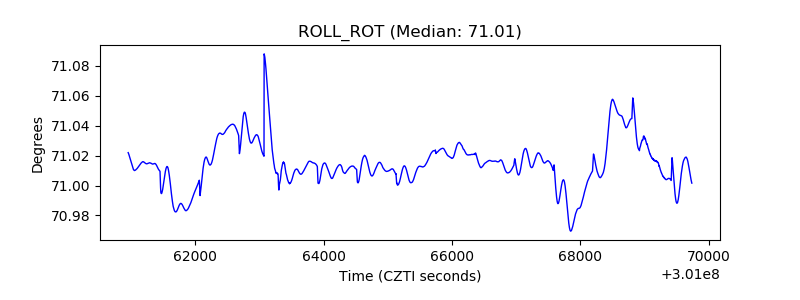 |
| _Roll_DEC | 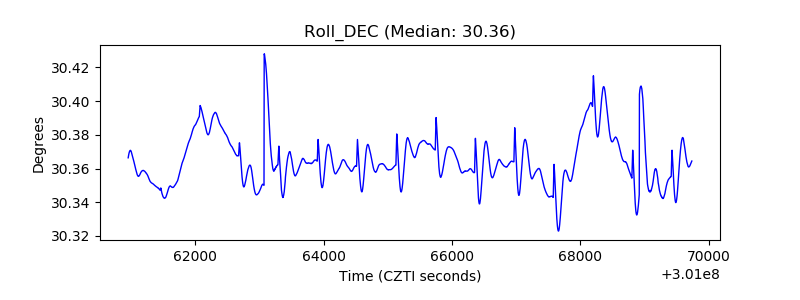 |
| _Roll_RA | 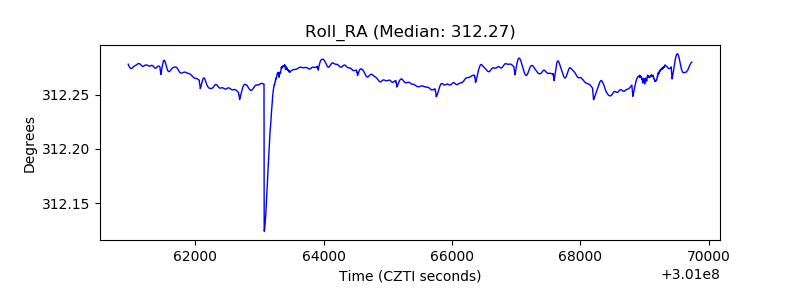 |
| Veto Counter | 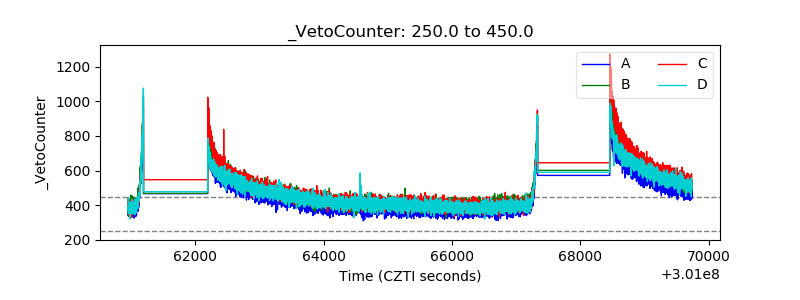 |