| Param | Original file | Final file |
|---|---|---|
| Filename | modeM0/AS1A05_069T02_9000003038_20552cztM0_level2.evt | modeM0/AS1A05_069T02_9000003038_20552cztM0_level2_quad_clean.evt |
| Size (bytes) | 495,938,880 | 101,407,680 |
| Size | 473.0 MB | 96.7 MB |
| Events in quadrant A | 3,583,890 | 660,593 |
| Events in quadrant B | 3,631,267 | 675,000 |
| Events in quadrant C | 3,597,797 | 640,615 |
| Events in quadrant D | 3,752,995 | 629,150 |
| Mode M0 | |||
|---|---|---|---|
| Quadrant | BADHDUFLAG | Total packets | Discarded packets |
| A | 0 | 15076 | 2 |
| B | 0 | 15127 | 2 |
| C | 0 | 15071 | 2 |
| D | 0 | 15565 | 2 |
| Mode M9 | |||
|---|---|---|---|
| Quadrant | BADHDUFLAG | Total packets | Discarded packets |
| A | 0 | 24 | 0 |
| B | 0 | 24 | 0 |
| C | 0 | 24 | 0 |
| D | 0 | 24 | 0 |
| Mode SS | |||
|---|---|---|---|
| Quadrant | BADHDUFLAG | Total packets | Discarded packets |
| A | 0 | 136 | 0 |
| B | 0 | 136 | 0 |
| C | 0 | 136 | 0 |
| D | 0 | 136 | 0 |
| Quadrant | Total seconds | Saturated seconds | Saturation percentage |
|---|---|---|---|
| A | 6686 | 116 | 1.734969% |
| B | 6686 | 122 | 1.824708% |
| C | 6686 | 151 | 2.258450% |
| D | 6686 | 101 | 1.510619% |
Noise dominated data is calculated using 1-second bins in cleaned event files. If a bin has >2000 counts, and if more than 50% of those come from <1% of pixels, then it is considered to be noise-dominated and hence unusable.
| Quadrant | # 1 sec bins | Bins with >0 counts | Bins with >2000 counts | High rate bins dominated by noise | Noise dominated (total time) | Noise dominated (detector-on time) | Marked lightcurve |
|---|---|---|---|---|---|---|---|
| A | 9076 | 6688 | 2 | 2 | 0.02% | 0.03% | 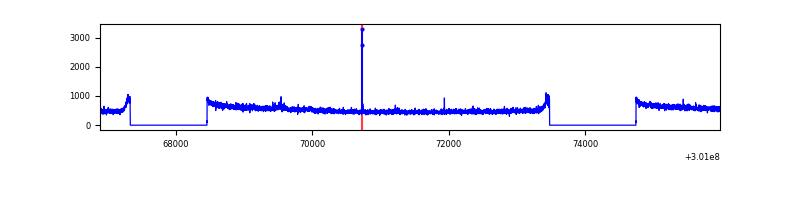 |
| B | 9076 | 6688 | 1 | 1 | 0.01% | 0.01% | 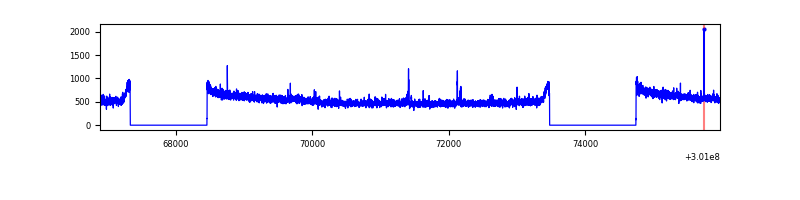 |
| C | 9076 | 6688 | 0 | 0 | 0.00% | 0.00% | 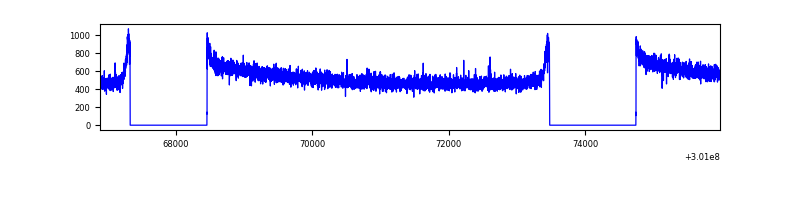 |
| D | 9076 | 6688 | 21 | 21 | 0.23% | 0.31% | 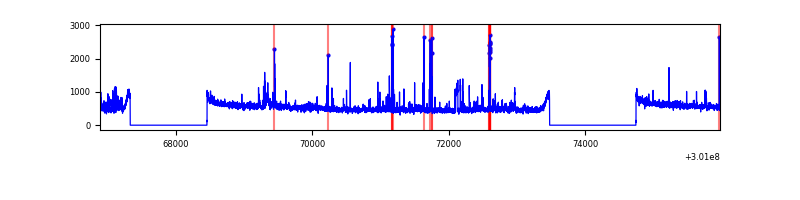 |
Top three noisy pixels from each quadrant. If the there are fewer than three noisy pixels in the level2.evt file, extra rows are filled as -1
| Pixel properties | Quadrant properties | ||||||
|---|---|---|---|---|---|---|---|
| Quadrant | DetID | PixID | Counts | Sigma | Mean | Median | Sigma |
| A | 15 | 174 | 33724 | 180.32 | 916 | 899 | 182.0 |
| A | 12 | 96 | 10237 | 51.3 | 916 | 899 | 182.0 |
| A | 0 | 226 | 7826 | 38.05 | 916 | 899 | 182.0 |
| B | 0 | 198 | 21794 | 120.86 | 912 | 890 | 173.0 |
| B | 12 | 111 | 20284 | 112.13 | 912 | 890 | 173.0 |
| B | 0 | 230 | 19864 | 109.7 | 912 | 890 | 173.0 |
| C | 14 | 238 | 138336 | 669.72 | 885 | 892 | 205.2 |
| C | 13 | 61 | 6122 | 25.48 | 885 | 892 | 205.2 |
| C | 8 | 208 | 4918 | 19.62 | 885 | 892 | 205.2 |
| D | 1 | 52 | 324533 | 1493.88 | 900 | 875 | 216.7 |
| D | 13 | 153 | 38585 | 174.05 | 900 | 875 | 216.7 |
| D | 2 | 234 | 24395 | 108.56 | 900 | 875 | 216.7 |
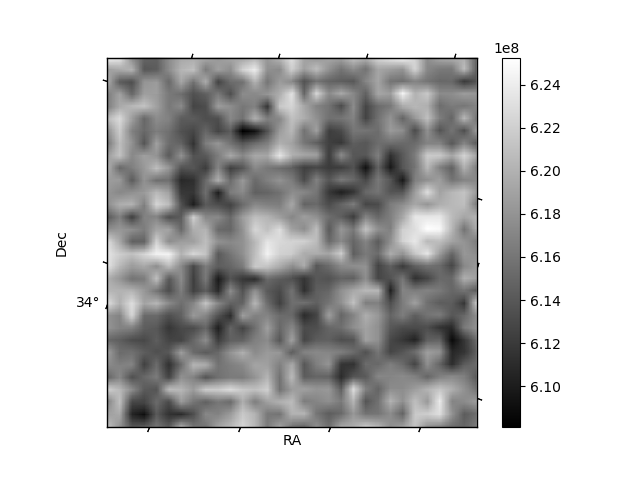
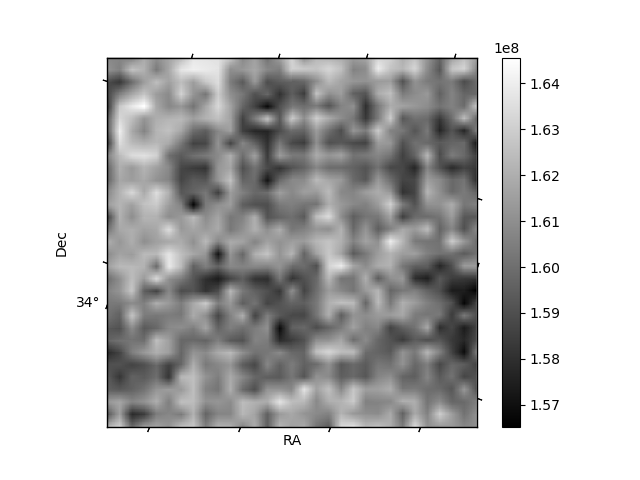
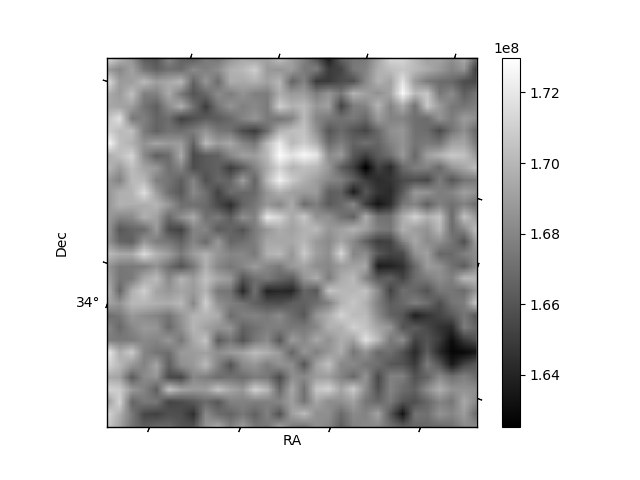
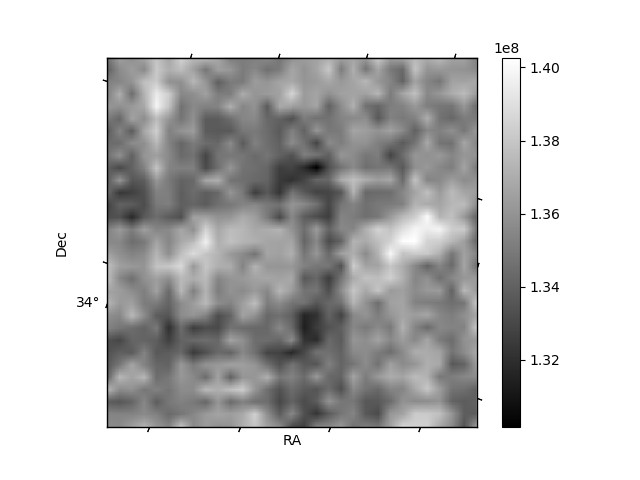
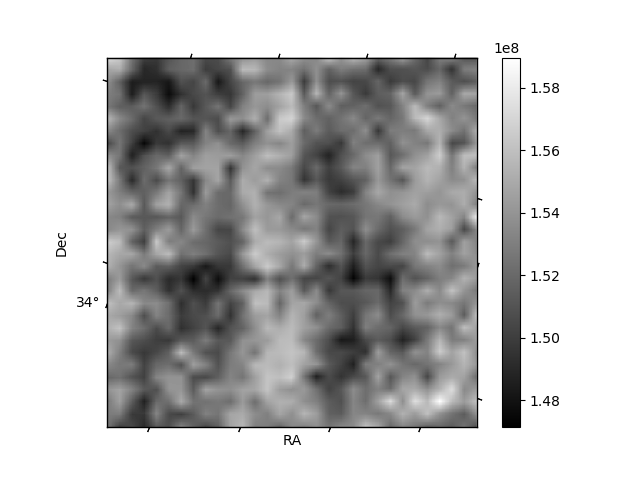
Histogram calculated using DETX and DETY for each event in the final _common_clean file
| Quadrant A | 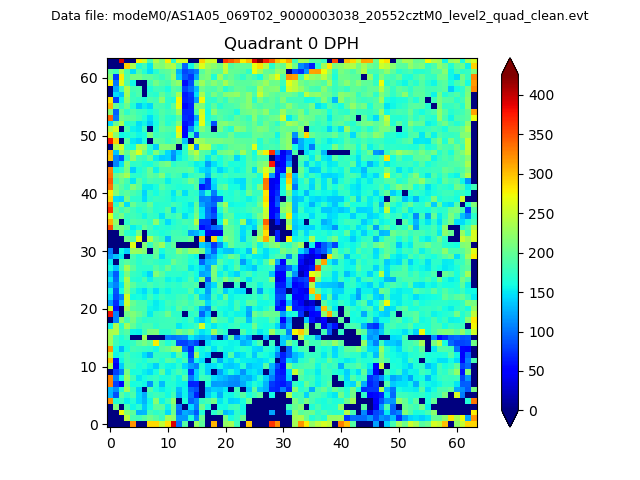 |
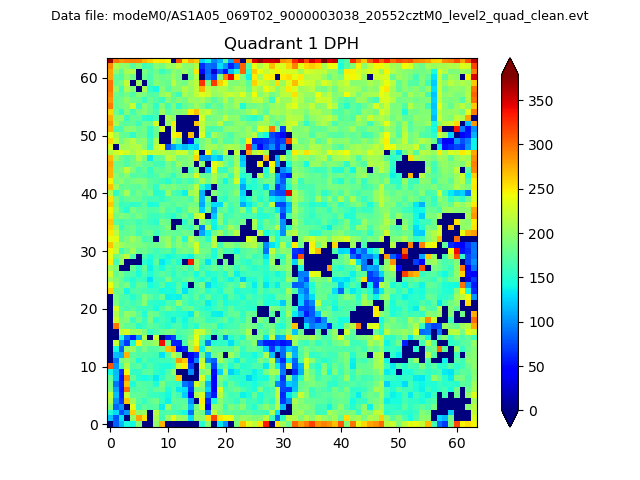 |
Quadrant B |
|---|---|---|---|
| Quadrant D | 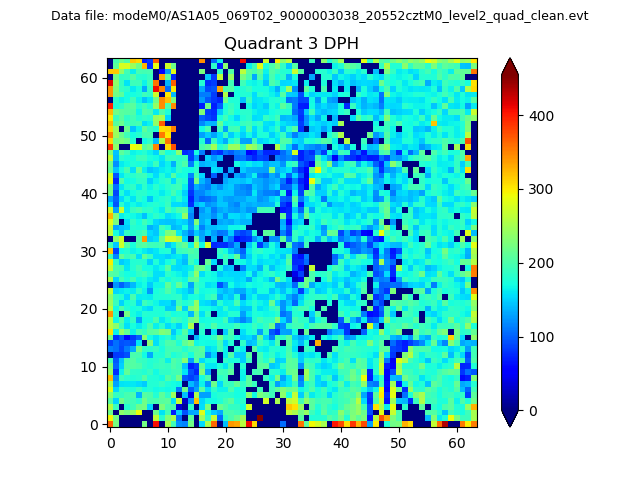 |
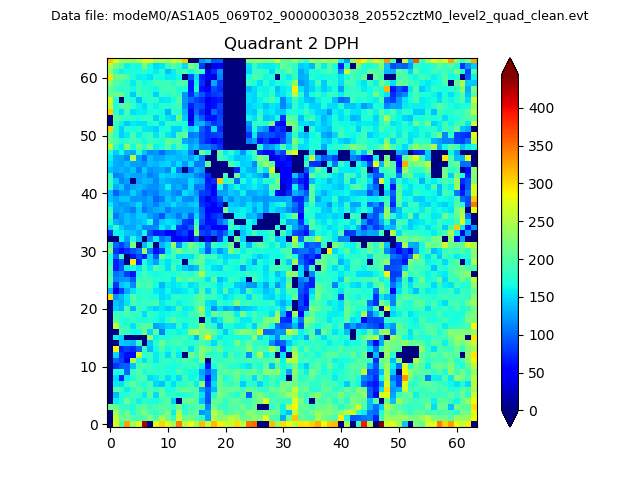 |
Quadrant C |
| Plot type | Count rate plots | Images |
|---|---|---|
| Comparison with Poisson distribution Blue bars denote a histogram of data divided into 1 sec bins. Red curve is a Poisson curve with rate = median count rate of data. |
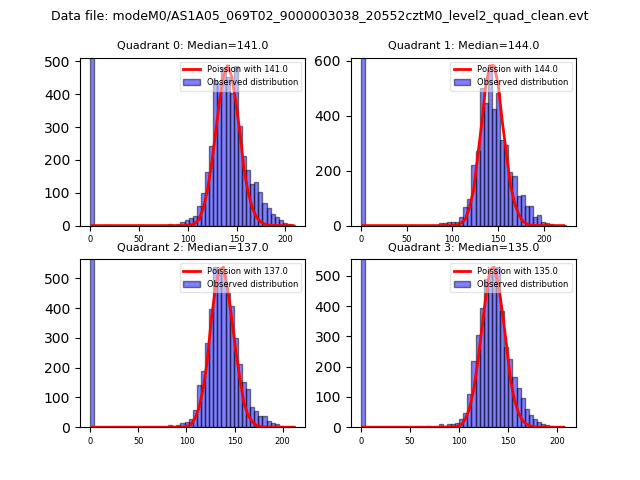 |
 |
| Quadrant-wise count rates Data is divided into 100 sec bins |
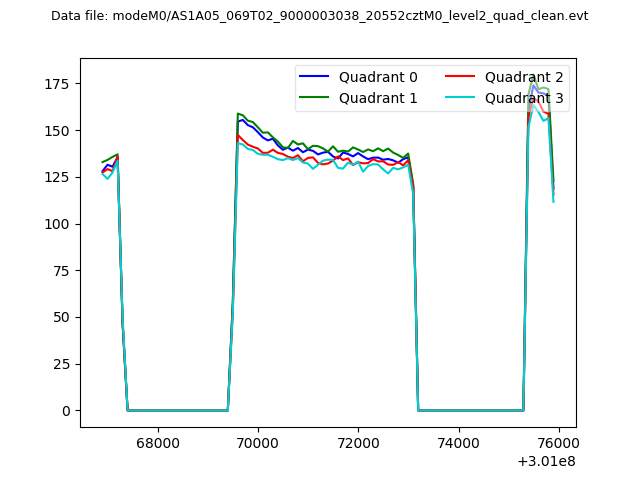 |
|
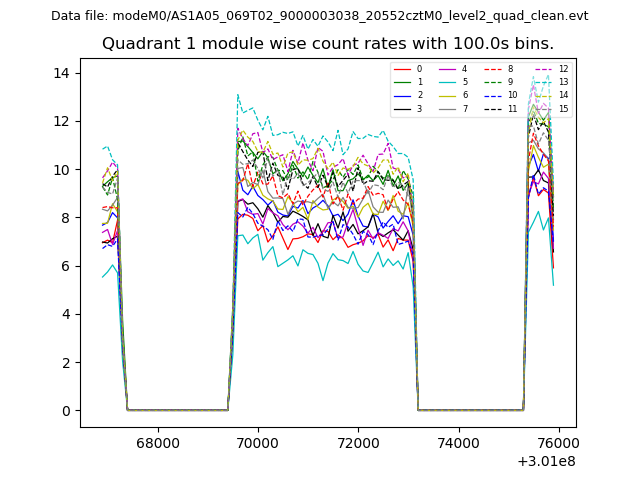
| Module-wise count rates for Quadrant A Data is divided into 100 sec bins |
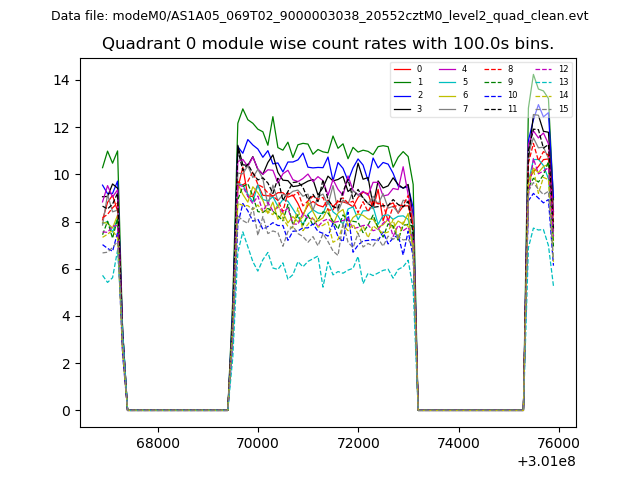 |
 |
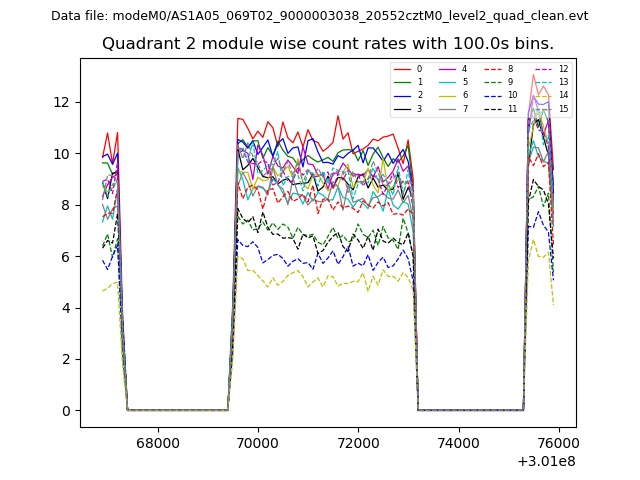
| Module-wise count rates for Quadrant B Data is divided into 100 sec bins |
 |
 |
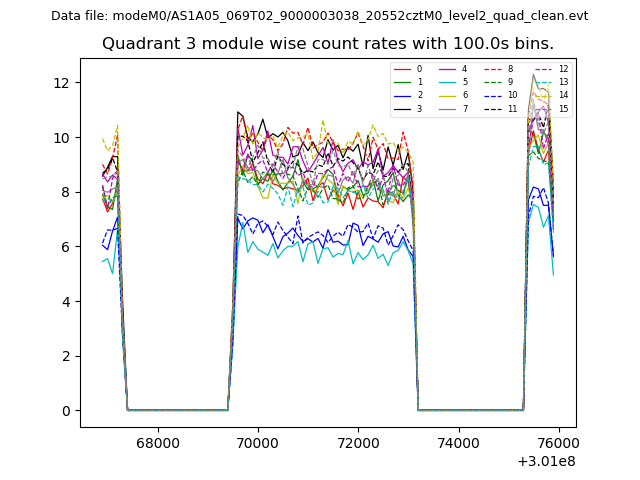
| Module-wise count rates for Quadrant C Data is divided into 100 sec bins |
 |
 |
| Module-wise count rates for Quadrant D Data is divided into 100 sec bins |
 |
 |
| Parameter | Plot |
|---|---|
| CZT HV Monitor | 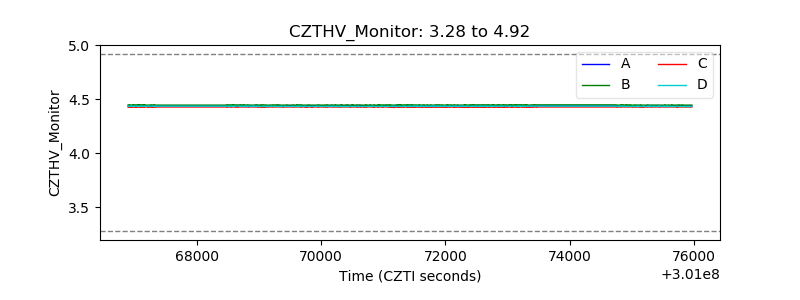 |
| D_VDD | 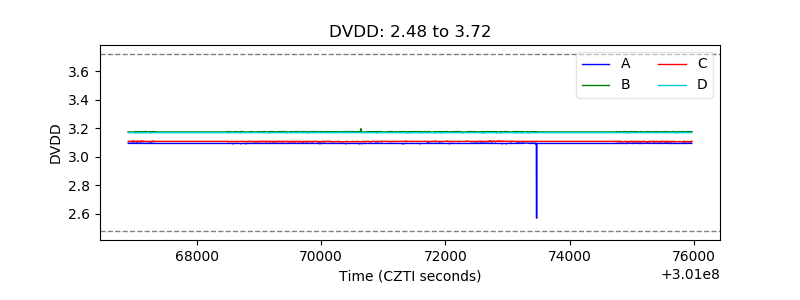 |
| Temperature 1 | 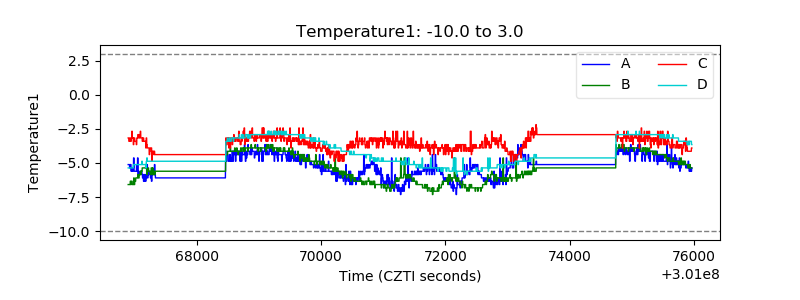 |
| Veto HV Monitor | 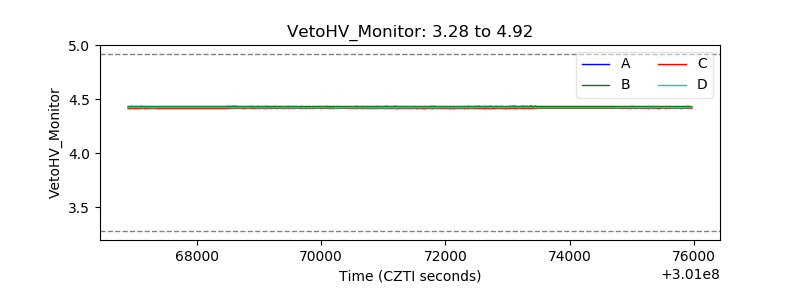 |
| Veto LLD |  |
| Alpha Counter | 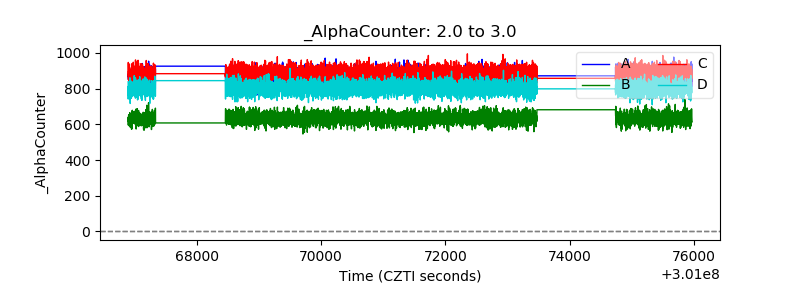 |
| _CPM_Rate | 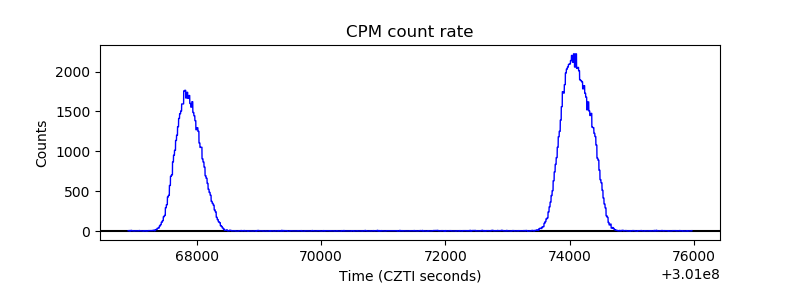 |
| CZT Counter | 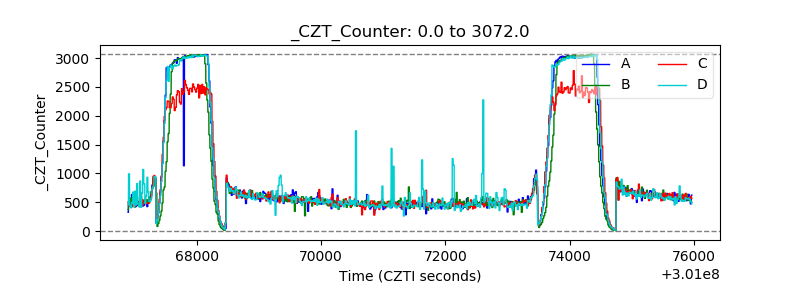 |
| +2.5 Volts monitor |  |
| +5 Volts monitor |  |
| _ROLL_ROT |  |
| _Roll_DEC | 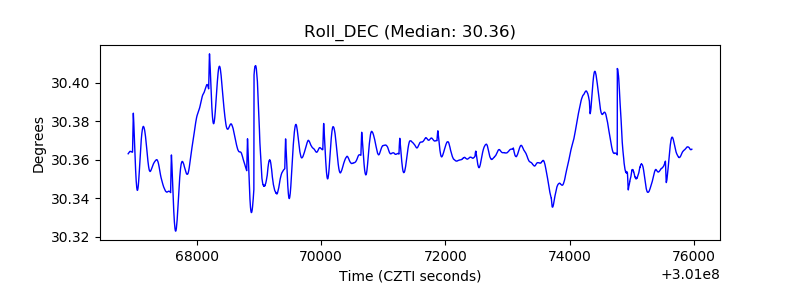 |
| _Roll_RA | 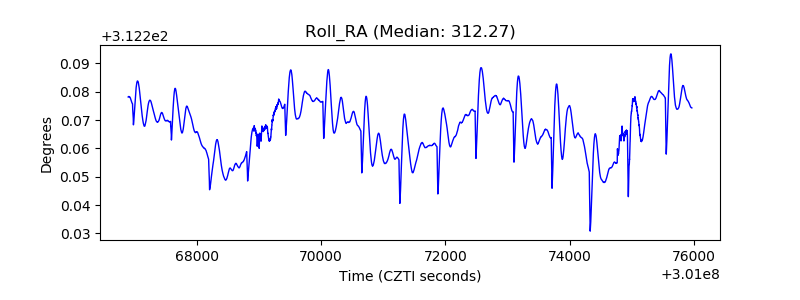 |
| Veto Counter | 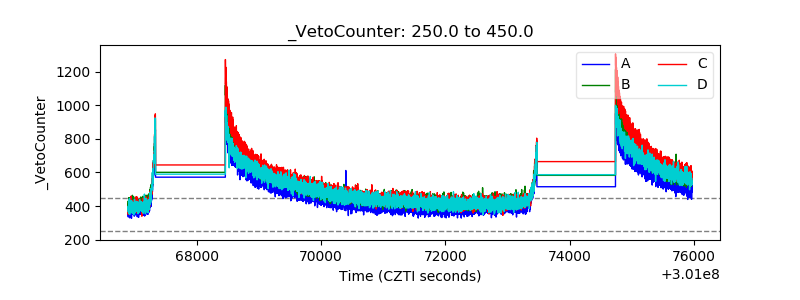 |