| Param | Original file | Final file |
|---|---|---|
| Filename | modeM0/AS1A05_069T02_9000003038_20553cztM0_level2.evt | modeM0/AS1A05_069T02_9000003038_20553cztM0_level2_quad_clean.evt |
| Size (bytes) | 207,823,680 | 51,246,720 |
| Size | 198.2 MB | 48.9 MB |
| Events in quadrant A | 1,519,617 | 341,883 |
| Events in quadrant B | 1,530,913 | 350,356 |
| Events in quadrant C | 1,554,927 | 331,779 |
| Events in quadrant D | 1,495,329 | 326,500 |
| Mode M0 | |||
|---|---|---|---|
| Quadrant | BADHDUFLAG | Total packets | Discarded packets |
| A | 0 | 6389 | 0 |
| B | 0 | 6387 | 0 |
| C | 0 | 6462 | 0 |
| D | 0 | 6290 | 0 |
| Mode SS | |||
|---|---|---|---|
| Quadrant | BADHDUFLAG | Total packets | Discarded packets |
| A | 0 | 56 | 0 |
| B | 0 | 56 | 0 |
| C | 0 | 56 | 0 |
| D | 0 | 56 | 0 |
| Quadrant | Total seconds | Saturated seconds | Saturation percentage |
|---|---|---|---|
| A | 2815 | 4 | 0.142096% |
| B | 2815 | 12 | 0.426288% |
| C | 2815 | 21 | 0.746004% |
| D | 2816 | 5 | 0.177557% |
Noise dominated data is calculated using 1-second bins in cleaned event files. If a bin has >2000 counts, and if more than 50% of those come from <1% of pixels, then it is considered to be noise-dominated and hence unusable.
| Quadrant | # 1 sec bins | Bins with >0 counts | Bins with >2000 counts | High rate bins dominated by noise | Noise dominated (total time) | Noise dominated (detector-on time) | Marked lightcurve |
|---|---|---|---|---|---|---|---|
| A | 2815 | 2815 | 0 | 0 | 0.00% | 0.00% | 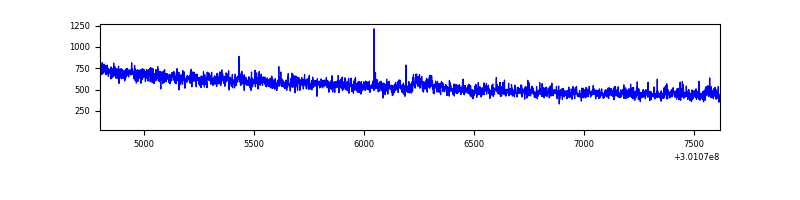 |
| B | 2815 | 2815 | 1 | 1 | 0.04% | 0.04% | 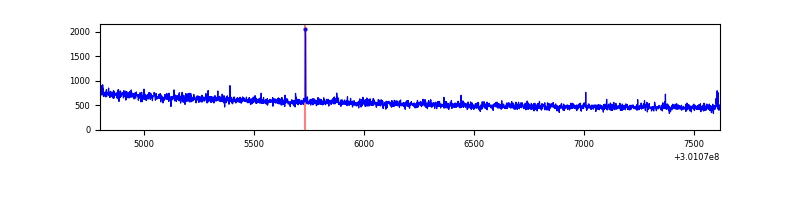 |
| C | 2815 | 2815 | 0 | 0 | 0.00% | 0.00% | 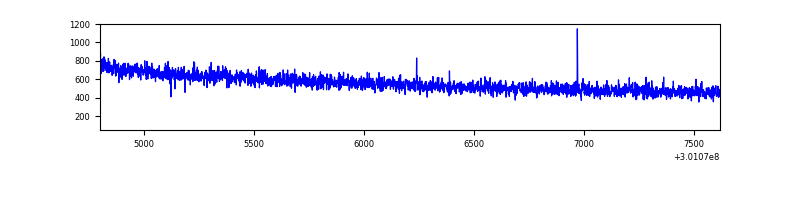 |
| D | 2816 | 2816 | 1 | 1 | 0.04% | 0.04% | 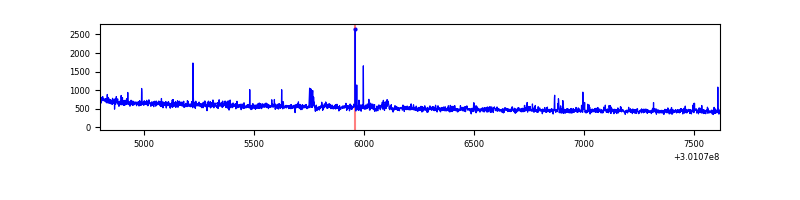 |
Top three noisy pixels from each quadrant. If the there are fewer than three noisy pixels in the level2.evt file, extra rows are filled as -1
| Pixel properties | Quadrant properties | ||||||
|---|---|---|---|---|---|---|---|
| Quadrant | DetID | PixID | Counts | Sigma | Mean | Median | Sigma |
| A | 15 | 174 | 12229 | 150.33 | 388 | 382 | 78.8 |
| A | 15 | 222 | 5442 | 64.21 | 388 | 382 | 78.8 |
| A | 8 | 205 | 4687 | 54.63 | 388 | 382 | 78.8 |
| B | 12 | 111 | 8412 | 108.49 | 389 | 380 | 74.0 |
| B | 11 | 111 | 7336 | 93.95 | 389 | 380 | 74.0 |
| B | 14 | 111 | 6640 | 84.55 | 389 | 380 | 74.0 |
| C | 14 | 238 | 59945 | 670.31 | 382 | 387 | 88.9 |
| C | 13 | 61 | 2725 | 26.31 | 382 | 387 | 88.9 |
| C | 3 | 233 | 2688 | 25.9 | 382 | 387 | 88.9 |
| D | 1 | 52 | 41910 | 446.03 | 386 | 375 | 93.1 |
| D | 2 | 234 | 10190 | 105.4 | 386 | 375 | 93.1 |
| D | 14 | 226 | 3853 | 37.35 | 386 | 375 | 93.1 |
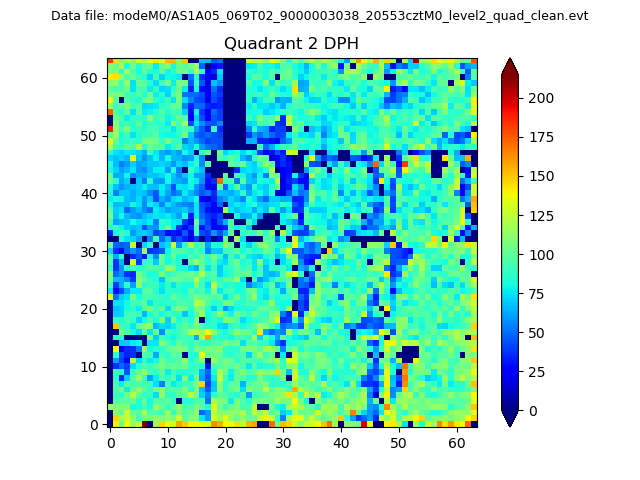
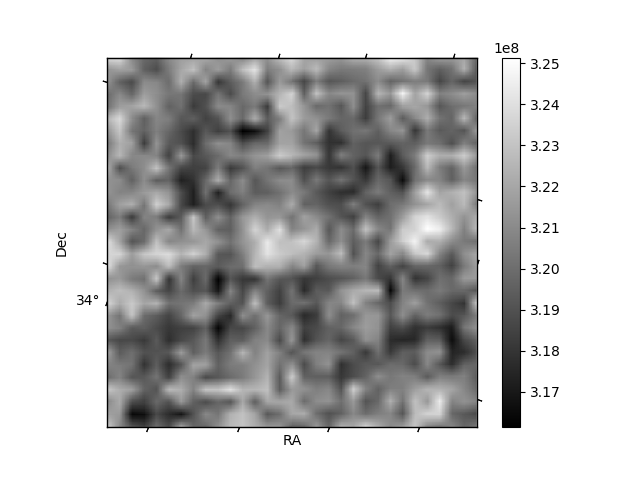
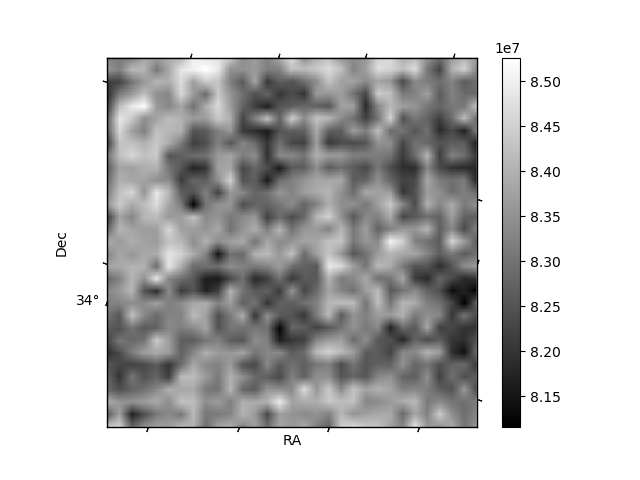
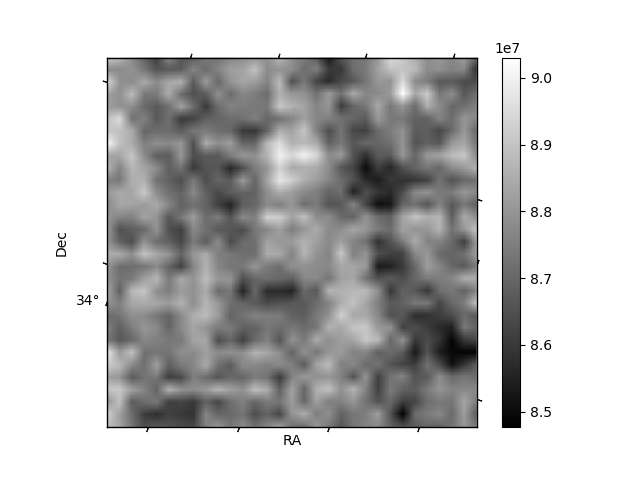
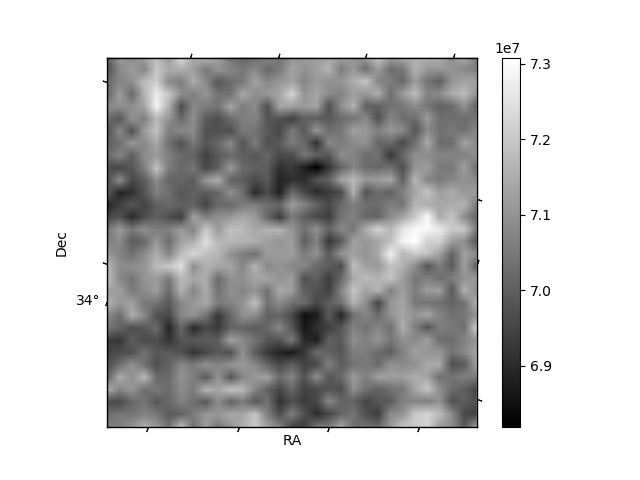
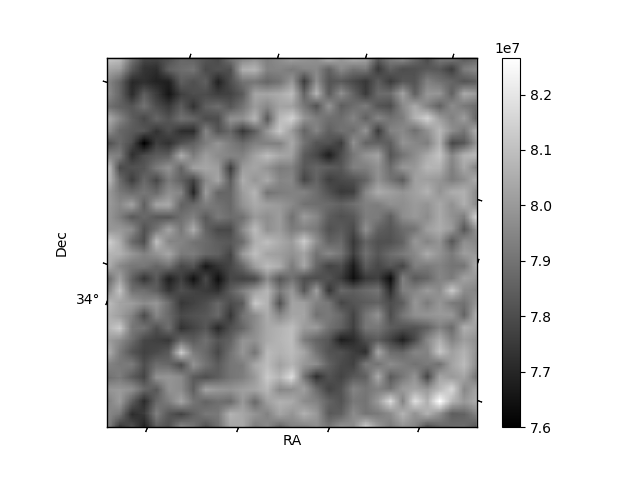
Histogram calculated using DETX and DETY for each event in the final _common_clean file
| Quadrant A | 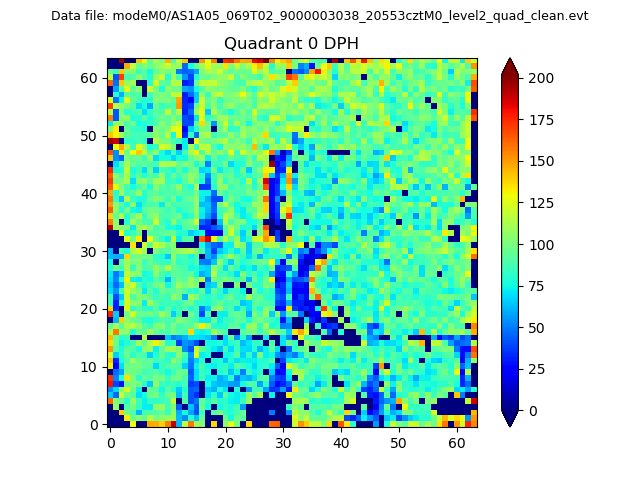 |
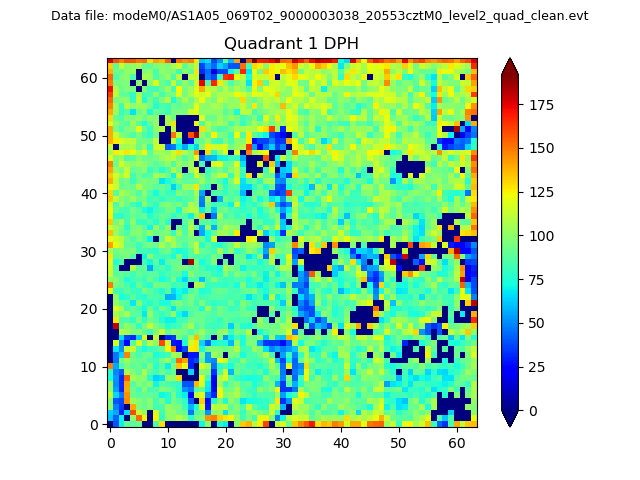 |
Quadrant B |
|---|---|---|---|
| Quadrant D | 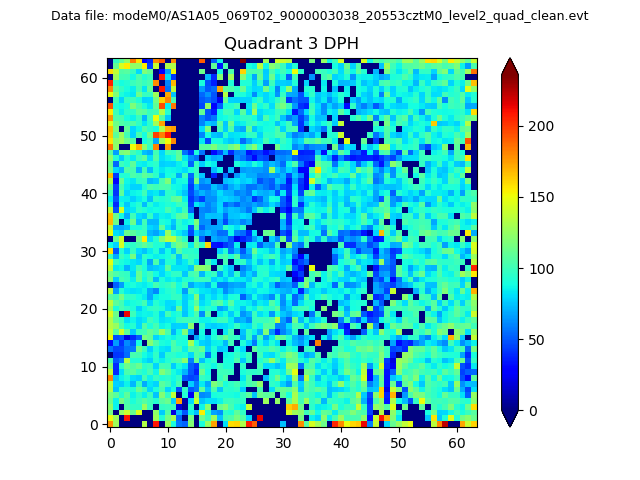 |
 |
Quadrant C |
| Plot type | Count rate plots | Images |
|---|---|---|
| Comparison with Poisson distribution Blue bars denote a histogram of data divided into 1 sec bins. Red curve is a Poisson curve with rate = median count rate of data. |
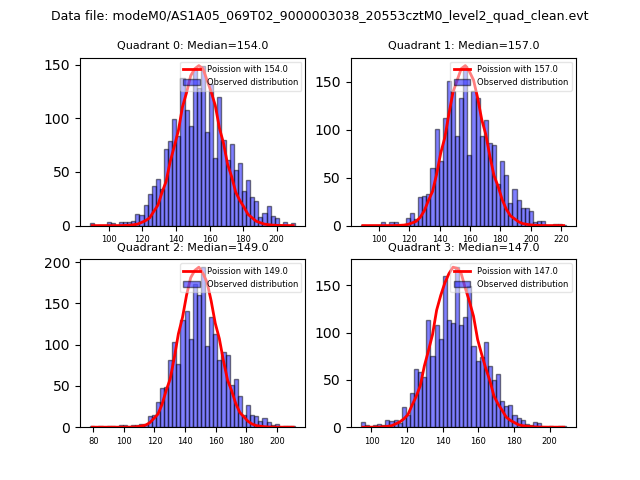 |
 |
| Quadrant-wise count rates Data is divided into 100 sec bins |
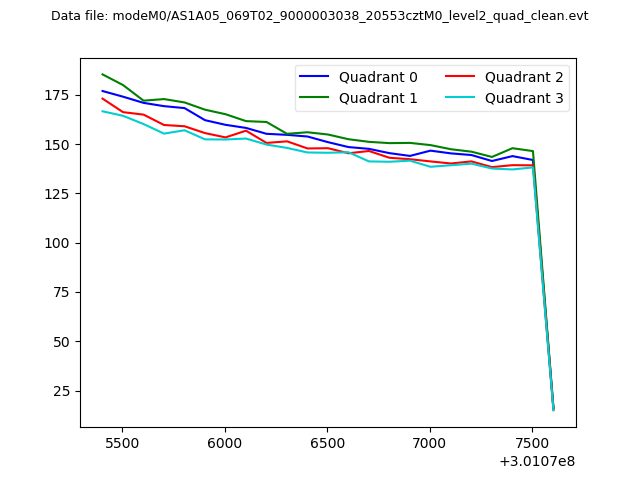 |
|
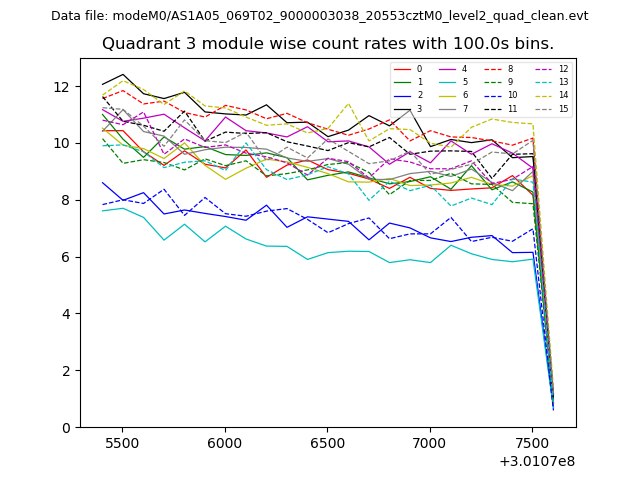
| Module-wise count rates for Quadrant A Data is divided into 100 sec bins |
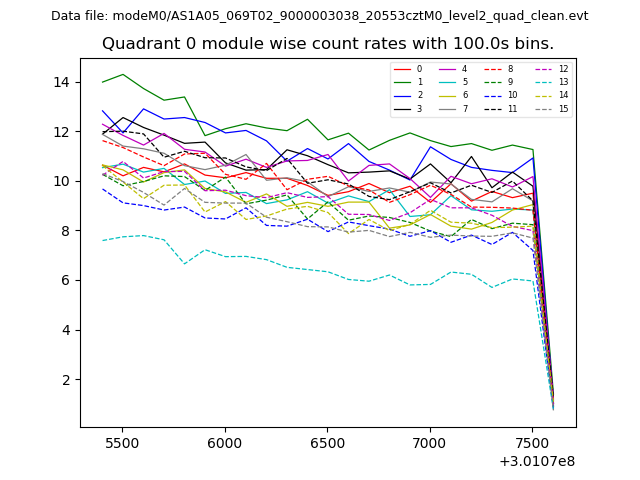 |
 |
| Module-wise count rates for Quadrant B Data is divided into 100 sec bins |
 |
 |
| Module-wise count rates for Quadrant C Data is divided into 100 sec bins |
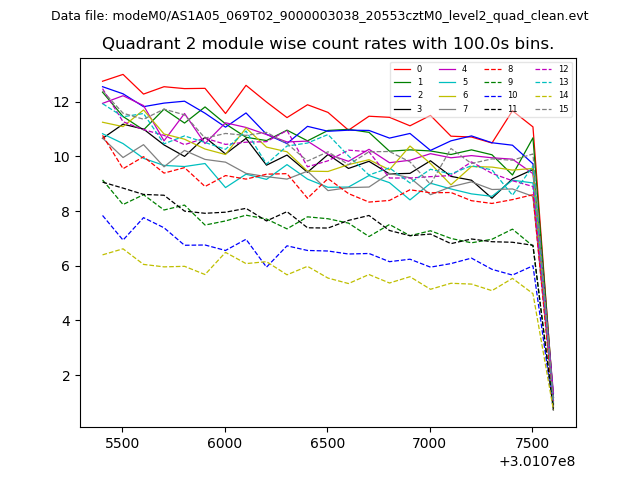 |
 |
| Module-wise count rates for Quadrant D Data is divided into 100 sec bins |
 |
 |
| Parameter | Plot |
|---|---|
| CZT HV Monitor | 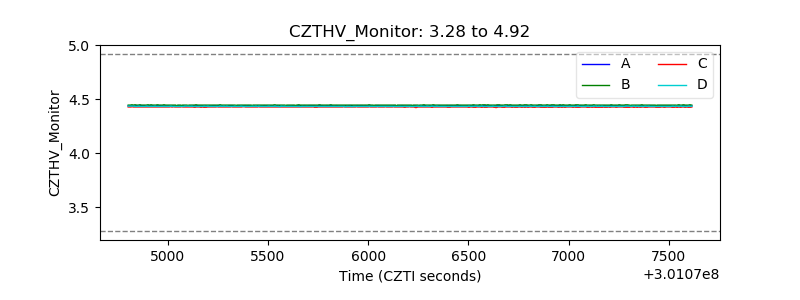 |
| D_VDD | 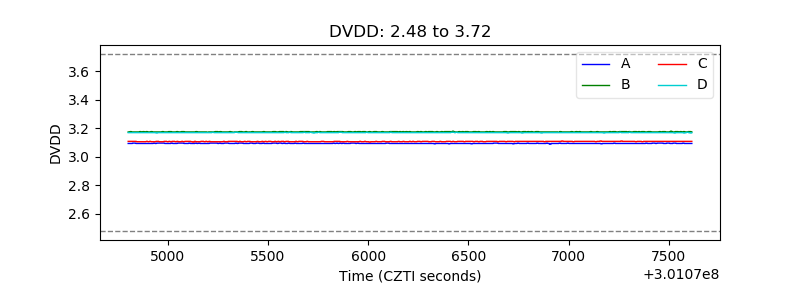 |
| Temperature 1 | 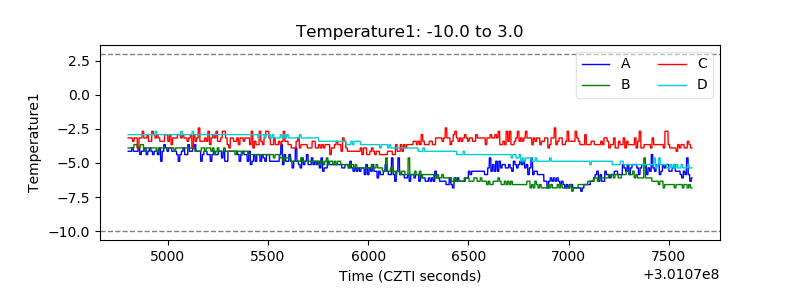 |
| Veto HV Monitor |  |
| Veto LLD | 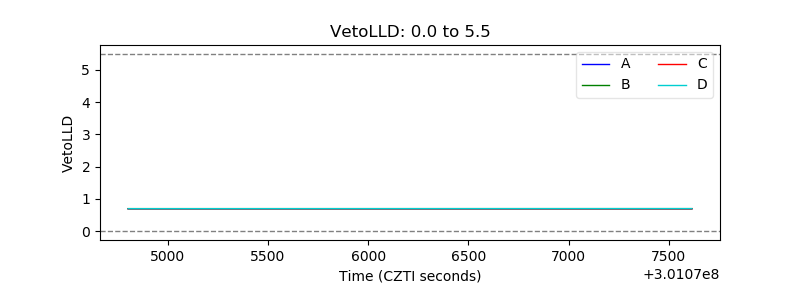 |
| Alpha Counter | 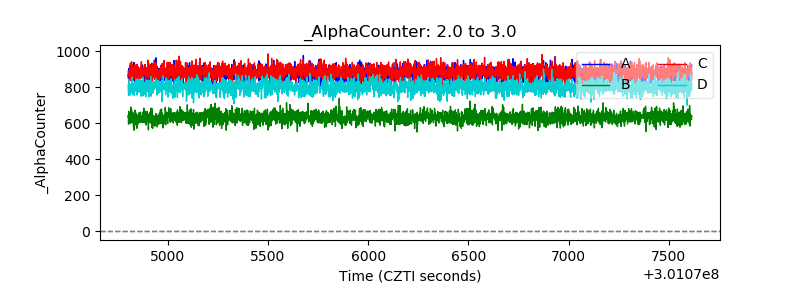 |
| _CPM_Rate | 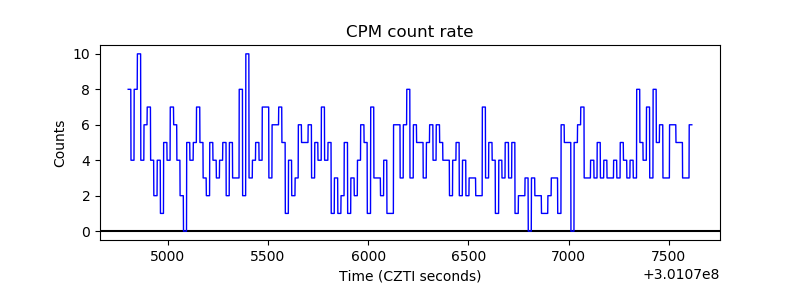 |
| CZT Counter | 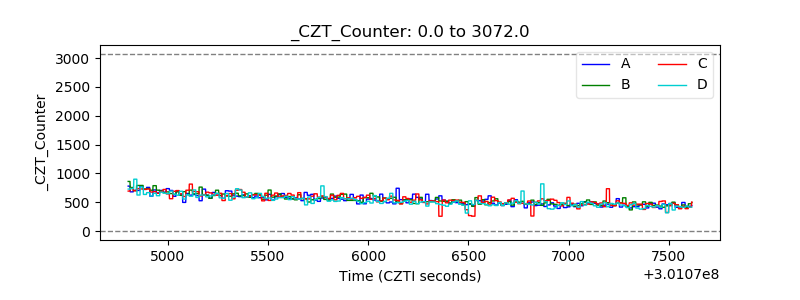 |
| +2.5 Volts monitor |  |
| +5 Volts monitor |  |
| _ROLL_ROT | 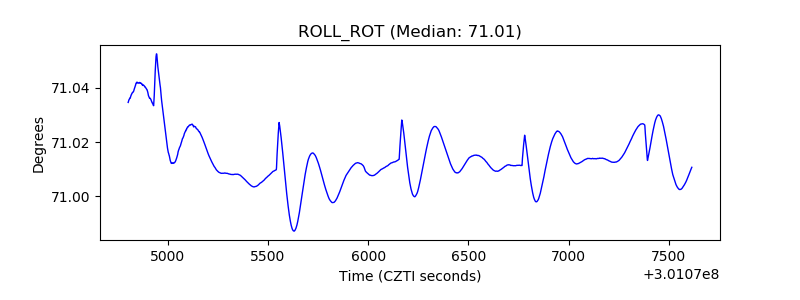 |
| _Roll_DEC | 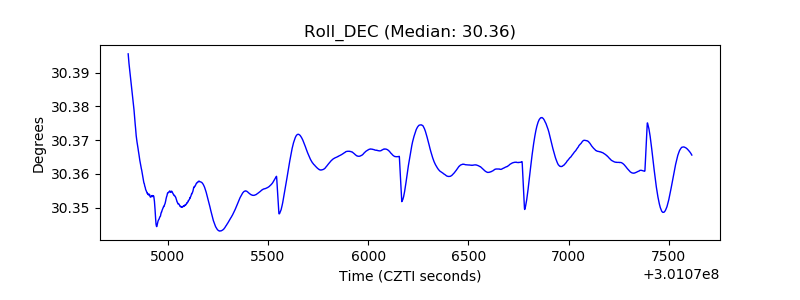 |
| _Roll_RA | 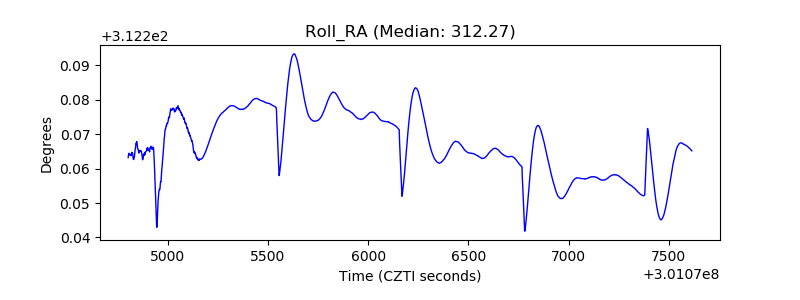 |
| Veto Counter | 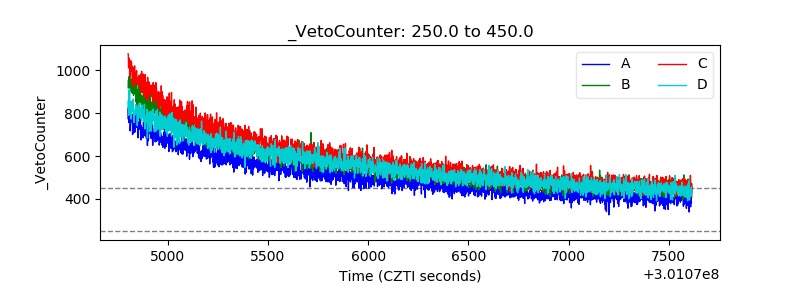 |