| Param | Original file | Final file |
|---|---|---|
| Filename | modeM0/AS1A05_072T04_9000003040cztM0_level2.fits | modeM0/AS1A05_072T04_9000003040cztM0_level2_quad_clean.evt |
| Size (bytes) | 575,331,840 | 505,362,240 |
| Size | 548.7 MB | 482.0 MB |
| Events in quadrant A | 3,525,720 | 2,949,324 |
| Events in quadrant B | 3,390,118 | 2,937,388 |
| Events in quadrant C | 3,468,238 | 2,843,134 |
| Events in quadrant D | 2,979,488 | 2,514,125 |
| Mode M9 | |||
|---|---|---|---|
| Quadrant | BADHDUFLAG | Total packets | Discarded packets |
| A | 0 | 94 | 0 |
| B | 0 | 94 | 0 |
| C | 0 | 94 | 0 |
| D | 0 | 94 | 0 |
| Mode M0 | |||
|---|---|---|---|
| Quadrant | BADHDUFLAG | Total packets | Discarded packets |
| A | 0 | 122472 | 0 |
| B | 0 | 124087 | 0 |
| C | 0 | 124069 | 0 |
| D | 0 | 156822 | 0 |
| Mode SS | |||
|---|---|---|---|
| Quadrant | BADHDUFLAG | Total packets | Discarded packets |
| A | 0 | 1200 | 0 |
| B | 0 | 1200 | 0 |
| C | 0 | 1200 | 0 |
| D | 0 | 1200 | 0 |
| Quadrant | Total seconds | Saturated seconds | Saturation percentage |
|---|---|---|---|
| A | 59211 | 608 | 1.026836% |
| B | 59211 | 819 | 1.383189% |
| C | 59211 | 922 | 1.557143% |
| D | 59211 | 2518 | 4.252588% |
Noise dominated data is calculated using 1-second bins in cleaned event files. If a bin has >2000 counts, and if more than 50% of those come from <1% of pixels, then it is considered to be noise-dominated and hence unusable.
| Quadrant | # 1 sec bins | Bins with >0 counts | Bins with >2000 counts | High rate bins dominated by noise | Noise dominated (total time) | Noise dominated (detector-on time) | Marked lightcurve |
|---|---|---|---|---|---|---|---|
| A | 68246 | 59211 | 0 | 0 | 0.00% | 0.00% | 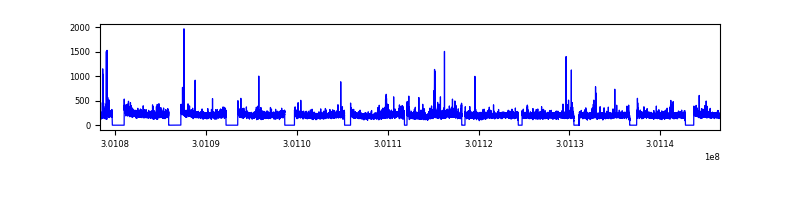 |
| B | 68246 | 59211 | 0 | 0 | 0.00% | 0.00% |  |
| C | 68246 | 59211 | 0 | 0 | 0.00% | 0.00% | 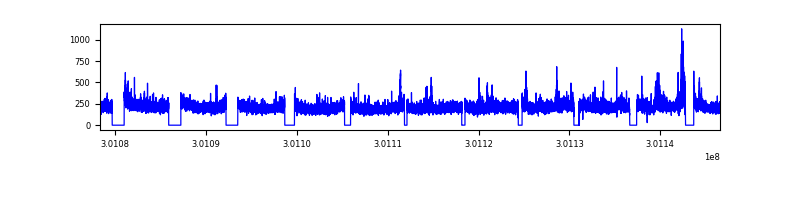 |
| D | 68246 | 59207 | 0 | 0 | 0.00% | 0.00% |  |
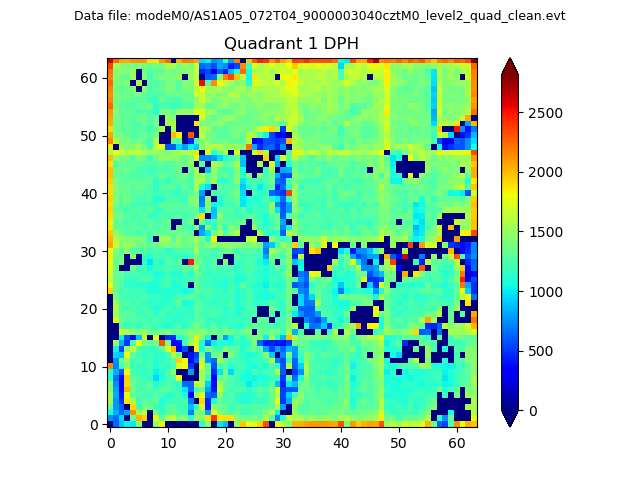
Top three noisy pixels from each quadrant. If the there are fewer than three noisy pixels in the level2.evt file, extra rows are filled as -1
| Pixel properties | Quadrant properties | ||||||
|---|---|---|---|---|---|---|---|
| Quadrant | DetID | PixID | Counts | Sigma | Mean | Median | Sigma |
| A | 0 | 29 | 3203 | 10.31 | 918 | 861 | 227.1 |
| A | 7 | 110 | 2894 | 8.95 | 918 | 861 | 227.1 |
| A | 9 | 19 | 2680 | 8.01 | 918 | 861 | 227.1 |
| B | 2 | 9 | 2741 | 10.79 | 895 | 855 | 174.7 |
| B | 2 | 8 | 2286 | 8.19 | 895 | 855 | 174.7 |
| B | 3 | 17 | 2239 | 7.92 | 895 | 855 | 174.7 |
| C | 2 | 191 | 2417 | 6.64 | 916 | 859 | 234.5 |
| C | 3 | 126 | 2370 | 6.44 | 916 | 859 | 234.5 |
| C | 12 | 241 | 2335 | 6.29 | 916 | 859 | 234.5 |
| D | 10 | 189 | 2142 | 6.03 | 851 | 775 | 226.6 |
| D | 6 | 231 | 2137 | 6.01 | 851 | 775 | 226.6 |
| D | 3 | 14 | 2097 | 5.83 | 851 | 775 | 226.6 |
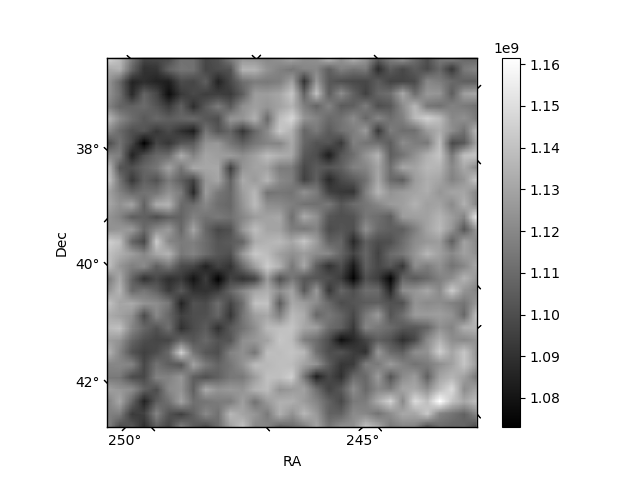
Histogram calculated using DETX and DETY for each event in the final _common_clean file
| Quadrant A |  |
 |
Quadrant B |
|---|---|---|---|
| Quadrant D | 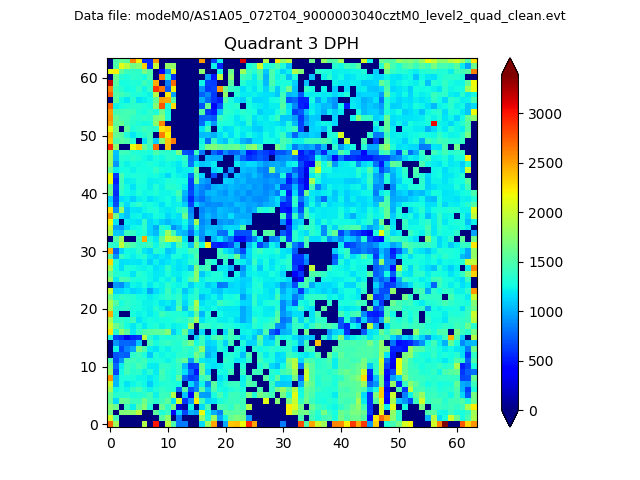 |
 |
Quadrant C |
| Plot type | Count rate plots | Images |
|---|---|---|
| Comparison with Poisson distribution Blue bars denote a histogram of data divided into 1 sec bins. Red curve is a Poisson curve with rate = median count rate of data. |
 |
 |
| Quadrant-wise count rates Data is divided into 100 sec bins |
 |
|
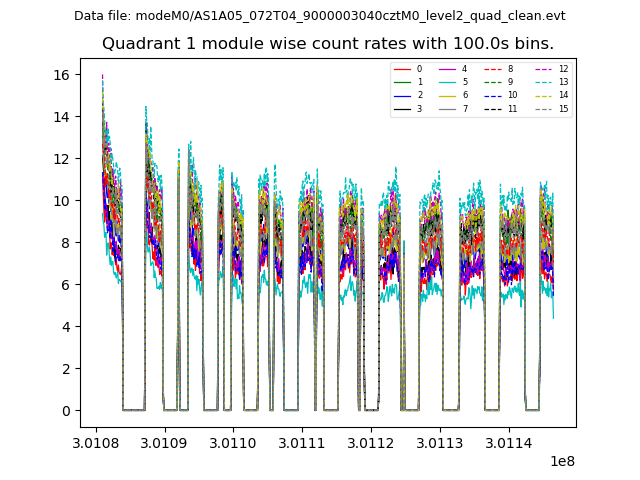
| Module-wise count rates for Quadrant A Data is divided into 100 sec bins |
 |
 |
| Module-wise count rates for Quadrant B Data is divided into 100 sec bins |
 |
 |
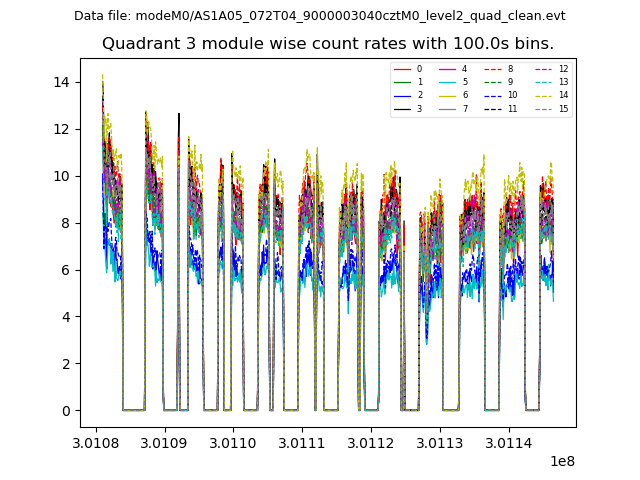
| Module-wise count rates for Quadrant C Data is divided into 100 sec bins |
 |
 |
| Module-wise count rates for Quadrant D Data is divided into 100 sec bins |
 |
 |
| Parameter | Plot |
|---|---|
| CZT HV Monitor | 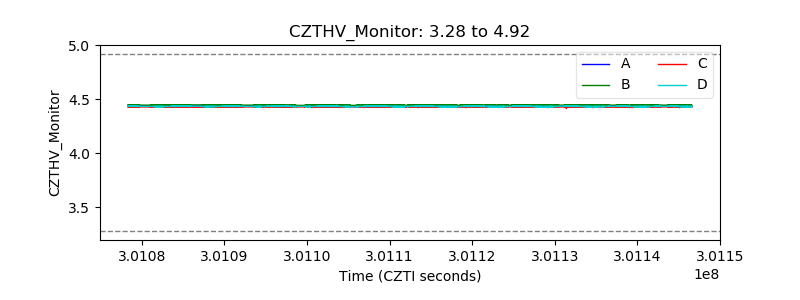 |
| D_VDD | 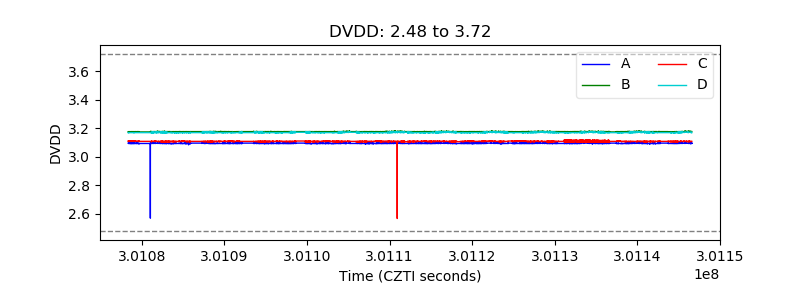 |
| Temperature 1 |  |
| Veto HV Monitor |  |
| Veto LLD |  |
| Alpha Counter |  |
| _CPM_Rate | 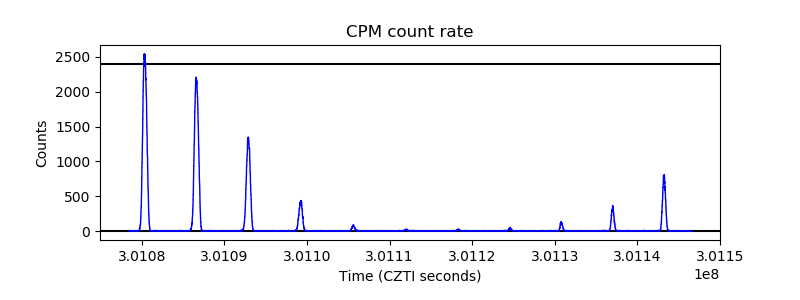 |
| CZT Counter |  |
| +2.5 Volts monitor |  |
| +5 Volts monitor |  |
| _ROLL_ROT | 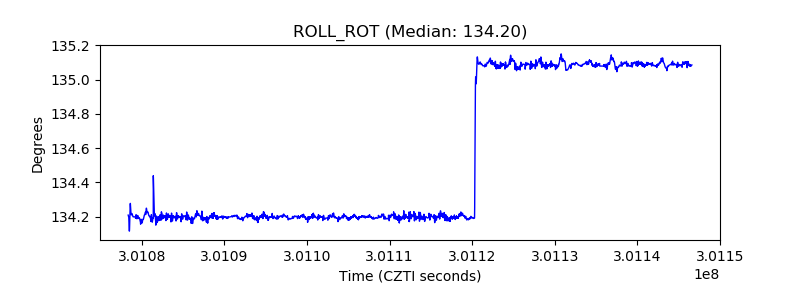 |
| _Roll_DEC |  |
| _Roll_RA | 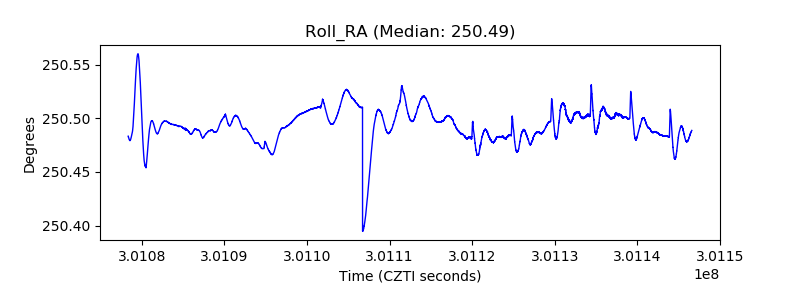 |
| Veto Counter | 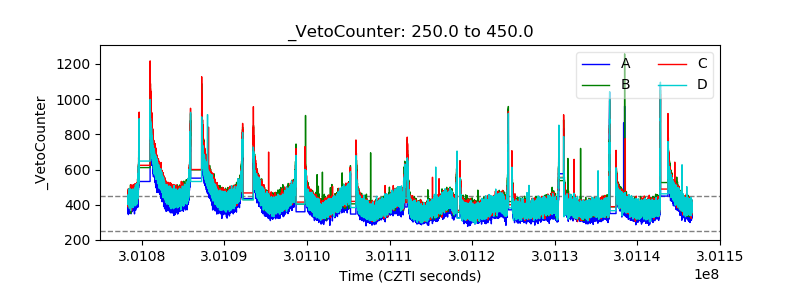 |