| Param | Original file | Final file |
|---|---|---|
| Filename | modeM0/AS1A05_072T04_9000003040_20553cztM0_level2.evt | modeM0/AS1A05_072T04_9000003040_20553cztM0_level2_quad_clean.evt |
| Size (bytes) | 211,533,120 | 32,817,600 |
| Size | 201.7 MB | 31.3 MB |
| Events in quadrant A | 1,410,601 | 207,572 |
| Events in quadrant B | 1,436,406 | 211,962 |
| Events in quadrant C | 1,421,971 | 206,256 |
| Events in quadrant D | 1,965,039 | 187,488 |
| Mode M9 | |||
|---|---|---|---|
| Quadrant | BADHDUFLAG | Total packets | Discarded packets |
| A | 0 | 14 | 0 |
| B | 0 | 14 | 0 |
| C | 0 | 14 | 0 |
| D | 0 | 14 | 0 |
| Mode M0 | |||
|---|---|---|---|
| Quadrant | BADHDUFLAG | Total packets | Discarded packets |
| A | 0 | 5766 | 1 |
| B | 0 | 5799 | 1 |
| C | 0 | 5805 | 1 |
| D | 0 | 7497 | 1 |
| Mode SS | |||
|---|---|---|---|
| Quadrant | BADHDUFLAG | Total packets | Discarded packets |
| A | 0 | 50 | 0 |
| B | 0 | 50 | 0 |
| C | 0 | 50 | 0 |
| D | 0 | 50 | 0 |
| Quadrant | Total seconds | Saturated seconds | Saturation percentage |
|---|---|---|---|
| A | 2512 | 64 | 2.547771% |
| B | 2512 | 69 | 2.746815% |
| C | 2512 | 89 | 3.542994% |
| D | 2512 | 354 | 14.092357% |
Noise dominated data is calculated using 1-second bins in cleaned event files. If a bin has >2000 counts, and if more than 50% of those come from <1% of pixels, then it is considered to be noise-dominated and hence unusable.
| Quadrant | # 1 sec bins | Bins with >0 counts | Bins with >2000 counts | High rate bins dominated by noise | Noise dominated (total time) | Noise dominated (detector-on time) | Marked lightcurve |
|---|---|---|---|---|---|---|---|
| A | 3832 | 2513 | 0 | 0 | 0.00% | 0.00% | 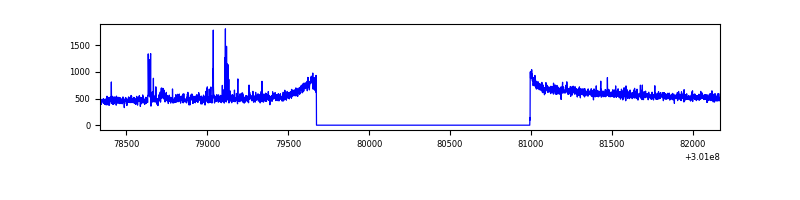 |
| B | 3832 | 2513 | 2 | 2 | 0.05% | 0.08% | 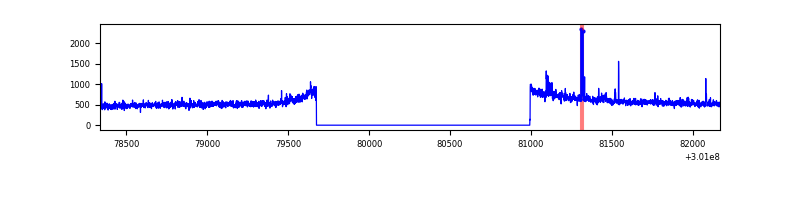 |
| C | 3832 | 2513 | 0 | 0 | 0.00% | 0.00% | 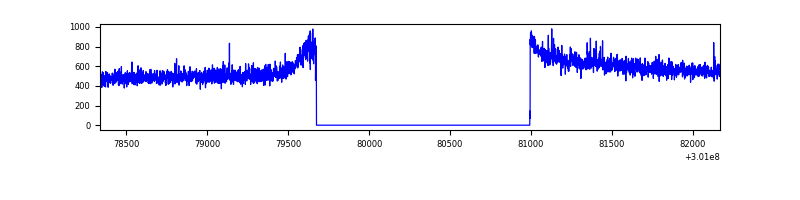 |
| D | 3832 | 2513 | 23 | 23 | 0.60% | 0.92% |  |
Top three noisy pixels from each quadrant. If the there are fewer than three noisy pixels in the level2.evt file, extra rows are filled as -1
| Pixel properties | Quadrant properties | ||||||
|---|---|---|---|---|---|---|---|
| Quadrant | DetID | PixID | Counts | Sigma | Mean | Median | Sigma |
| A | 10 | 253 | 28974 | 396.42 | 356 | 350 | 72.2 |
| A | 15 | 222 | 4515 | 57.68 | 356 | 350 | 72.2 |
| A | 0 | 226 | 3185 | 39.26 | 356 | 350 | 72.2 |
| B | 0 | 189 | 14520 | 212.16 | 355 | 346 | 66.8 |
| B | 0 | 190 | 10141 | 146.61 | 355 | 346 | 66.8 |
| B | 7 | 220 | 9946 | 143.7 | 355 | 346 | 66.8 |
| C | 14 | 238 | 55012 | 668.1 | 347 | 351 | 81.8 |
| C | 8 | 208 | 7683 | 89.62 | 347 | 351 | 81.8 |
| C | 13 | 61 | 2459 | 25.77 | 347 | 351 | 81.8 |
| D | 1 | 52 | 632837 | 7599.95 | 344 | 334 | 83.2 |
| D | 7 | 238 | 18800 | 221.88 | 344 | 334 | 83.2 |
| D | 13 | 153 | 11079 | 129.11 | 344 | 334 | 83.2 |
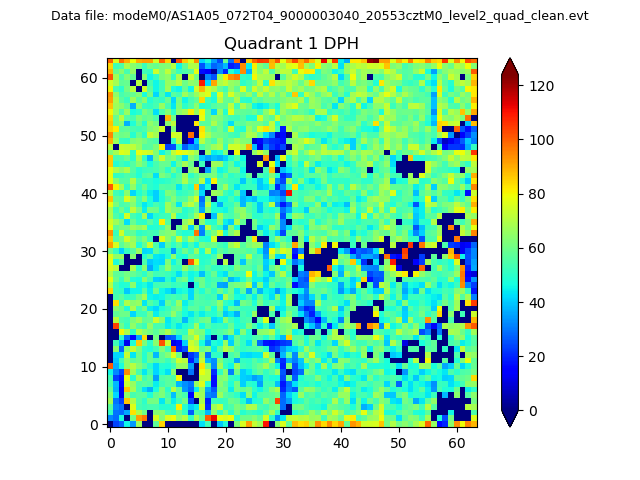
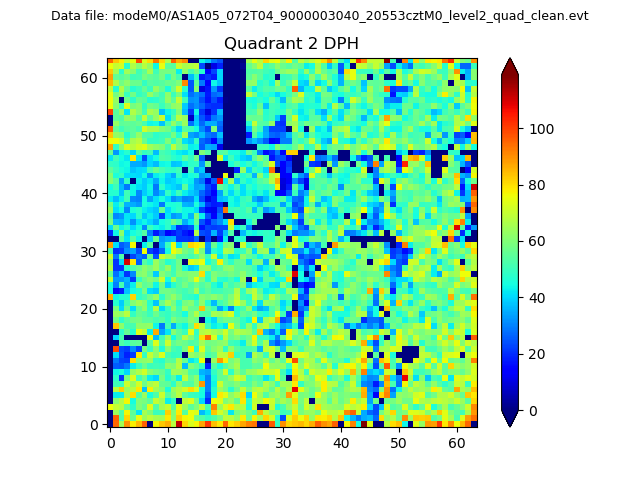
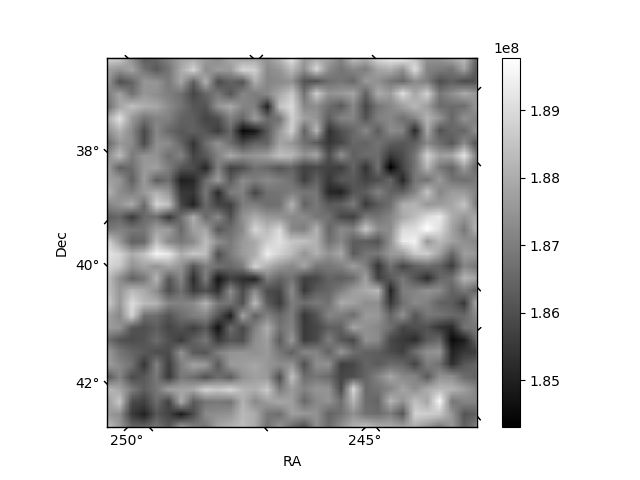
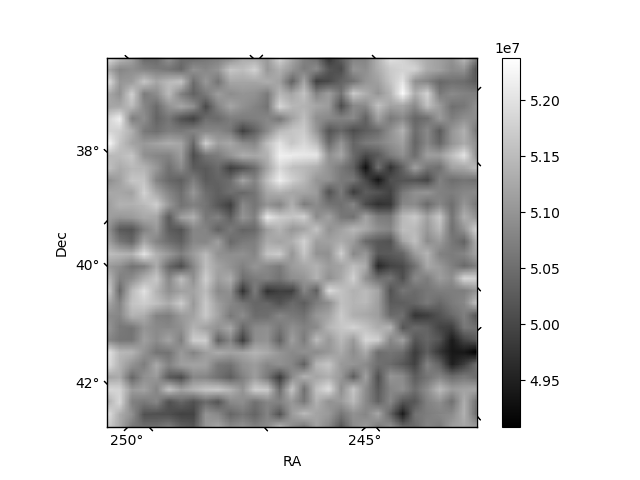
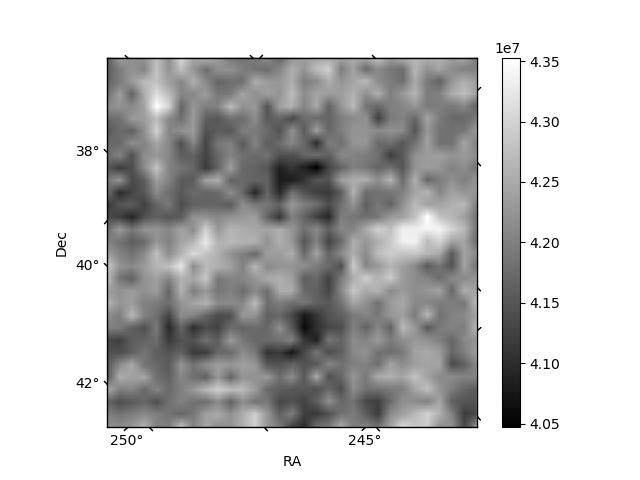
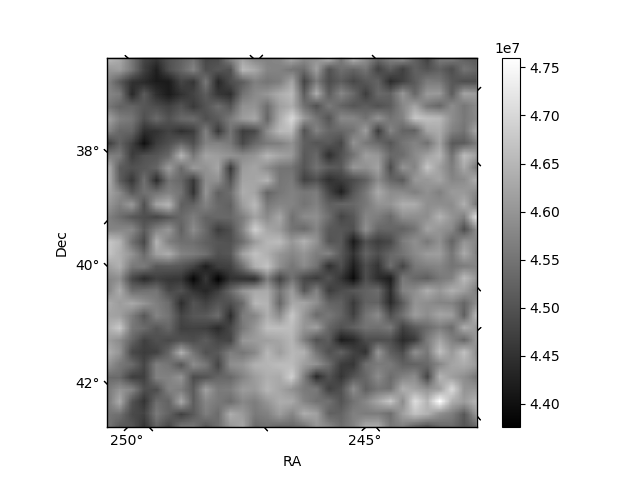
Histogram calculated using DETX and DETY for each event in the final _common_clean file
| Quadrant A | 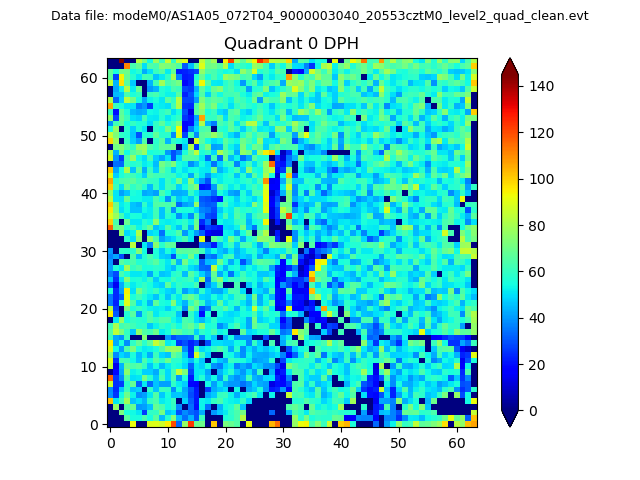 |
 |
Quadrant B |
|---|---|---|---|
| Quadrant D | 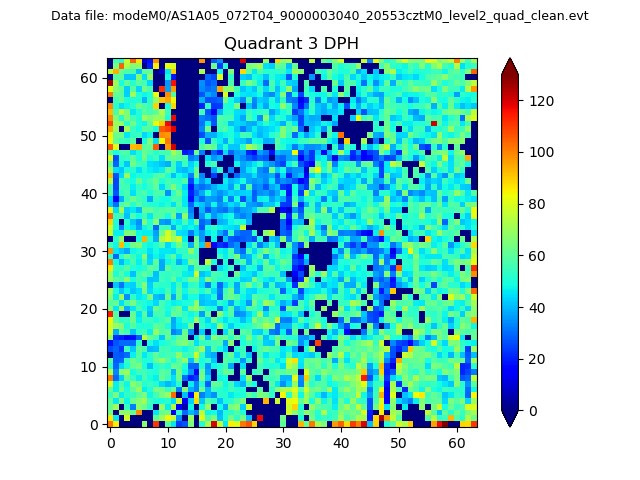 |
 |
Quadrant C |
| Plot type | Count rate plots | Images |
|---|---|---|
| Comparison with Poisson distribution Blue bars denote a histogram of data divided into 1 sec bins. Red curve is a Poisson curve with rate = median count rate of data. |
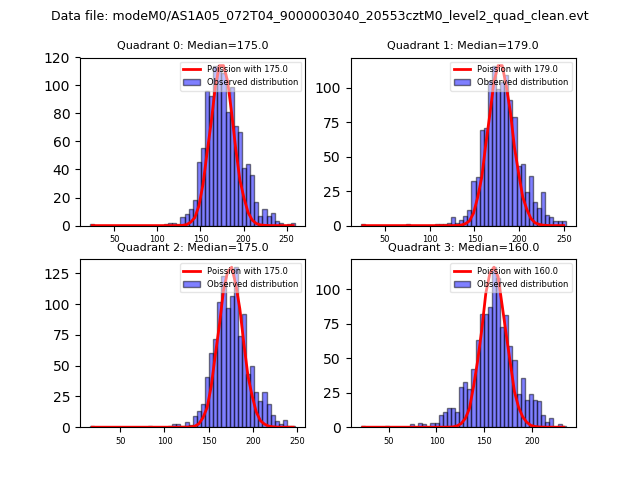 |
 |
| Quadrant-wise count rates Data is divided into 100 sec bins |
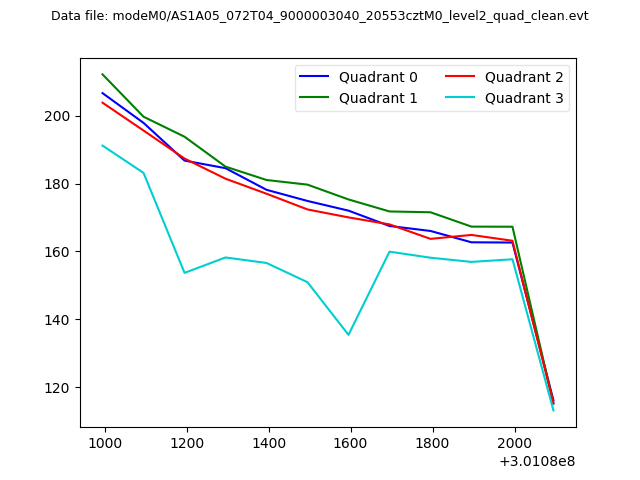 |
|
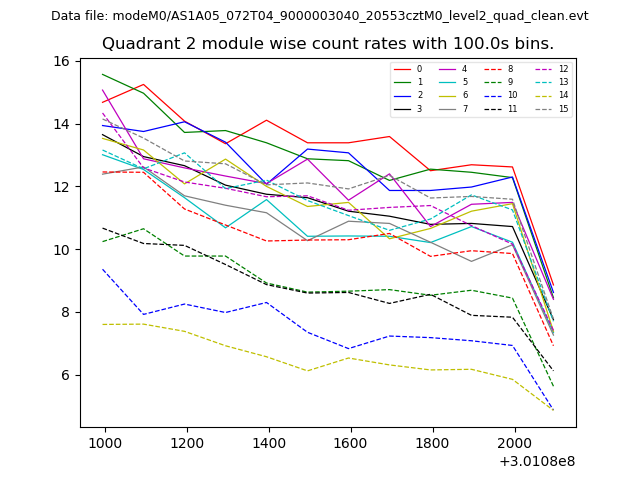
| Module-wise count rates for Quadrant A Data is divided into 100 sec bins |
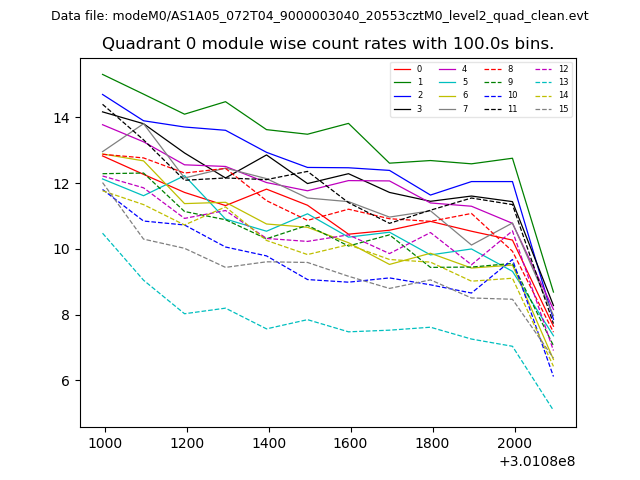 |
 |
| Module-wise count rates for Quadrant B Data is divided into 100 sec bins |
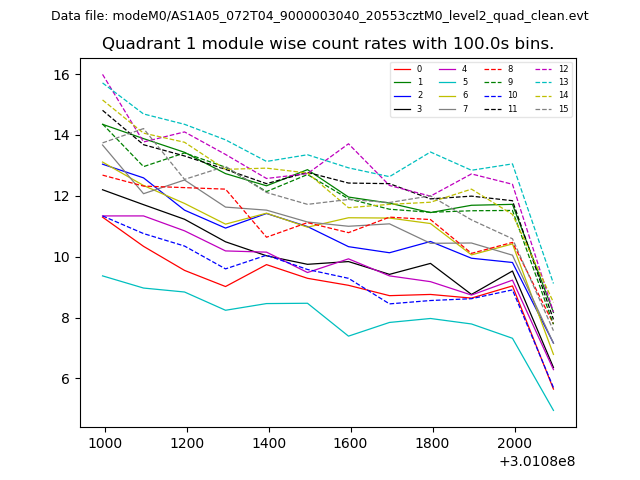 |
 |
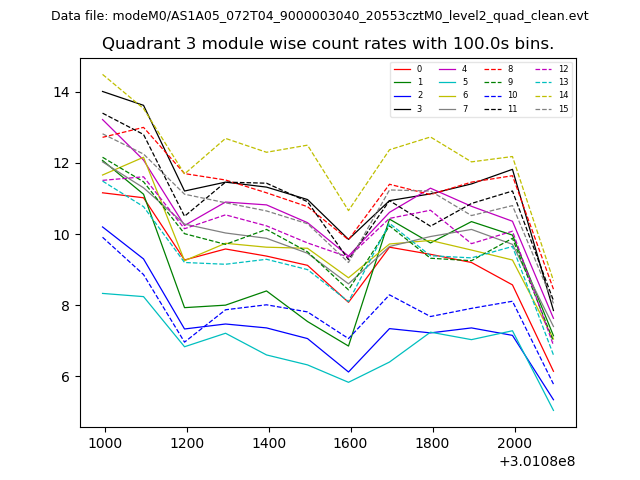
| Module-wise count rates for Quadrant C Data is divided into 100 sec bins |
 |
 |
| Module-wise count rates for Quadrant D Data is divided into 100 sec bins |
 |
 |
| Parameter | Plot |
|---|---|
| CZT HV Monitor | 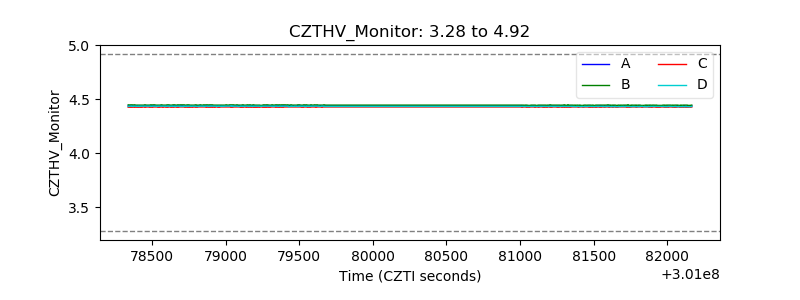 |
| D_VDD |  |
| Temperature 1 | 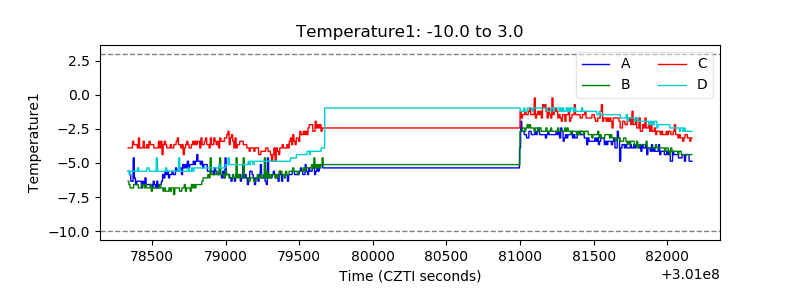 |
| Veto HV Monitor |  |
| Veto LLD | 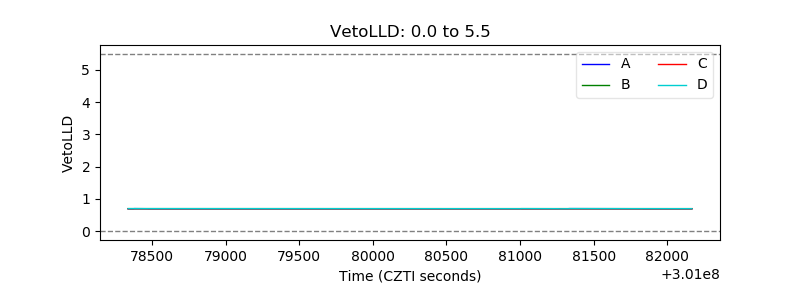 |
| Alpha Counter | 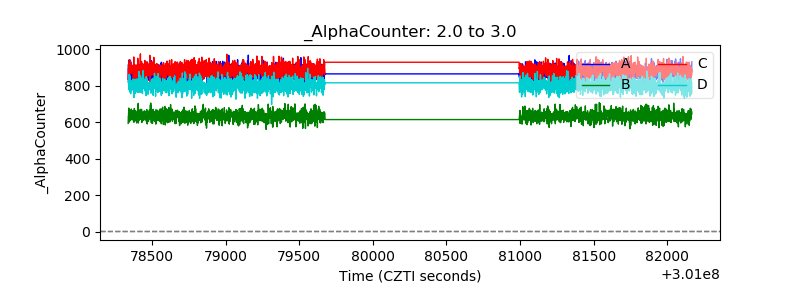 |
| _CPM_Rate | 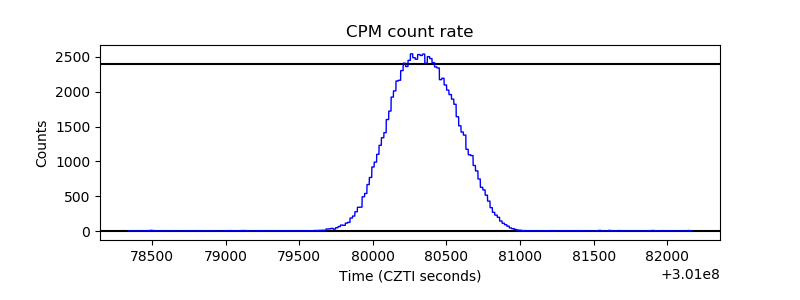 |
| CZT Counter | 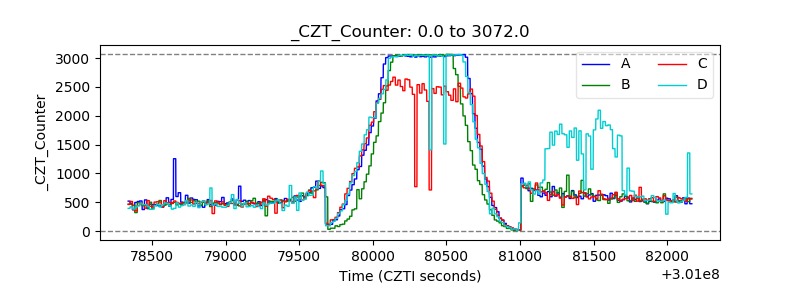 |
| +2.5 Volts monitor |  |
| +5 Volts monitor |  |
| _ROLL_ROT | 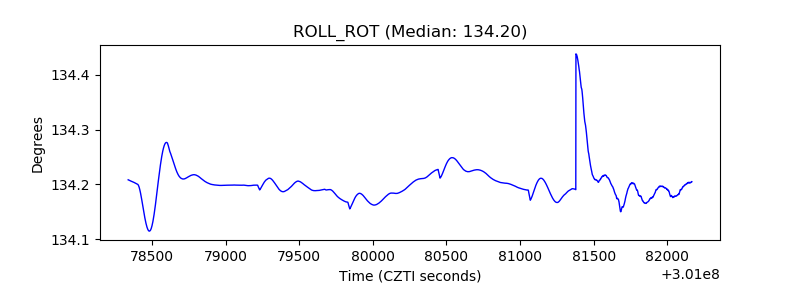 |
| _Roll_DEC | 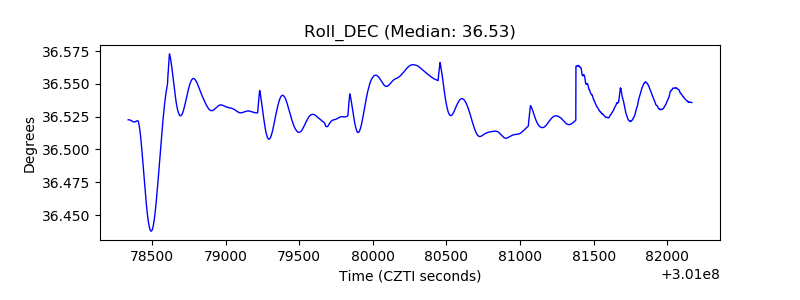 |
| _Roll_RA | 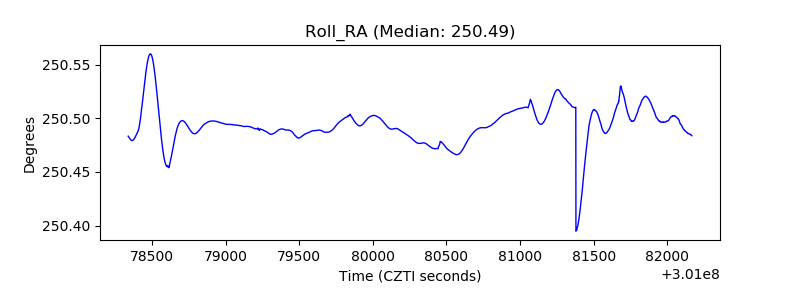 |
| Veto Counter | 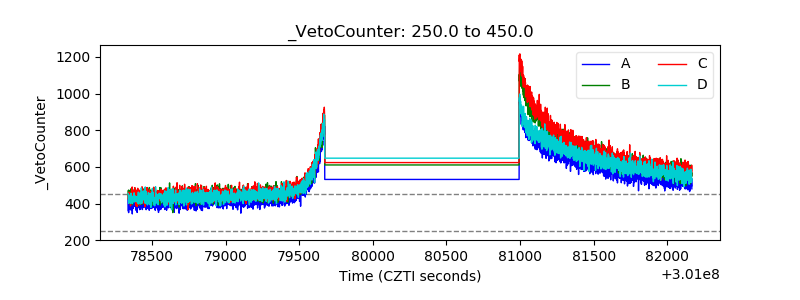 |