| Param | Original file | Final file |
|---|---|---|
| Filename | modeM0/AS1A05_072T04_9000003040_20554cztM0_level2.evt | modeM0/AS1A05_072T04_9000003040_20554cztM0_level2_quad_clean.evt |
| Size (bytes) | 519,756,480 | 104,368,320 |
| Size | 495.7 MB | 99.5 MB |
| Events in quadrant A | 3,240,193 | 688,973 |
| Events in quadrant B | 3,356,136 | 699,940 |
| Events in quadrant C | 3,349,090 | 686,833 |
| Events in quadrant D | 5,370,257 | 647,366 |
| Mode M9 | |||
|---|---|---|---|
| Quadrant | BADHDUFLAG | Total packets | Discarded packets |
| A | 0 | 15 | 0 |
| B | 0 | 16 | 0 |
| C | 0 | 16 | 0 |
| D | 0 | 16 | 0 |
| Mode M0 | |||
|---|---|---|---|
| Quadrant | BADHDUFLAG | Total packets | Discarded packets |
| A | 0 | 13563 | 2 |
| B | 0 | 13845 | 2 |
| C | 0 | 13790 | 2 |
| D | 0 | 20204 | 2 |
| Mode SS | |||
|---|---|---|---|
| Quadrant | BADHDUFLAG | Total packets | Discarded packets |
| A | 0 | 128 | 0 |
| B | 0 | 128 | 0 |
| C | 0 | 128 | 0 |
| D | 0 | 128 | 0 |
| Quadrant | Total seconds | Saturated seconds | Saturation percentage |
|---|---|---|---|
| A | 6268 | 65 | 1.037013% |
| B | 6268 | 77 | 1.228462% |
| C | 6268 | 136 | 2.169751% |
| D | 6268 | 475 | 7.578175% |
Noise dominated data is calculated using 1-second bins in cleaned event files. If a bin has >2000 counts, and if more than 50% of those come from <1% of pixels, then it is considered to be noise-dominated and hence unusable.
| Quadrant | # 1 sec bins | Bins with >0 counts | Bins with >2000 counts | High rate bins dominated by noise | Noise dominated (total time) | Noise dominated (detector-on time) | Marked lightcurve |
|---|---|---|---|---|---|---|---|
| A | 7608 | 6269 | 1 | 1 | 0.01% | 0.02% | 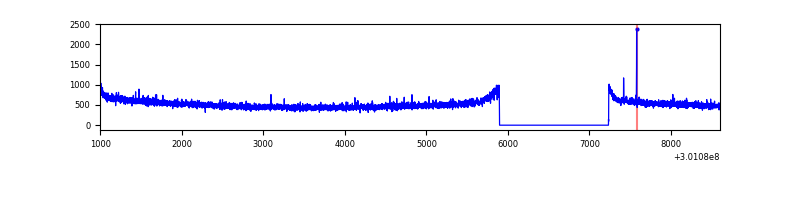 |
| B | 7608 | 6269 | 2 | 2 | 0.03% | 0.03% | 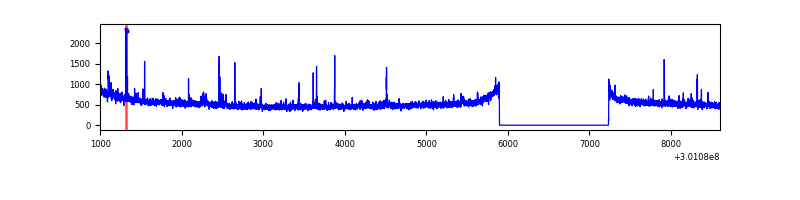 |
| C | 7608 | 6269 | 0 | 0 | 0.00% | 0.00% | 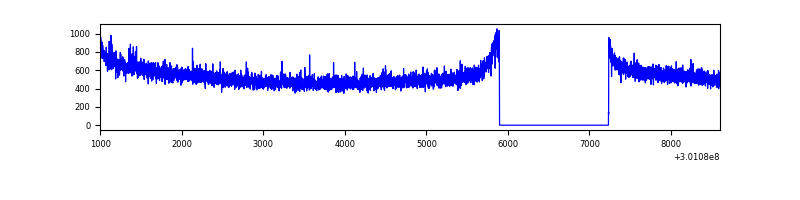 |
| D | 7608 | 6269 | 108 | 108 | 1.42% | 1.72% | 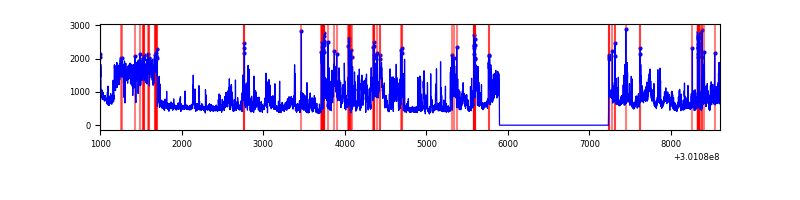 |
Top three noisy pixels from each quadrant. If the there are fewer than three noisy pixels in the level2.evt file, extra rows are filled as -1
| Pixel properties | Quadrant properties | ||||||
|---|---|---|---|---|---|---|---|
| Quadrant | DetID | PixID | Counts | Sigma | Mean | Median | Sigma |
| A | 12 | 96 | 11066 | 61.67 | 834 | 817 | 166.2 |
| A | 8 | 205 | 7784 | 41.92 | 834 | 817 | 166.2 |
| A | 0 | 226 | 7248 | 38.7 | 834 | 817 | 166.2 |
| B | 0 | 189 | 25582 | 163.36 | 831 | 814 | 151.6 |
| B | 3 | 64 | 18570 | 117.11 | 831 | 814 | 151.6 |
| B | 12 | 111 | 17902 | 112.71 | 831 | 814 | 151.6 |
| C | 14 | 238 | 129589 | 684.36 | 817 | 828 | 188.1 |
| C | 8 | 208 | 23397 | 119.95 | 817 | 828 | 188.1 |
| C | 7 | 220 | 7054 | 33.09 | 817 | 828 | 188.1 |
| D | 1 | 52 | 2103018 | 10815.85 | 810 | 788 | 194.4 |
| D | 13 | 153 | 99910 | 509.98 | 810 | 788 | 194.4 |
| D | 7 | 238 | 33094 | 166.21 | 810 | 788 | 194.4 |
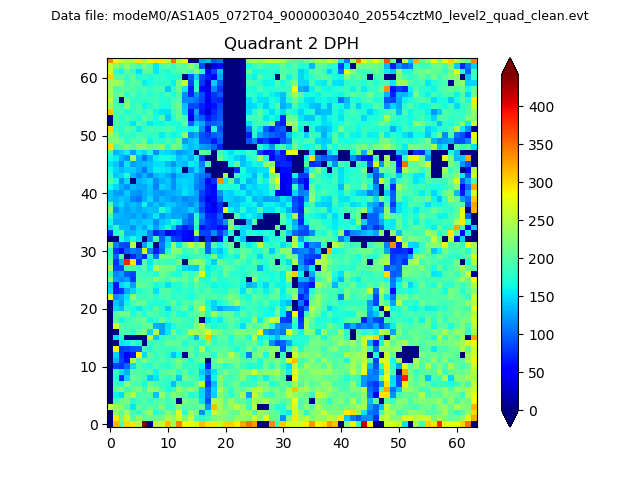
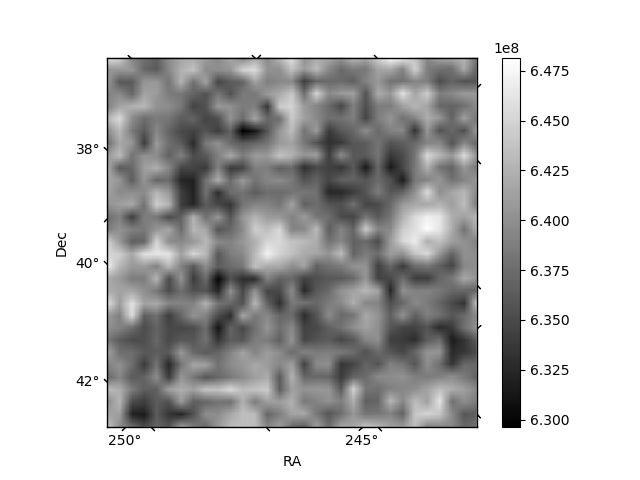
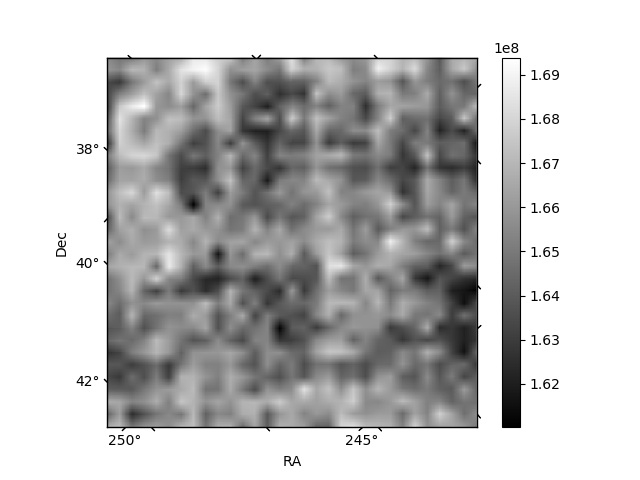
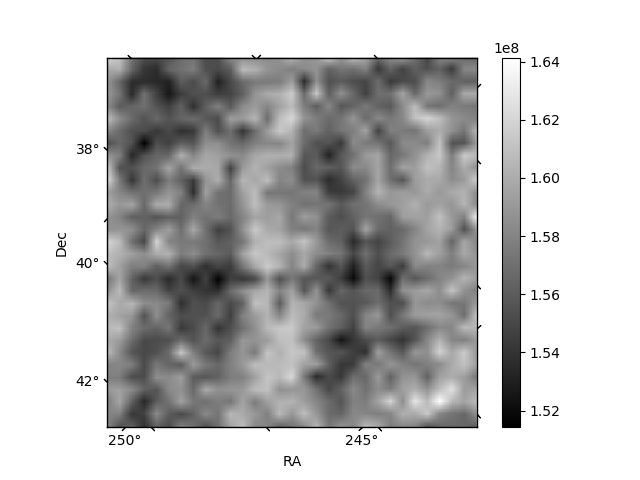
Histogram calculated using DETX and DETY for each event in the final _common_clean file
| Quadrant A | 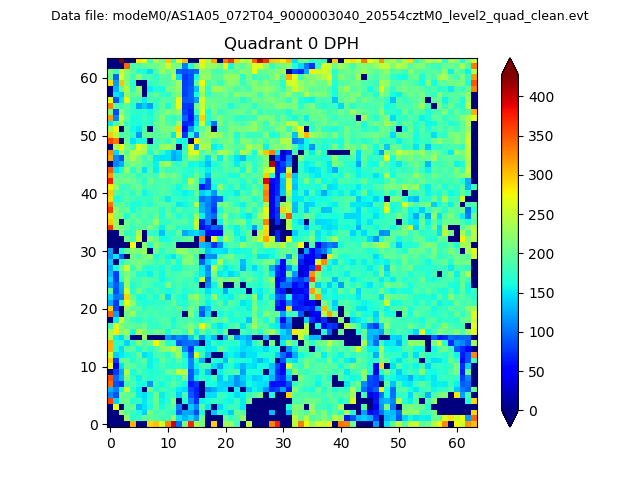 |
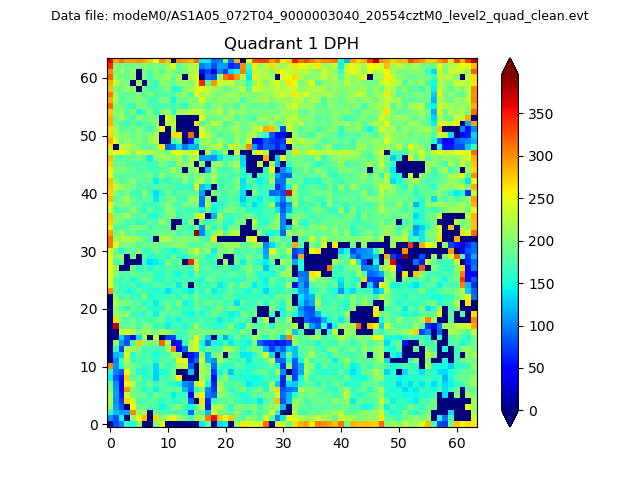 |
Quadrant B |
|---|---|---|---|
| Quadrant D | 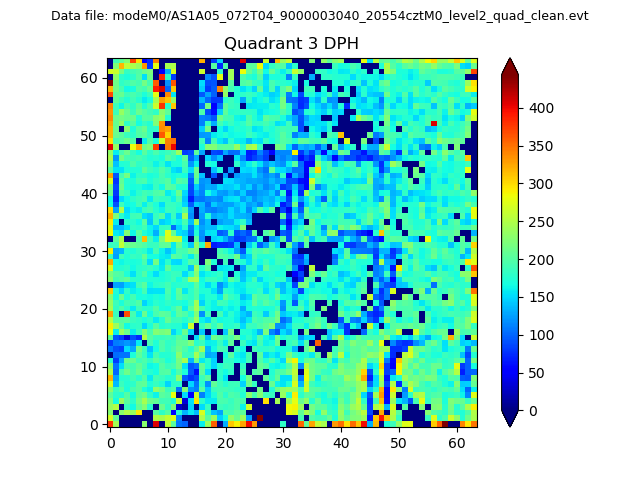 |
 |
Quadrant C |
| Plot type | Count rate plots | Images |
|---|---|---|
| Comparison with Poisson distribution Blue bars denote a histogram of data divided into 1 sec bins. Red curve is a Poisson curve with rate = median count rate of data. |
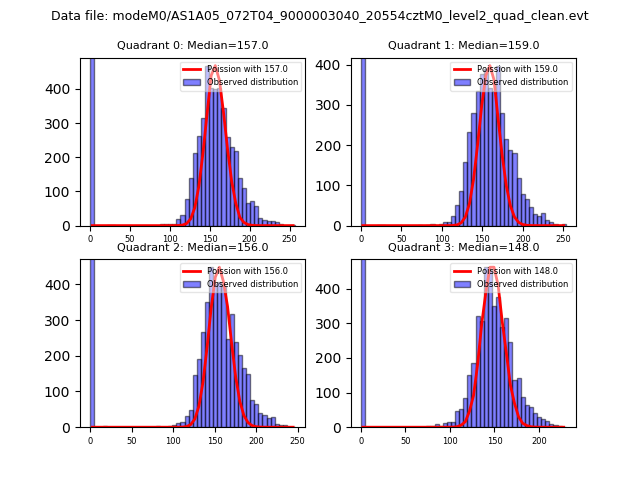 |
 |
| Quadrant-wise count rates Data is divided into 100 sec bins |
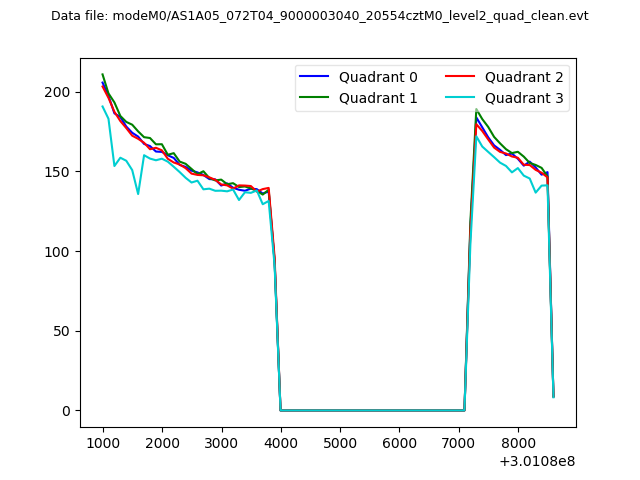 |
|
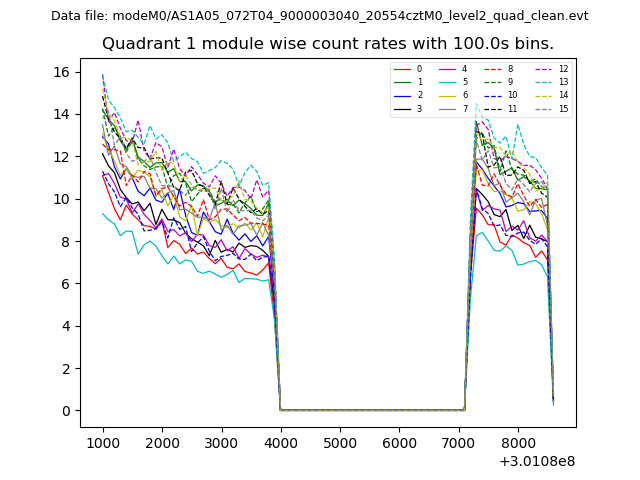
| Module-wise count rates for Quadrant A Data is divided into 100 sec bins |
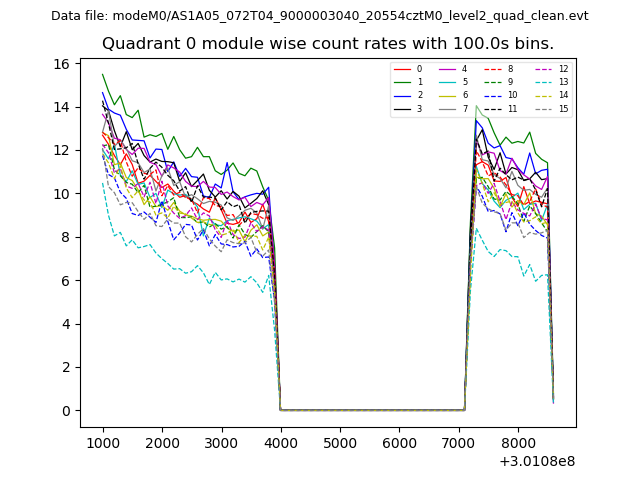 |
 |
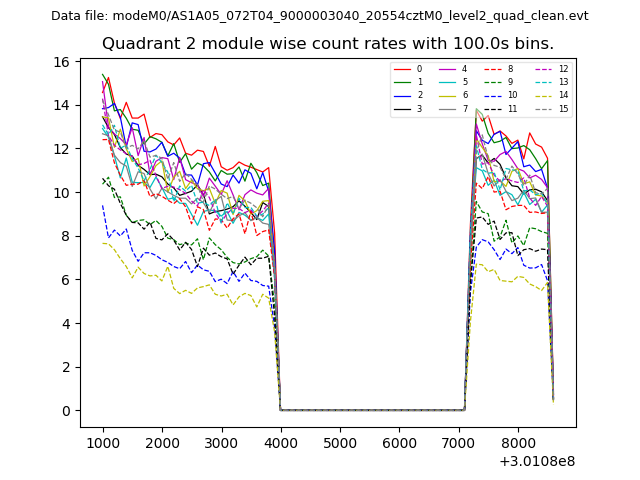
| Module-wise count rates for Quadrant B Data is divided into 100 sec bins |
 |
 |
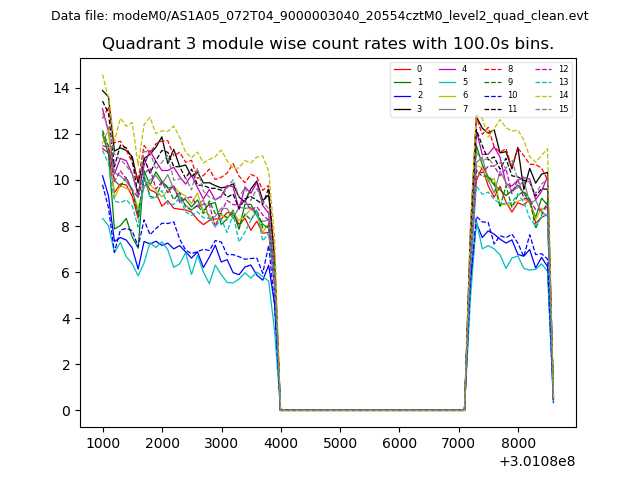
| Module-wise count rates for Quadrant C Data is divided into 100 sec bins |
 |
 |
| Module-wise count rates for Quadrant D Data is divided into 100 sec bins |
 |
 |
| Parameter | Plot |
|---|---|
| CZT HV Monitor | 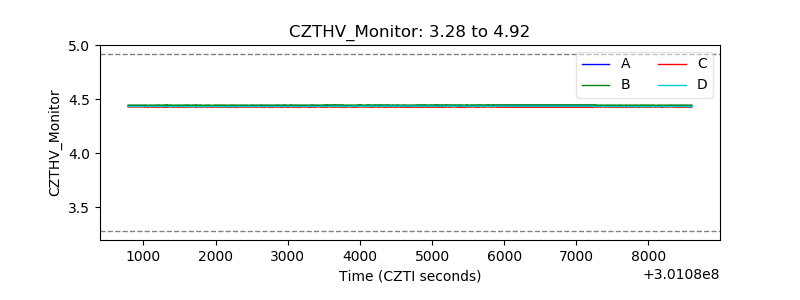 |
| D_VDD | 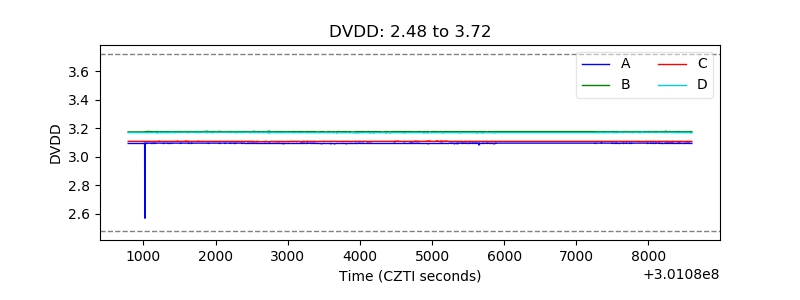 |
| Temperature 1 | 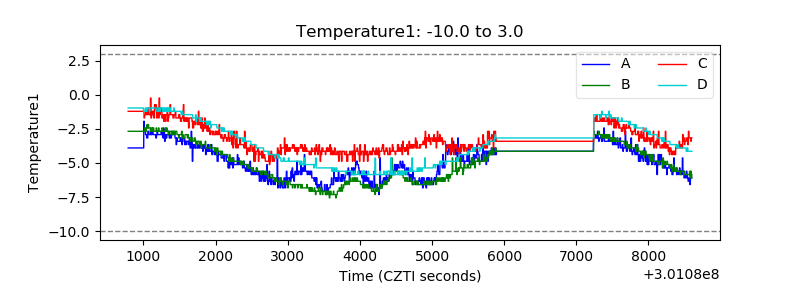 |
| Veto HV Monitor |  |
| Veto LLD | 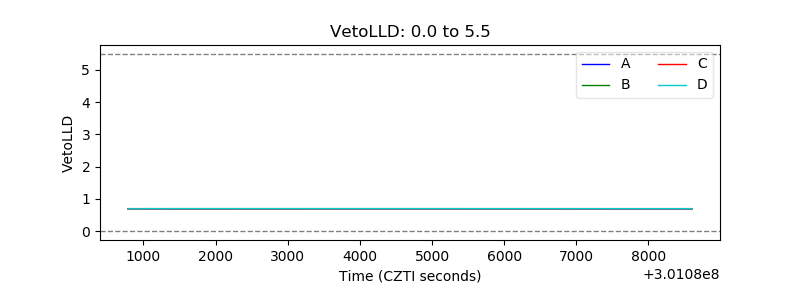 |
| Alpha Counter | 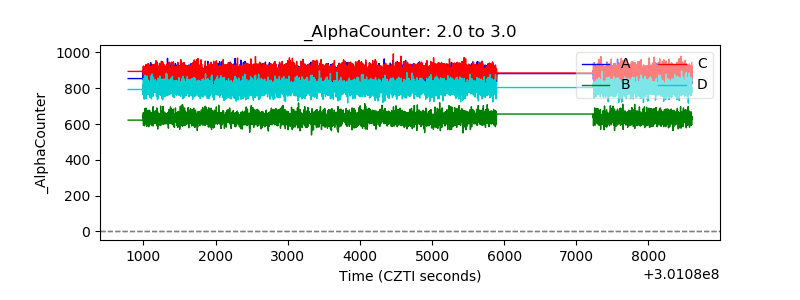 |
| _CPM_Rate | 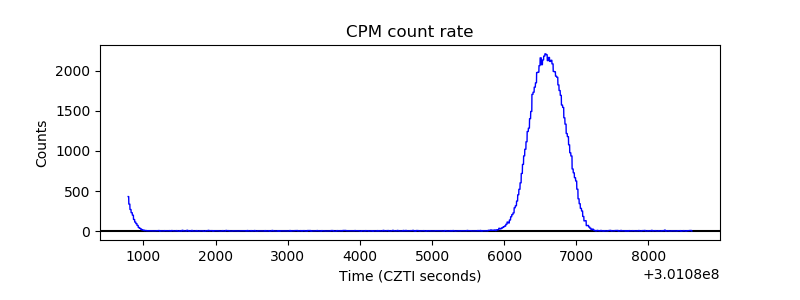 |
| CZT Counter | 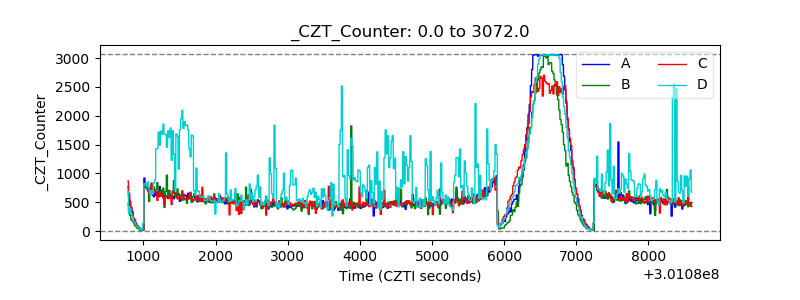 |
| +2.5 Volts monitor |  |
| +5 Volts monitor |  |
| _ROLL_ROT | 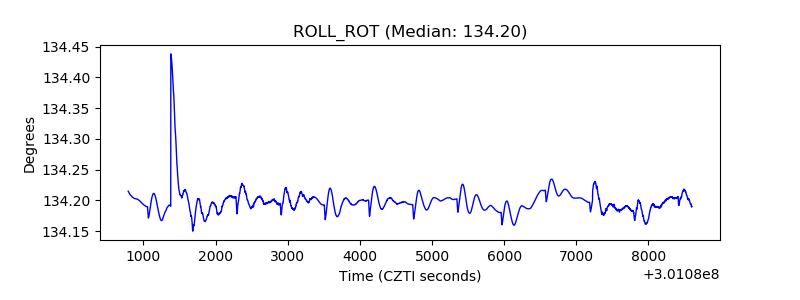 |
| _Roll_DEC | 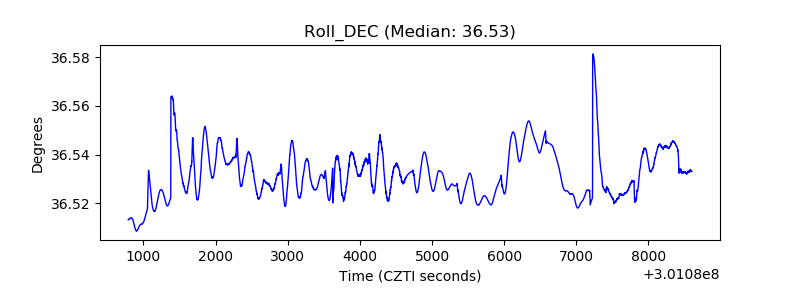 |
| _Roll_RA | 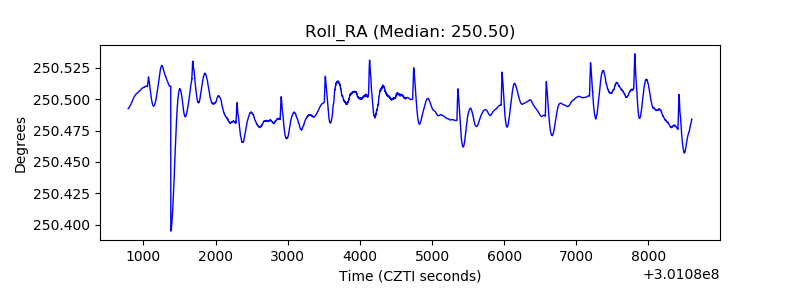 |
| Veto Counter | 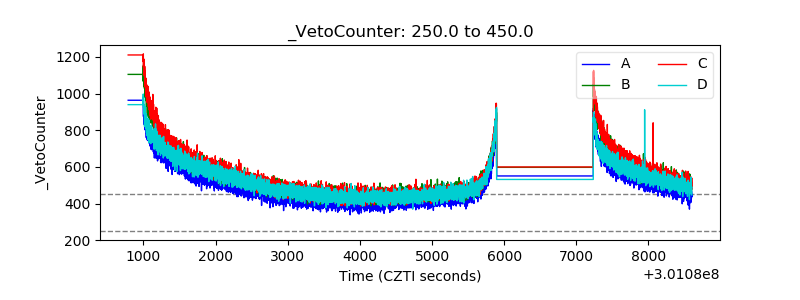 |