| Param | Original file | Final file |
|---|---|---|
| Filename | modeM0/AS1A05_072T04_9000003040_20556cztM0_level2.evt | modeM0/AS1A05_072T04_9000003040_20556cztM0_level2_quad_clean.evt |
| Size (bytes) | 434,041,920 | 93,657,600 |
| Size | 413.9 MB | 89.3 MB |
| Events in quadrant A | 3,054,154 | 603,225 |
| Events in quadrant B | 3,226,391 | 611,542 |
| Events in quadrant C | 3,133,556 | 594,709 |
| Events in quadrant D | 3,290,979 | 575,672 |
| Mode M9 | |||
|---|---|---|---|
| Quadrant | BADHDUFLAG | Total packets | Discarded packets |
| A | 0 | 19 | 0 |
| B | 0 | 20 | 0 |
| C | 0 | 20 | 0 |
| D | 0 | 20 | 0 |
| Mode M0 | |||
|---|---|---|---|
| Quadrant | BADHDUFLAG | Total packets | Discarded packets |
| A | 0 | 13334 | 3 |
| B | 0 | 13738 | 2 |
| C | 0 | 13408 | 2 |
| D | 0 | 14235 | 2 |
| Mode SS | |||
|---|---|---|---|
| Quadrant | BADHDUFLAG | Total packets | Discarded packets |
| A | 0 | 130 | 0 |
| B | 0 | 130 | 0 |
| C | 0 | 130 | 0 |
| D | 0 | 130 | 0 |
| Quadrant | Total seconds | Saturated seconds | Saturation percentage |
|---|---|---|---|
| A | 6472 | 17 | 0.262670% |
| B | 6472 | 34 | 0.525340% |
| C | 6472 | 62 | 0.957973% |
| D | 6472 | 70 | 1.081582% |
Noise dominated data is calculated using 1-second bins in cleaned event files. If a bin has >2000 counts, and if more than 50% of those come from <1% of pixels, then it is considered to be noise-dominated and hence unusable.
| Quadrant | # 1 sec bins | Bins with >0 counts | Bins with >2000 counts | High rate bins dominated by noise | Noise dominated (total time) | Noise dominated (detector-on time) | Marked lightcurve |
|---|---|---|---|---|---|---|---|
| A | 7547 | 6473 | 0 | 0 | 0.00% | 0.00% | 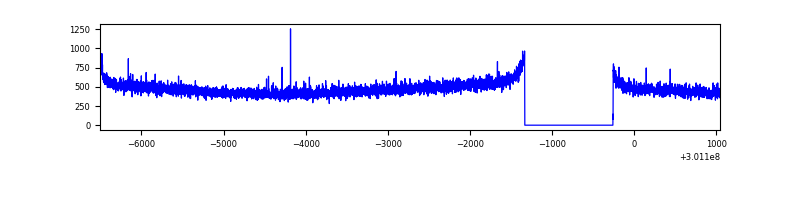 |
| B | 7547 | 6473 | 6 | 6 | 0.08% | 0.09% |  |
| C | 7547 | 6473 | 0 | 0 | 0.00% | 0.00% | 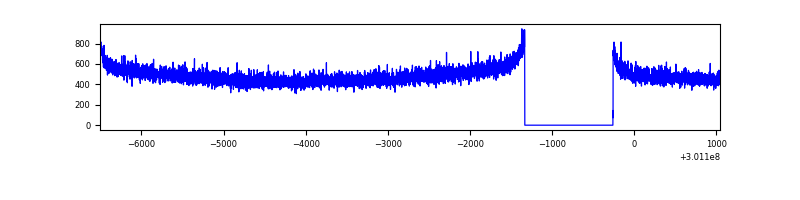 |
| D | 7547 | 6473 | 31 | 31 | 0.41% | 0.48% | 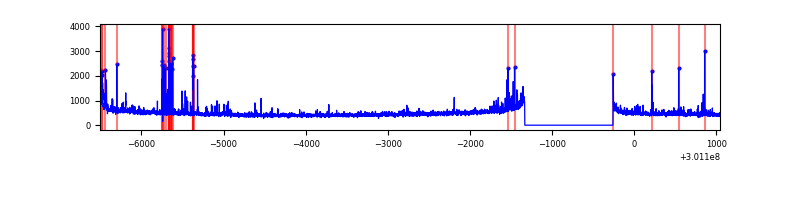 |
Top three noisy pixels from each quadrant. If the there are fewer than three noisy pixels in the level2.evt file, extra rows are filled as -1
| Pixel properties | Quadrant properties | ||||||
|---|---|---|---|---|---|---|---|
| Quadrant | DetID | PixID | Counts | Sigma | Mean | Median | Sigma |
| A | 8 | 205 | 7280 | 40.68 | 790 | 775 | 159.9 |
| A | 0 | 226 | 6873 | 38.13 | 790 | 775 | 159.9 |
| A | 3 | 137 | 6484 | 35.7 | 790 | 775 | 159.9 |
| B | 0 | 197 | 34696 | 227.41 | 791 | 772 | 149.2 |
| B | 3 | 64 | 30818 | 201.41 | 791 | 772 | 149.2 |
| B | 12 | 111 | 17797 | 114.13 | 791 | 772 | 149.2 |
| C | 14 | 238 | 121640 | 674.75 | 769 | 776 | 179.1 |
| C | 8 | 208 | 10663 | 55.2 | 769 | 776 | 179.1 |
| C | 13 | 61 | 5421 | 25.93 | 769 | 776 | 179.1 |
| D | 1 | 52 | 135989 | 723.55 | 770 | 750 | 186.9 |
| D | 13 | 153 | 123581 | 657.16 | 770 | 750 | 186.9 |
| D | 13 | 104 | 49006 | 258.18 | 770 | 750 | 186.9 |
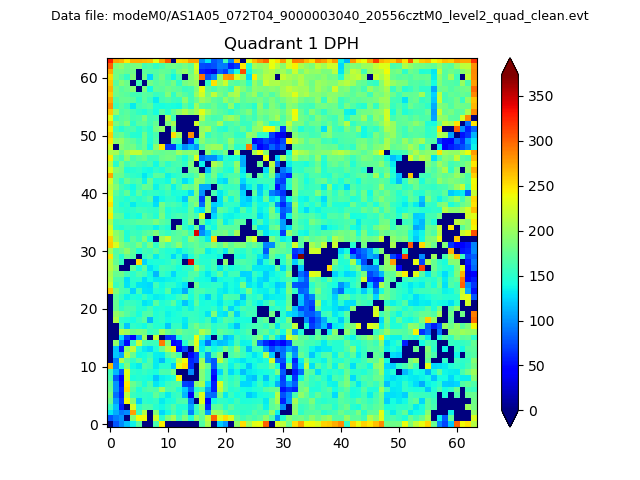
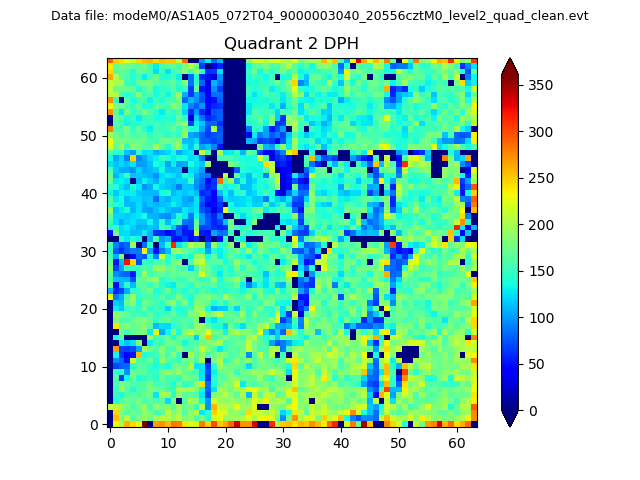
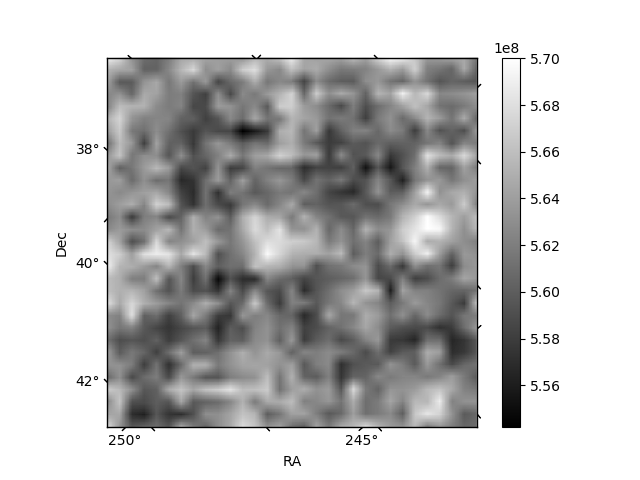
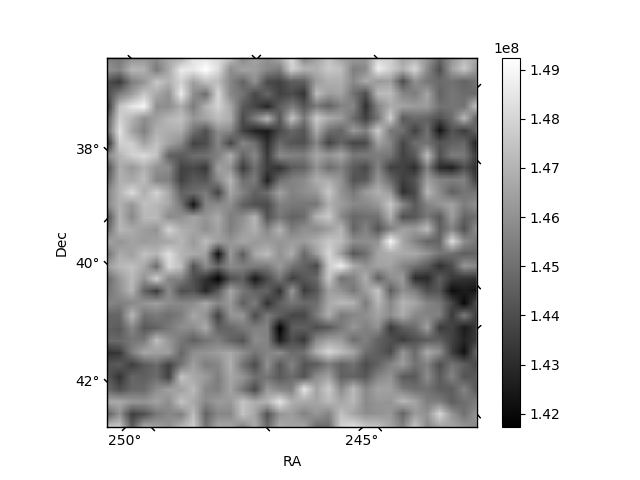
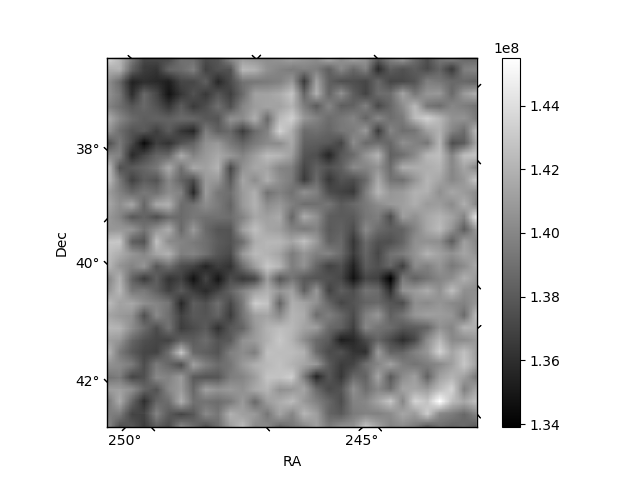
Histogram calculated using DETX and DETY for each event in the final _common_clean file
| Quadrant A | 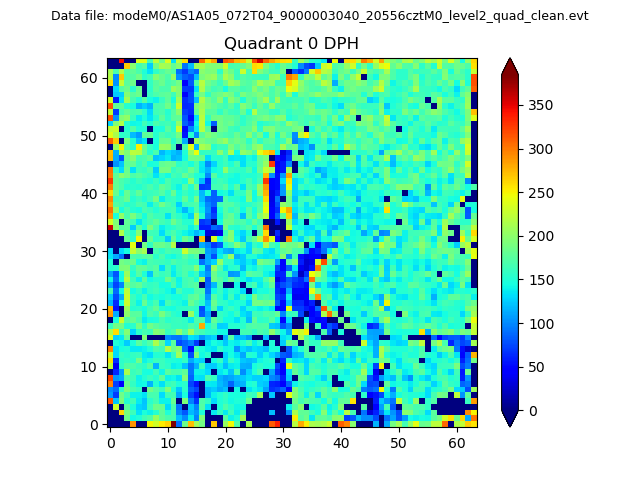 |
 |
Quadrant B |
|---|---|---|---|
| Quadrant D | 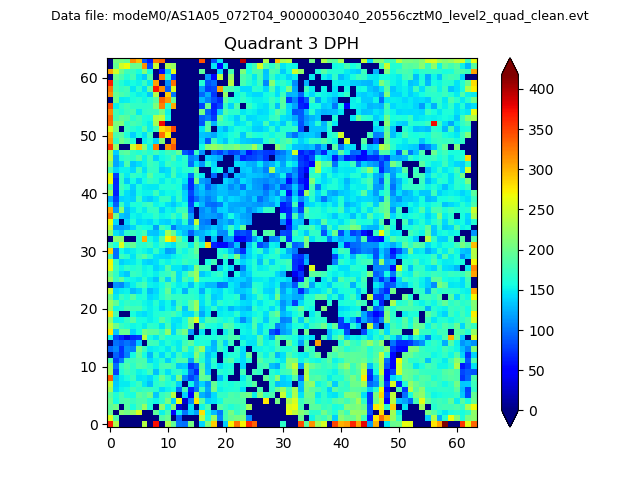 |
 |
Quadrant C |
| Plot type | Count rate plots | Images |
|---|---|---|
| Comparison with Poisson distribution Blue bars denote a histogram of data divided into 1 sec bins. Red curve is a Poisson curve with rate = median count rate of data. |
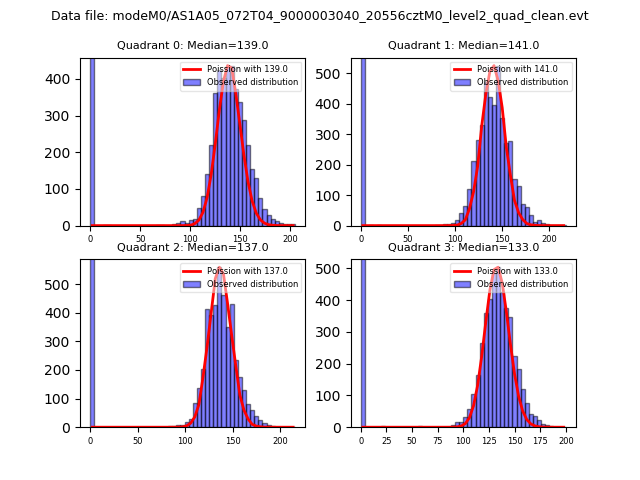 |
 |
| Quadrant-wise count rates Data is divided into 100 sec bins |
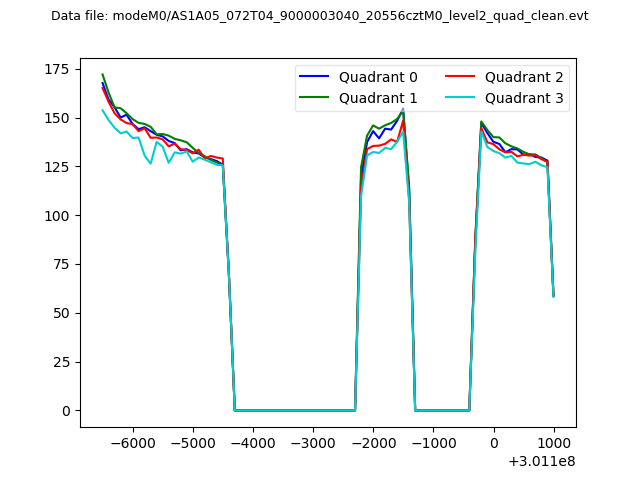 |
|
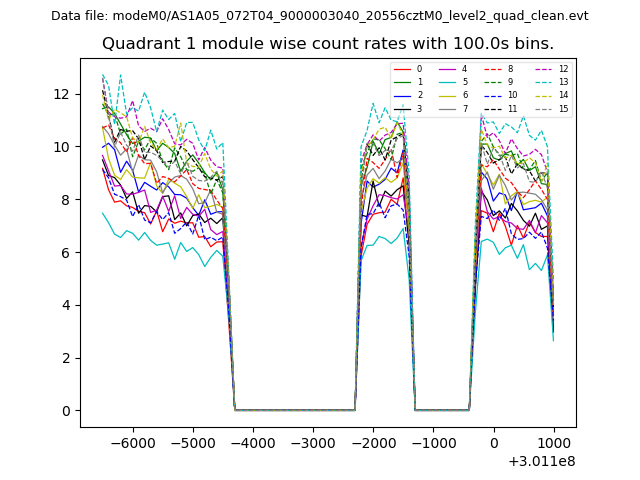
| Module-wise count rates for Quadrant A Data is divided into 100 sec bins |
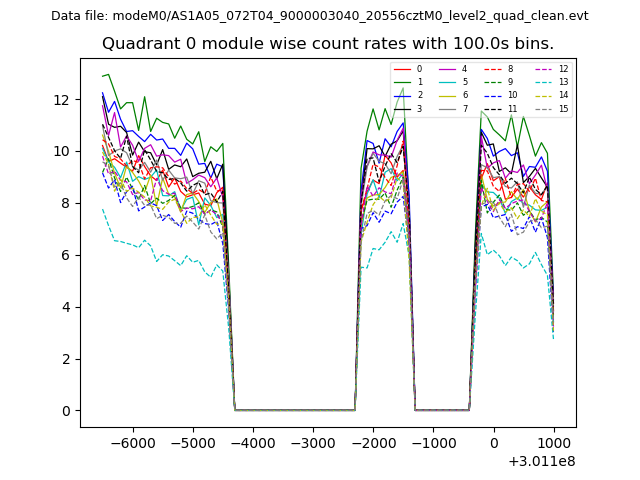 |
 |
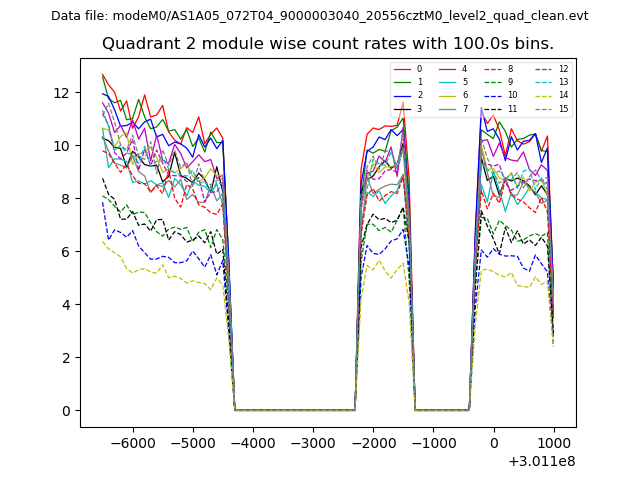
| Module-wise count rates for Quadrant B Data is divided into 100 sec bins |
 |
 |
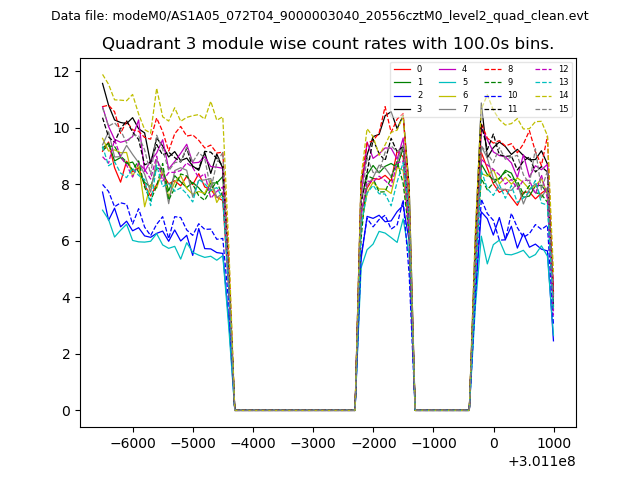
| Module-wise count rates for Quadrant C Data is divided into 100 sec bins |
 |
 |
| Module-wise count rates for Quadrant D Data is divided into 100 sec bins |
 |
 |
| Parameter | Plot |
|---|---|
| CZT HV Monitor | 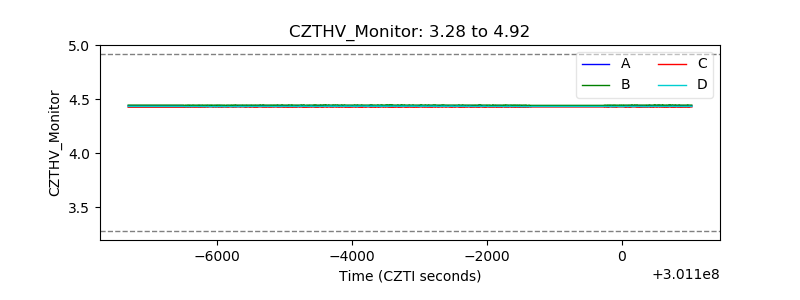 |
| D_VDD |  |
| Temperature 1 | 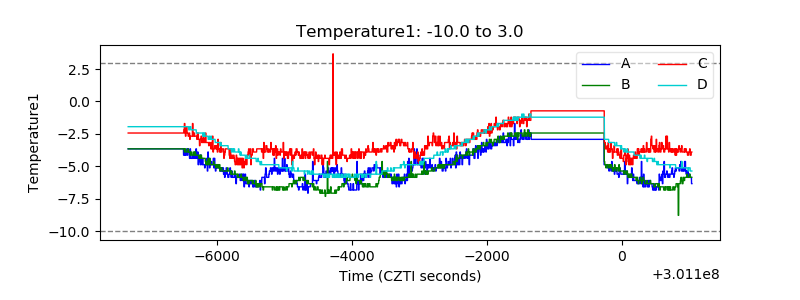 |
| Veto HV Monitor | 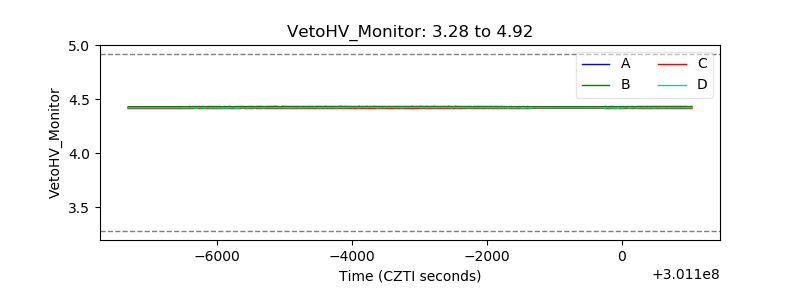 |
| Veto LLD | 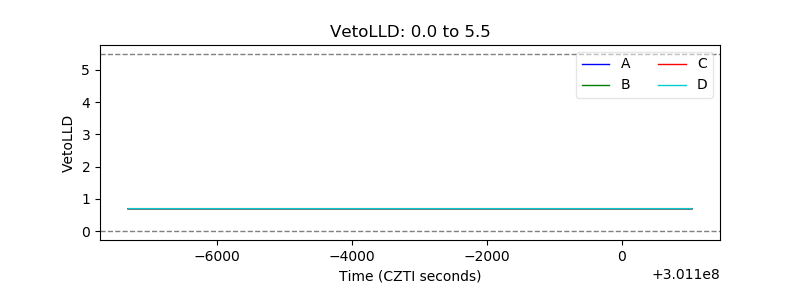 |
| Alpha Counter | 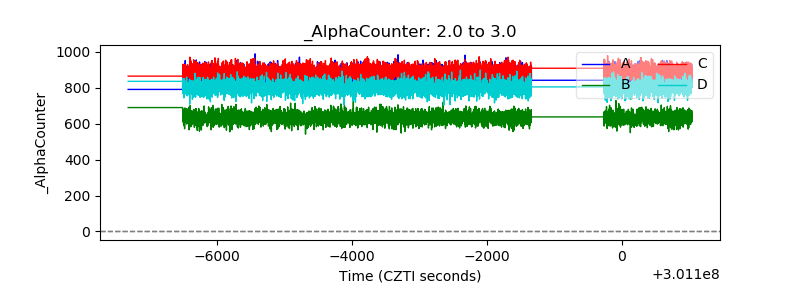 |
| _CPM_Rate | 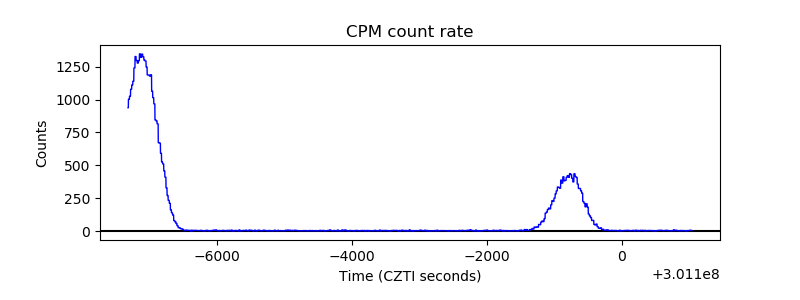 |
| CZT Counter | 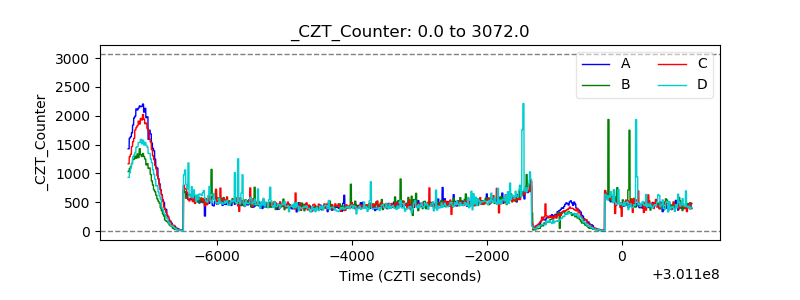 |
| +2.5 Volts monitor |  |
| +5 Volts monitor |  |
| _ROLL_ROT | 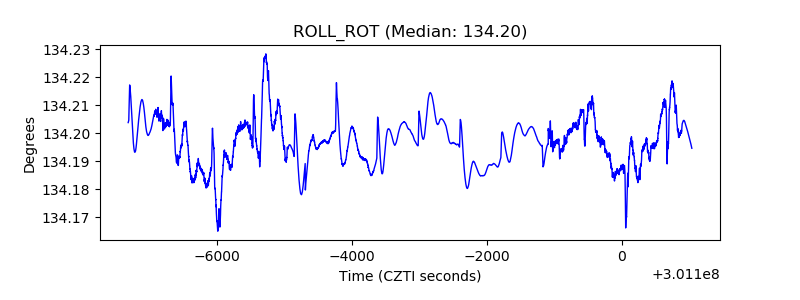 |
| _Roll_DEC | 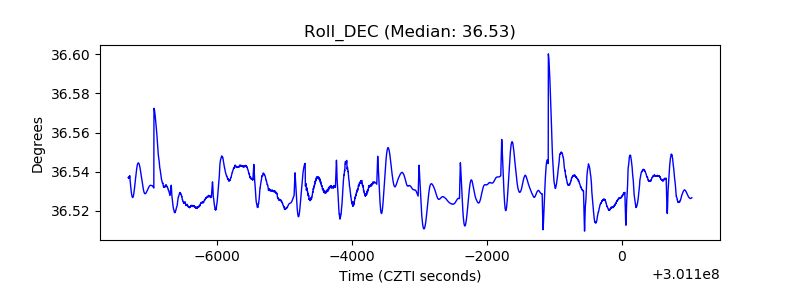 |
| _Roll_RA | 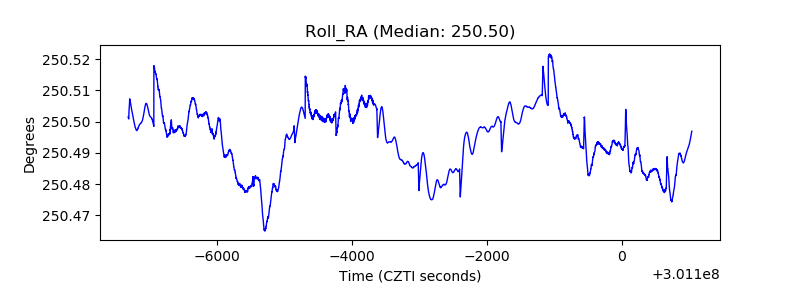 |
| Veto Counter | 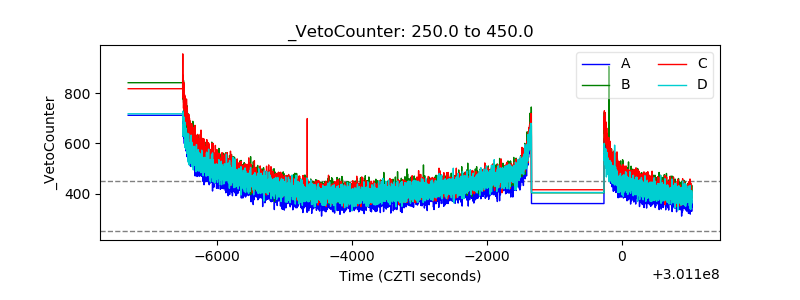 |