| Param | Original file | Final file |
|---|---|---|
| Filename | modeM0/AS1A05_072T04_9000003040_20558cztM0_level2.evt | modeM0/AS1A05_072T04_9000003040_20558cztM0_level2_quad_clean.evt |
| Size (bytes) | 553,415,040 | 113,754,240 |
| Size | 527.8 MB | 108.5 MB |
| Events in quadrant A | 3,844,113 | 727,746 |
| Events in quadrant B | 3,877,513 | 734,274 |
| Events in quadrant C | 3,927,902 | 717,861 |
| Events in quadrant D | 4,562,887 | 704,491 |
| Mode M9 | |||
|---|---|---|---|
| Quadrant | BADHDUFLAG | Total packets | Discarded packets |
| A | 0 | 10 | 0 |
| B | 0 | 10 | 0 |
| C | 0 | 10 | 0 |
| D | 0 | 10 | 0 |
| Mode M0 | |||
|---|---|---|---|
| Quadrant | BADHDUFLAG | Total packets | Discarded packets |
| A | 0 | 16805 | 2 |
| B | 0 | 16772 | 2 |
| C | 0 | 16910 | 2 |
| D | 0 | 19000 | 2 |
| Mode SS | |||
|---|---|---|---|
| Quadrant | BADHDUFLAG | Total packets | Discarded packets |
| A | 0 | 164 | 0 |
| B | 0 | 164 | 0 |
| C | 0 | 164 | 0 |
| D | 0 | 164 | 0 |
| Quadrant | Total seconds | Saturated seconds | Saturation percentage |
|---|---|---|---|
| A | 8073 | 86 | 1.065279% |
| B | 8073 | 130 | 1.610306% |
| C | 8074 | 143 | 1.771117% |
| D | 8074 | 98 | 1.213773% |
Noise dominated data is calculated using 1-second bins in cleaned event files. If a bin has >2000 counts, and if more than 50% of those come from <1% of pixels, then it is considered to be noise-dominated and hence unusable.
| Quadrant | # 1 sec bins | Bins with >0 counts | Bins with >2000 counts | High rate bins dominated by noise | Noise dominated (total time) | Noise dominated (detector-on time) | Marked lightcurve |
|---|---|---|---|---|---|---|---|
| A | 9023 | 8075 | 0 | 0 | 0.00% | 0.00% | 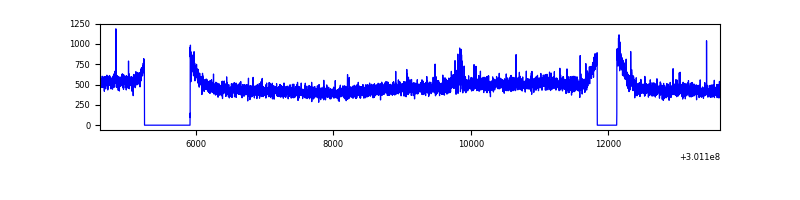 |
| B | 9023 | 8075 | 2 | 2 | 0.02% | 0.02% | 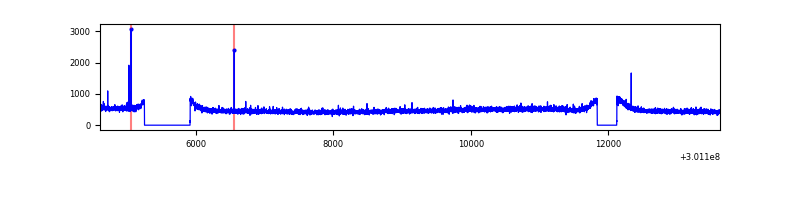 |
| C | 9024 | 8076 | 0 | 0 | 0.00% | 0.00% |  |
| D | 9024 | 8076 | 32 | 32 | 0.35% | 0.40% | 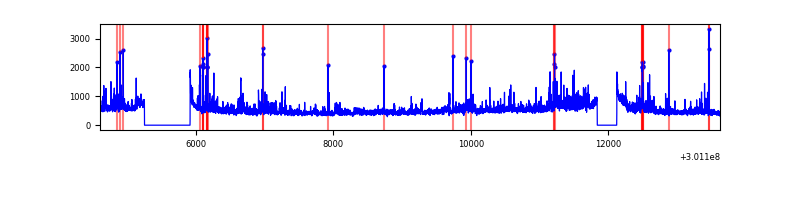 |
Top three noisy pixels from each quadrant. If the there are fewer than three noisy pixels in the level2.evt file, extra rows are filled as -1
| Pixel properties | Quadrant properties | ||||||
|---|---|---|---|---|---|---|---|
| Quadrant | DetID | PixID | Counts | Sigma | Mean | Median | Sigma |
| A | 14 | 239 | 38567 | 189.61 | 983 | 961 | 198.3 |
| A | 11 | 29 | 14130 | 66.4 | 983 | 961 | 198.3 |
| A | 0 | 226 | 8548 | 38.25 | 983 | 961 | 198.3 |
| B | 12 | 111 | 23399 | 118.75 | 981 | 955 | 189.0 |
| B | 11 | 111 | 20814 | 105.08 | 981 | 955 | 189.0 |
| B | 14 | 111 | 17758 | 88.91 | 981 | 955 | 189.0 |
| C | 14 | 238 | 147501 | 654.25 | 957 | 963 | 224.0 |
| C | 3 | 233 | 41345 | 180.29 | 957 | 963 | 224.0 |
| C | 13 | 61 | 6782 | 25.98 | 957 | 963 | 224.0 |
| D | 5 | 222 | 441982 | 1899.43 | 961 | 934 | 232.2 |
| D | 13 | 153 | 124326 | 531.4 | 961 | 934 | 232.2 |
| D | 1 | 52 | 118402 | 505.89 | 961 | 934 | 232.2 |
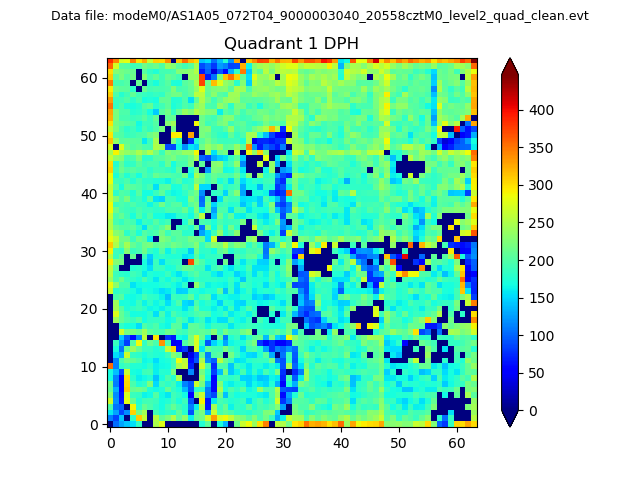
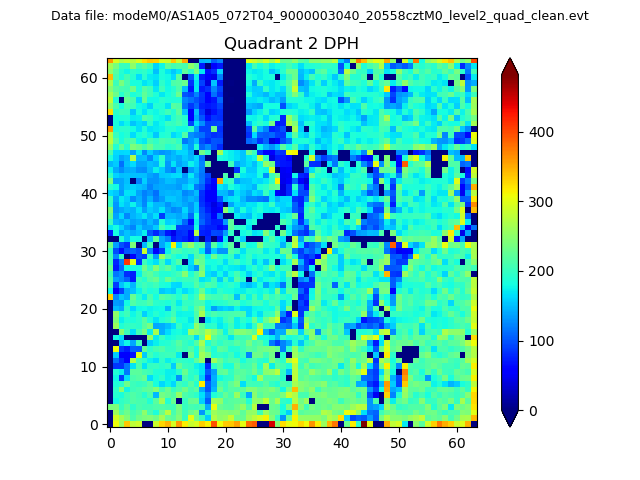
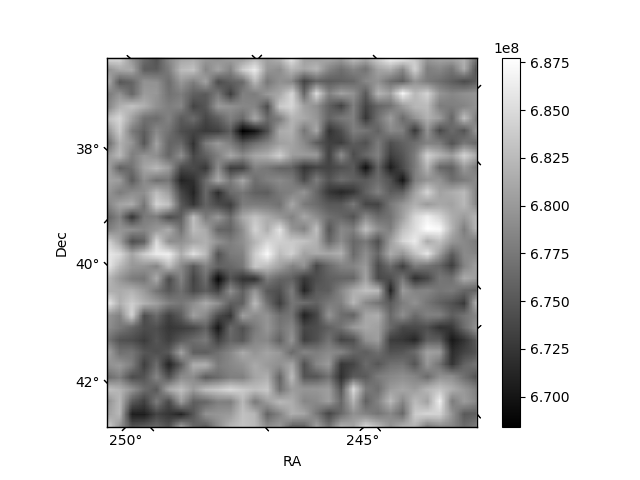
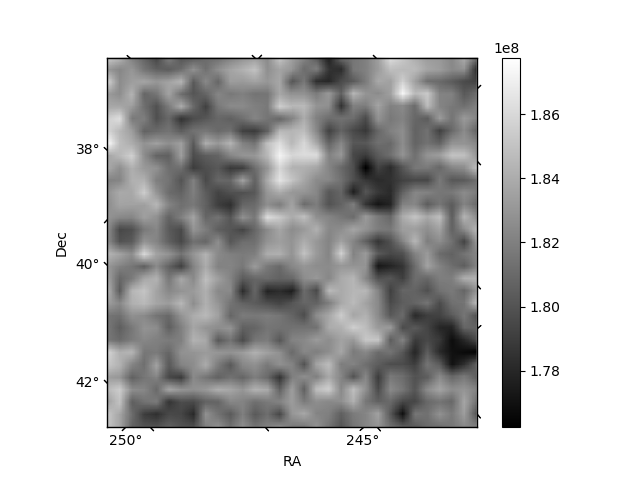
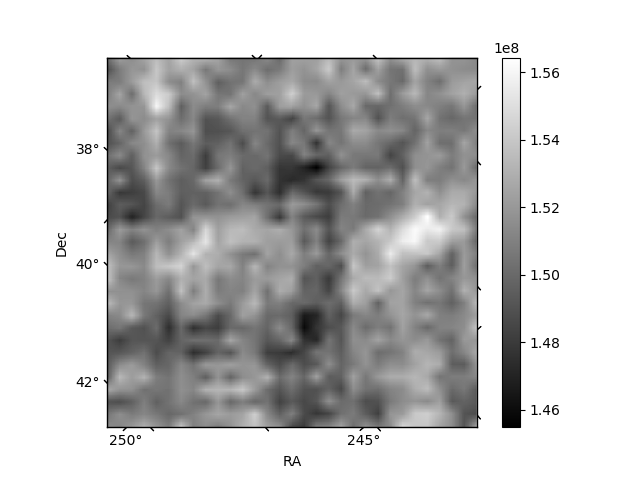
Histogram calculated using DETX and DETY for each event in the final _common_clean file
| Quadrant A | 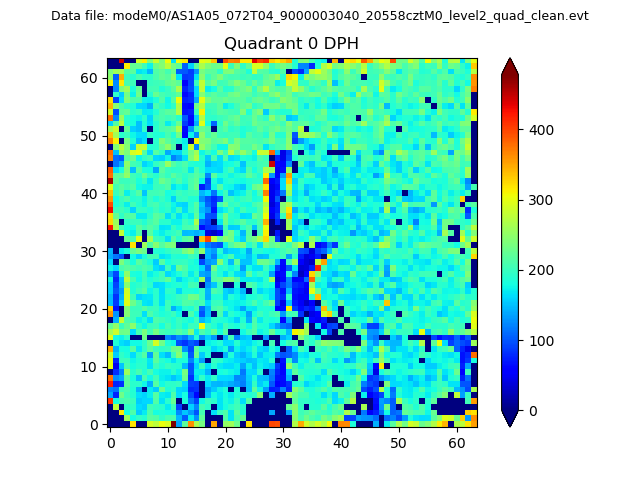 |
 |
Quadrant B |
|---|---|---|---|
| Quadrant D | 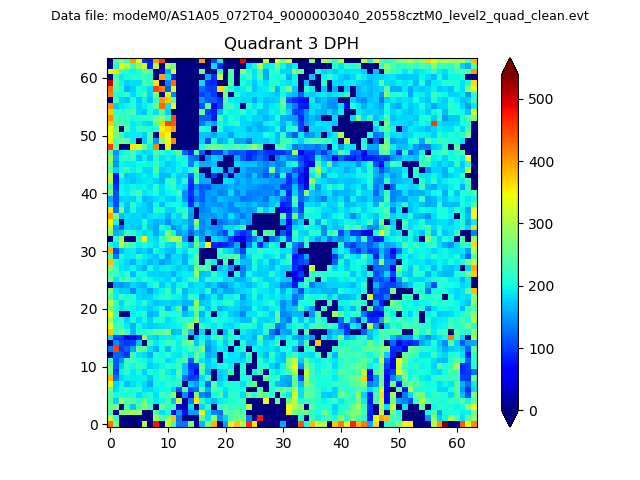 |
 |
Quadrant C |
| Plot type | Count rate plots | Images |
|---|---|---|
| Comparison with Poisson distribution Blue bars denote a histogram of data divided into 1 sec bins. Red curve is a Poisson curve with rate = median count rate of data. |
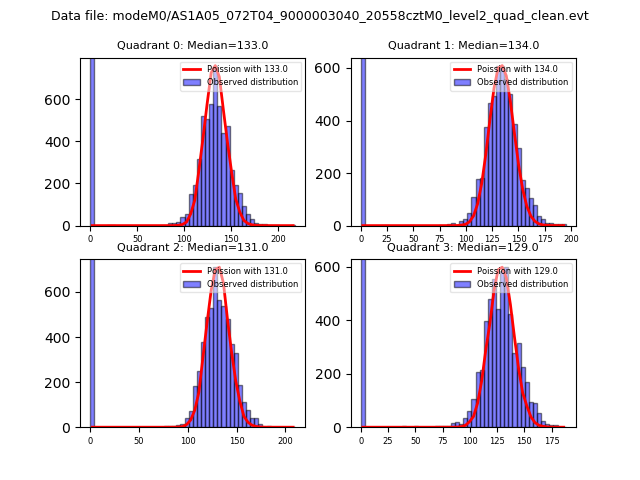 |
 |
| Quadrant-wise count rates Data is divided into 100 sec bins |
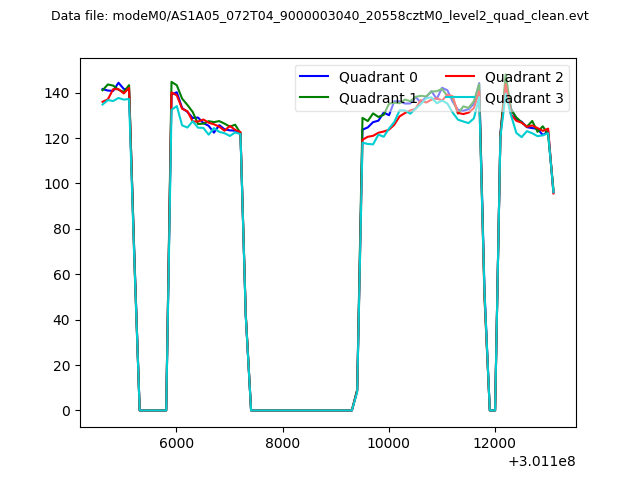 |
|
| Module-wise count rates for Quadrant A Data is divided into 100 sec bins |
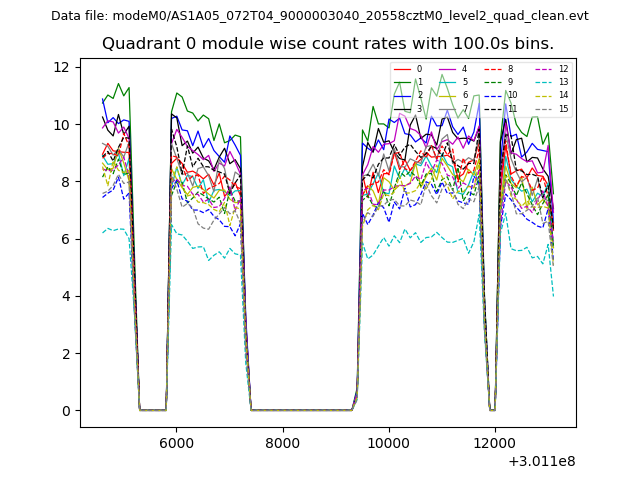 |
 |
| Module-wise count rates for Quadrant B Data is divided into 100 sec bins |
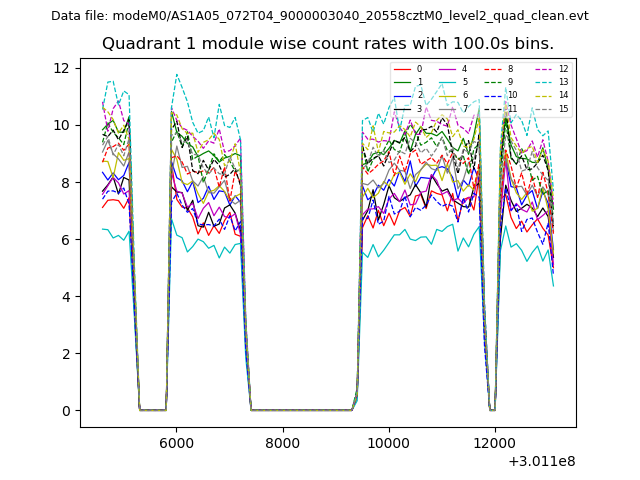 |
 |
| Module-wise count rates for Quadrant C Data is divided into 100 sec bins |
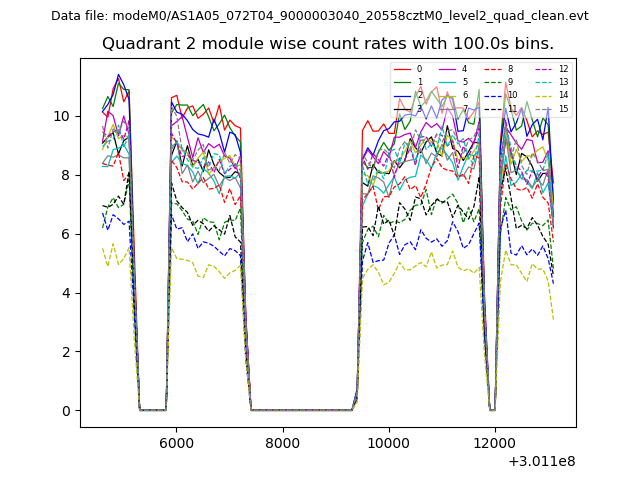 |
 |
| Module-wise count rates for Quadrant D Data is divided into 100 sec bins |
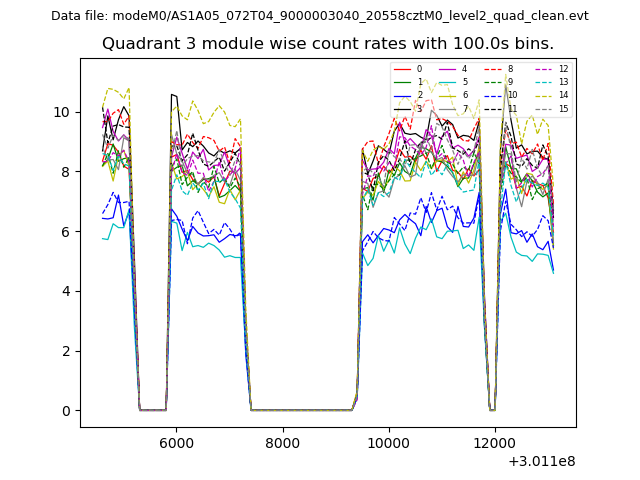 |
 |
| Parameter | Plot |
|---|---|
| CZT HV Monitor | 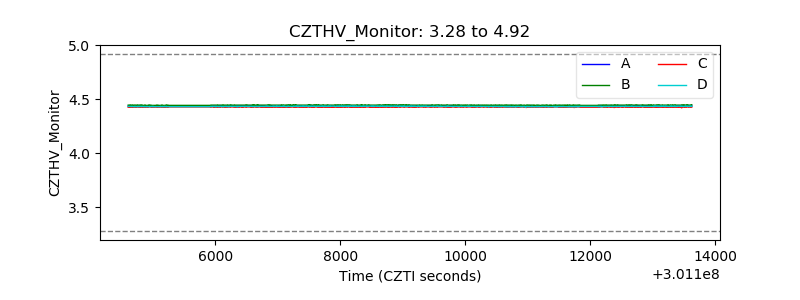 |
| D_VDD | 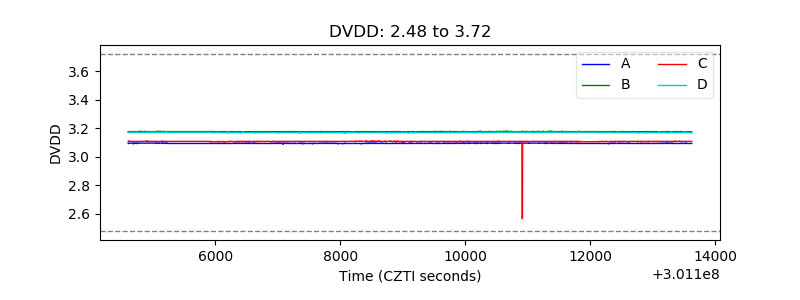 |
| Temperature 1 | 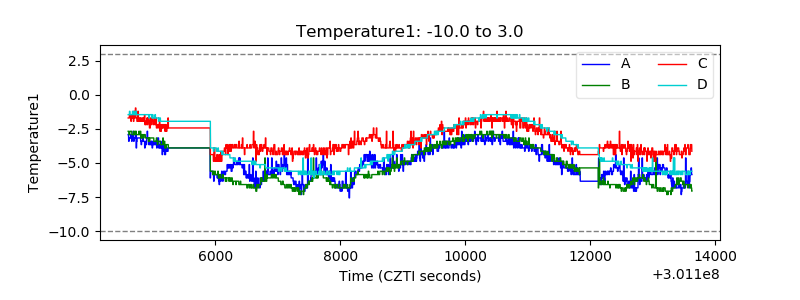 |
| Veto HV Monitor | 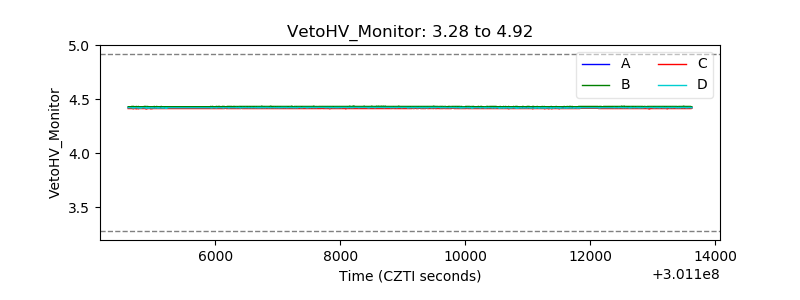 |
| Veto LLD | 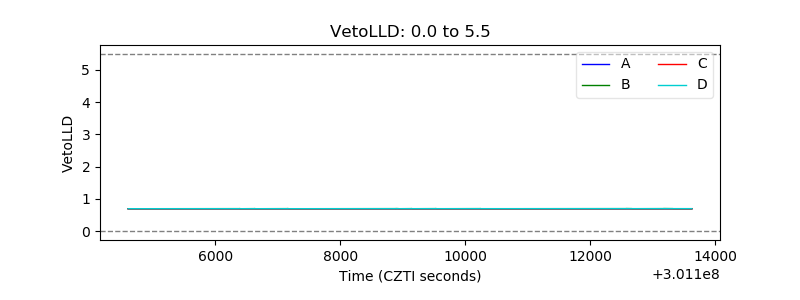 |
| Alpha Counter | 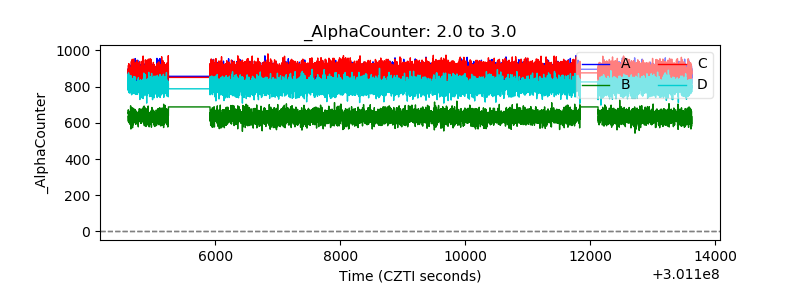 |
| _CPM_Rate | 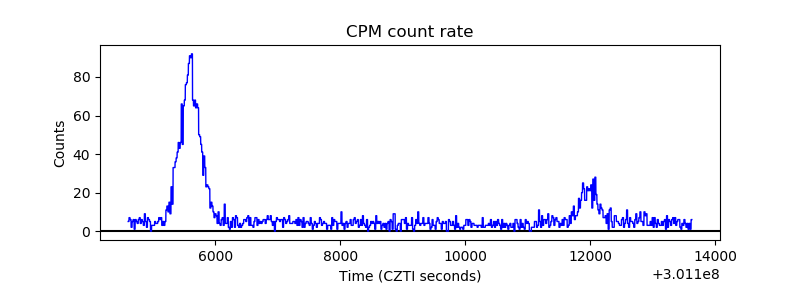 |
| CZT Counter | 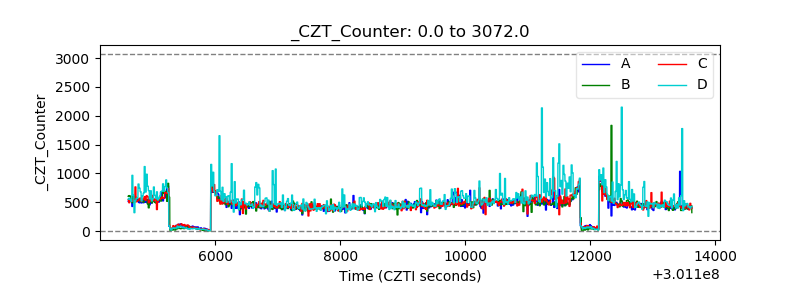 |
| +2.5 Volts monitor | 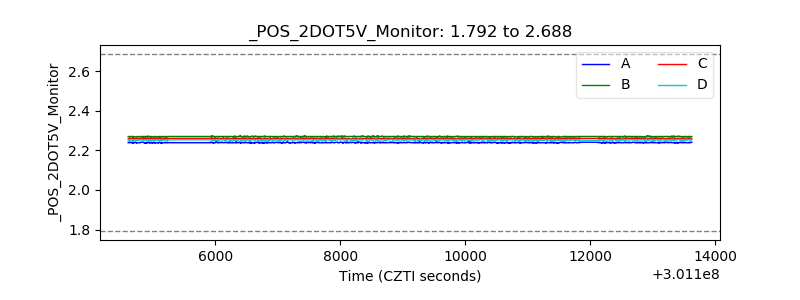 |
| +5 Volts monitor |  |
| _ROLL_ROT | 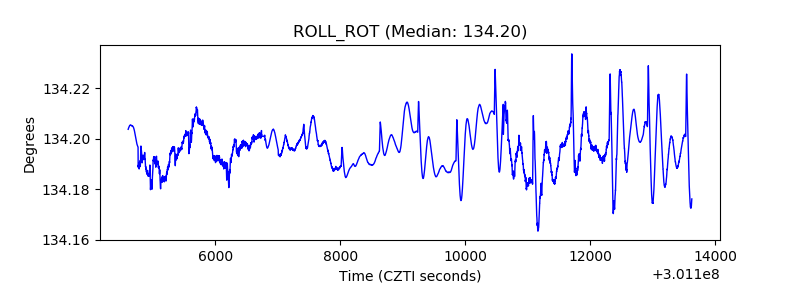 |
| _Roll_DEC | 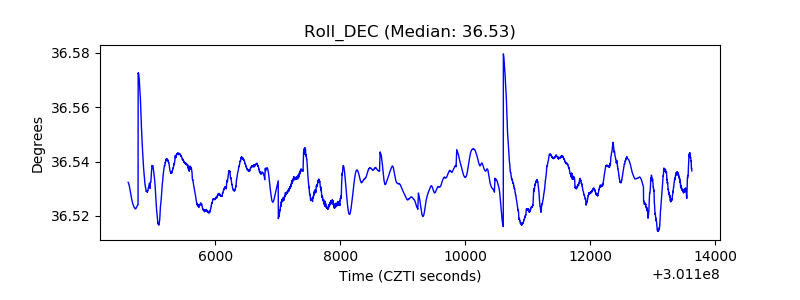 |
| _Roll_RA |  |
| Veto Counter | 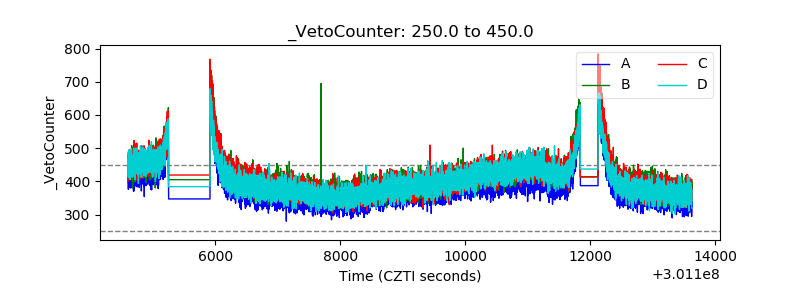 |