| Param | Original file | Final file |
|---|---|---|
| Filename | modeM0/AS1A05_072T04_9000003040_20559cztM0_level2.evt | modeM0/AS1A05_072T04_9000003040_20559cztM0_level2_quad_clean.evt |
| Size (bytes) | 569,085,120 | 100,739,520 |
| Size | 542.7 MB | 96.1 MB |
| Events in quadrant A | 3,782,364 | 632,932 |
| Events in quadrant B | 3,783,673 | 639,482 |
| Events in quadrant C | 3,865,402 | 628,806 |
| Events in quadrant D | 5,267,673 | 600,477 |
| Mode M9 | |||
|---|---|---|---|
| Quadrant | BADHDUFLAG | Total packets | Discarded packets |
| A | 0 | 7 | 0 |
| B | 0 | 7 | 0 |
| C | 0 | 7 | 0 |
| D | 0 | 7 | 0 |
| Mode M0 | |||
|---|---|---|---|
| Quadrant | BADHDUFLAG | Total packets | Discarded packets |
| A | 0 | 16448 | 2 |
| B | 0 | 16397 | 2 |
| C | 0 | 16484 | 2 |
| D | 0 | 21281 | 2 |
| Mode SS | |||
|---|---|---|---|
| Quadrant | BADHDUFLAG | Total packets | Discarded packets |
| A | 0 | 162 | 0 |
| B | 0 | 162 | 0 |
| C | 0 | 162 | 0 |
| D | 0 | 162 | 0 |
| Quadrant | Total seconds | Saturated seconds | Saturation percentage |
|---|---|---|---|
| A | 7892 | 111 | 1.406488% |
| B | 7893 | 163 | 2.065121% |
| C | 7893 | 140 | 1.773724% |
| D | 7893 | 350 | 4.434309% |
Noise dominated data is calculated using 1-second bins in cleaned event files. If a bin has >2000 counts, and if more than 50% of those come from <1% of pixels, then it is considered to be noise-dominated and hence unusable.
| Quadrant | # 1 sec bins | Bins with >0 counts | Bins with >2000 counts | High rate bins dominated by noise | Noise dominated (total time) | Noise dominated (detector-on time) | Marked lightcurve |
|---|---|---|---|---|---|---|---|
| A | 8532 | 7894 | 1 | 1 | 0.01% | 0.01% |  |
| B | 8533 | 7895 | 6 | 6 | 0.07% | 0.08% |  |
| C | 8533 | 7895 | 0 | 0 | 0.00% | 0.00% |  |
| D | 8533 | 7895 | 242 | 242 | 2.84% | 3.07% |  |
Top three noisy pixels from each quadrant. If the there are fewer than three noisy pixels in the level2.evt file, extra rows are filled as -1
| Pixel properties | Quadrant properties | ||||||
|---|---|---|---|---|---|---|---|
| Quadrant | DetID | PixID | Counts | Sigma | Mean | Median | Sigma |
| A | 14 | 239 | 92513 | 474.69 | 952 | 930 | 192.9 |
| A | 3 | 1 | 9429 | 44.05 | 952 | 930 | 192.9 |
| A | 5 | 16 | 8318 | 38.29 | 952 | 930 | 192.9 |
| B | 12 | 111 | 22687 | 118.68 | 949 | 923 | 183.4 |
| B | 7 | 220 | 22606 | 118.24 | 949 | 923 | 183.4 |
| B | 11 | 111 | 20165 | 104.93 | 949 | 923 | 183.4 |
| C | 14 | 238 | 142665 | 654.57 | 924 | 930 | 216.5 |
| C | 3 | 233 | 92013 | 420.65 | 924 | 930 | 216.5 |
| C | 3 | 9 | 25455 | 113.26 | 924 | 930 | 216.5 |
| D | 2 | 184 | 1186181 | 5253.1 | 923 | 894 | 225.6 |
| D | 5 | 222 | 283265 | 1251.45 | 923 | 894 | 225.6 |
| D | 13 | 153 | 162902 | 718.01 | 923 | 894 | 225.6 |
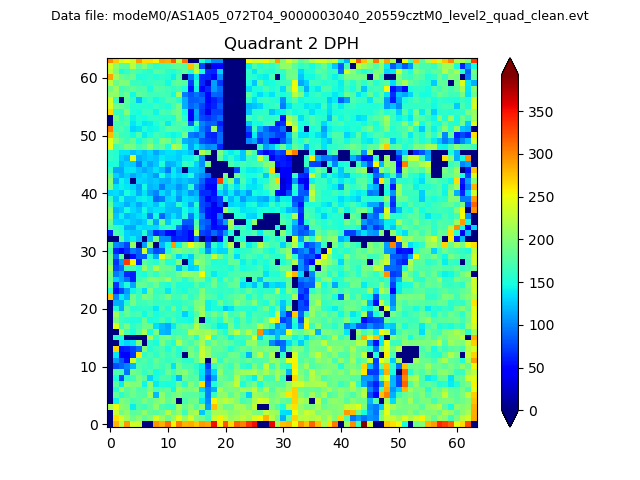
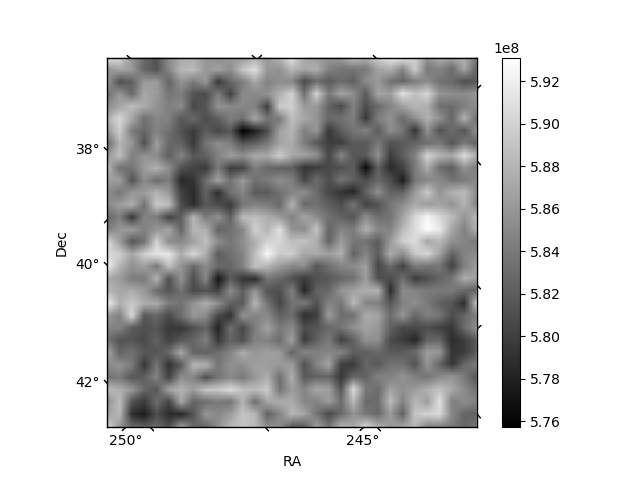
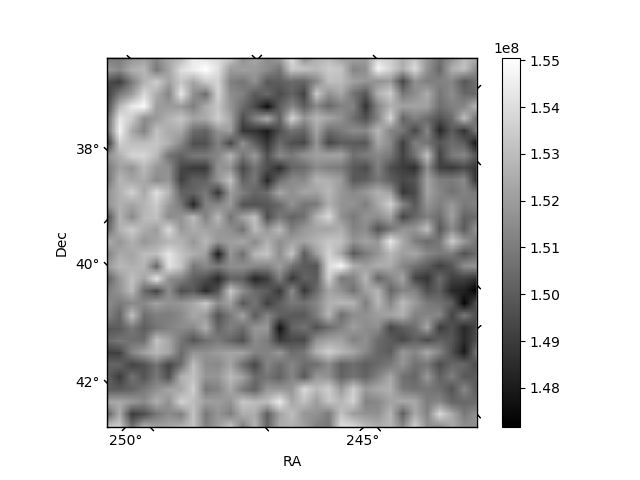
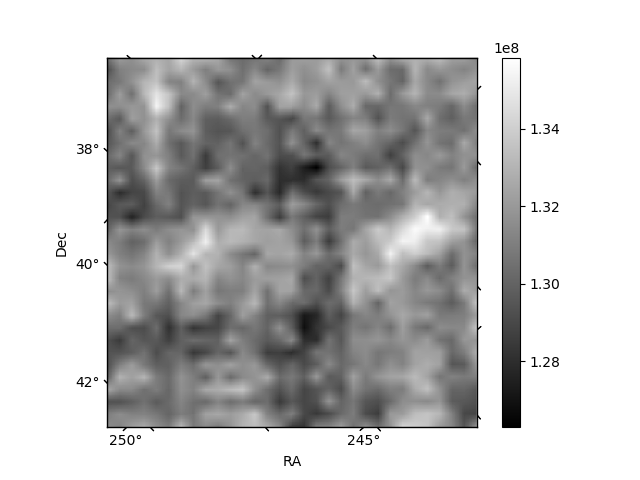
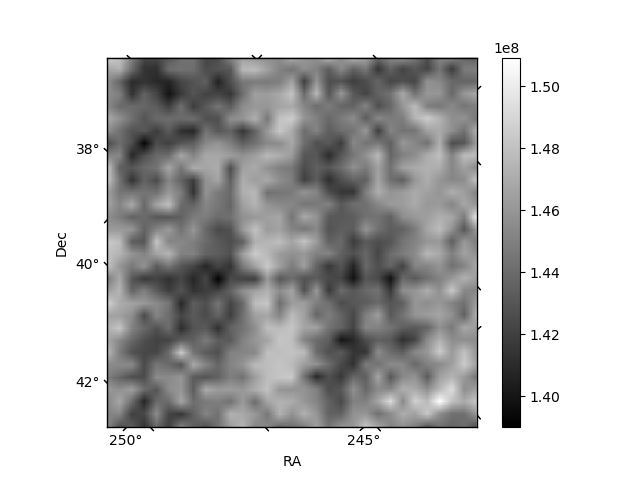
Histogram calculated using DETX and DETY for each event in the final _common_clean file
| Quadrant A | 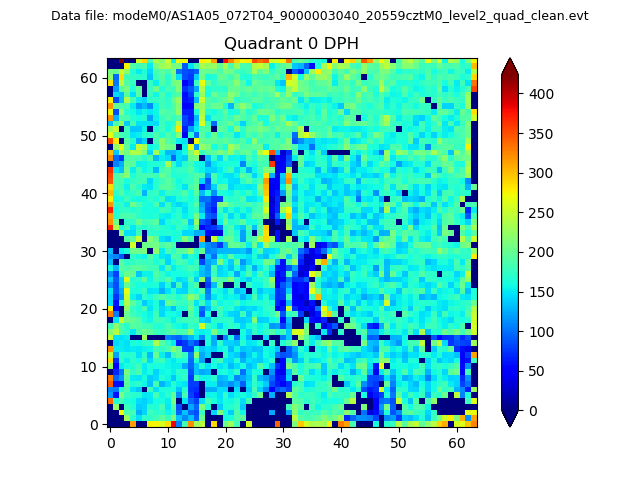 |
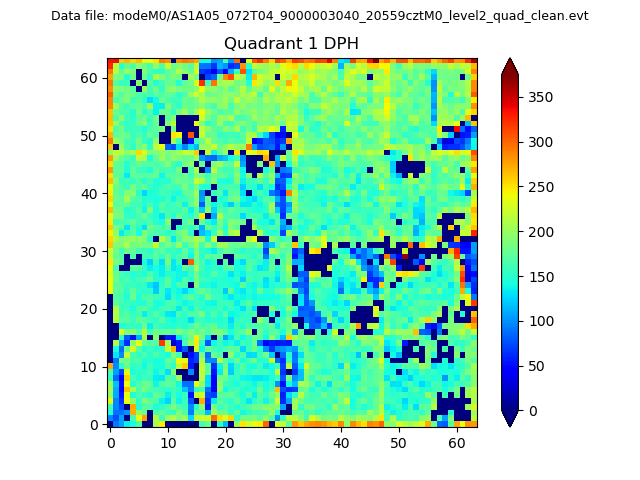 |
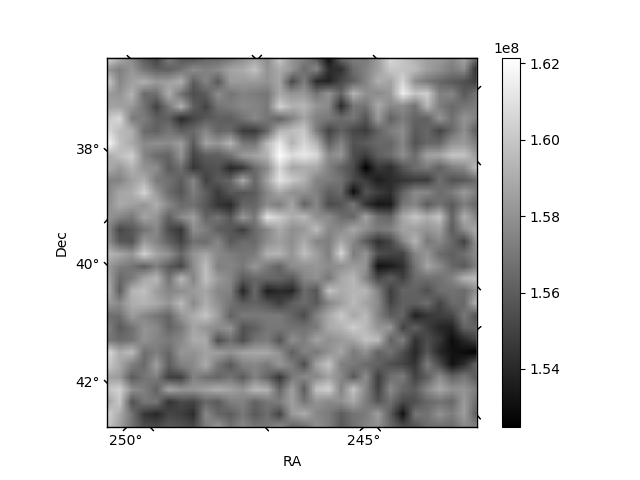
Quadrant B |
|---|---|---|---|
| Quadrant D | 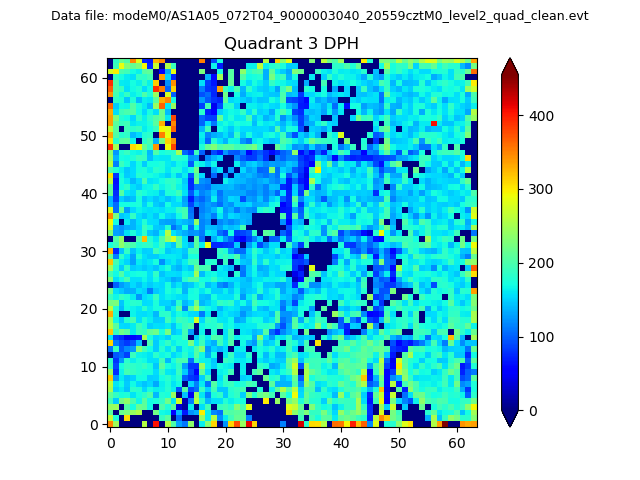 |
 |
Quadrant C |
| Plot type | Count rate plots | Images |
|---|---|---|
| Comparison with Poisson distribution Blue bars denote a histogram of data divided into 1 sec bins. Red curve is a Poisson curve with rate = median count rate of data. |
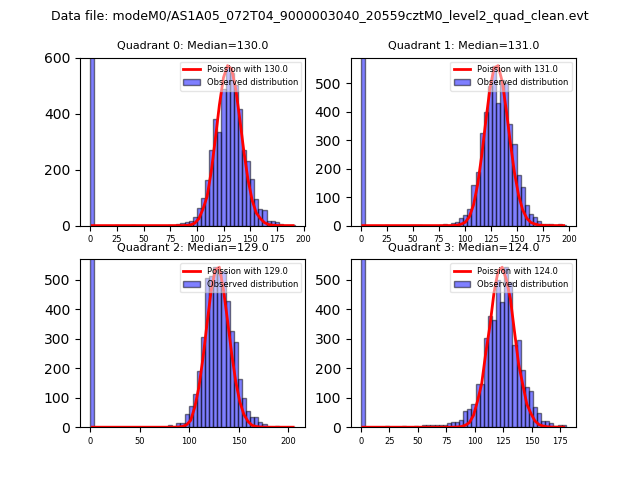 |
 |
| Quadrant-wise count rates Data is divided into 100 sec bins |
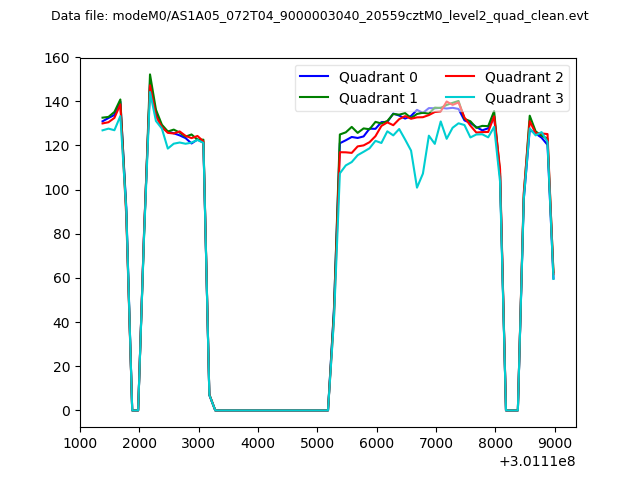 |
|
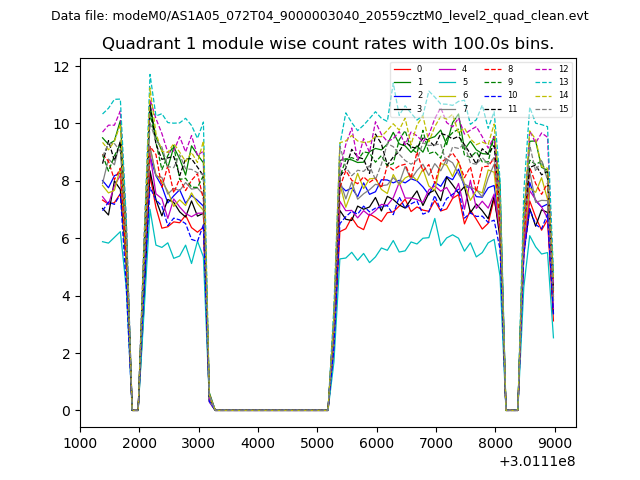
| Module-wise count rates for Quadrant A Data is divided into 100 sec bins |
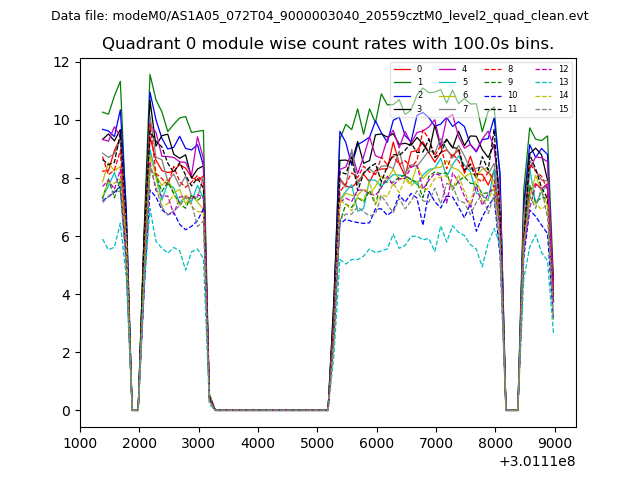 |
 |
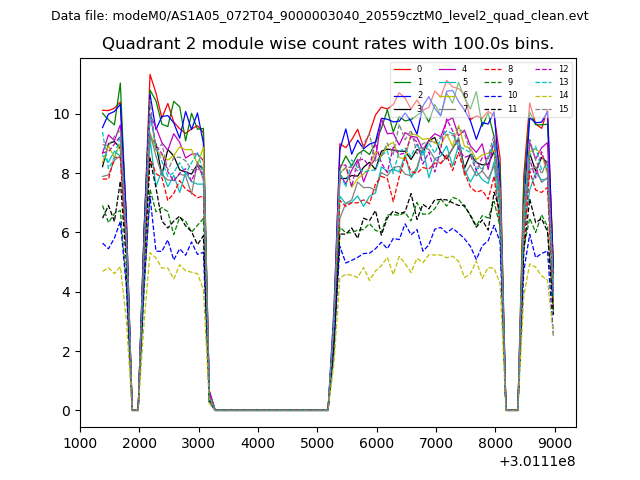
| Module-wise count rates for Quadrant B Data is divided into 100 sec bins |
 |
 |
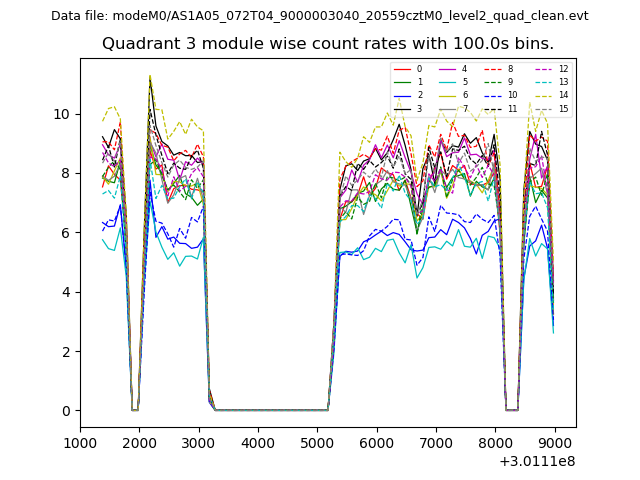
| Module-wise count rates for Quadrant C Data is divided into 100 sec bins |
 |
 |
| Module-wise count rates for Quadrant D Data is divided into 100 sec bins |
 |
 |
| Parameter | Plot |
|---|---|
| CZT HV Monitor | 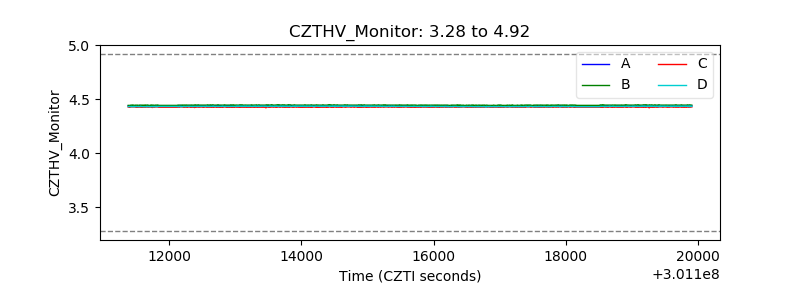 |
| D_VDD | 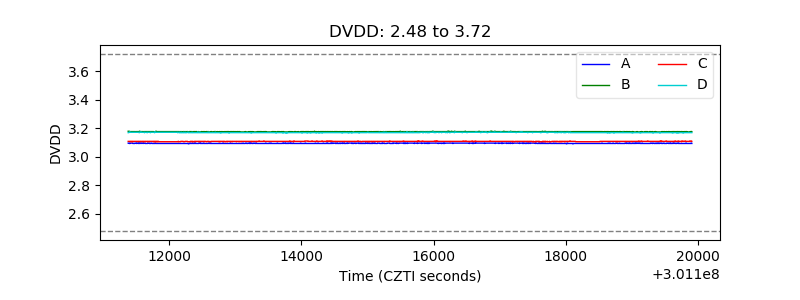 |
| Temperature 1 | 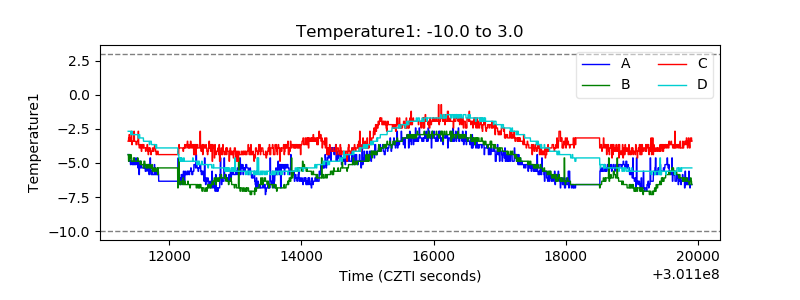 |
| Veto HV Monitor |  |
| Veto LLD | 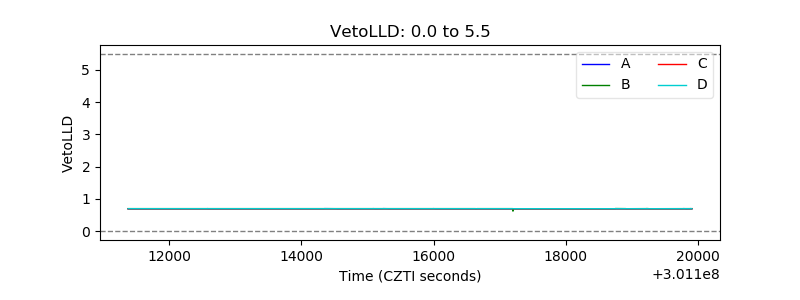 |
| Alpha Counter | 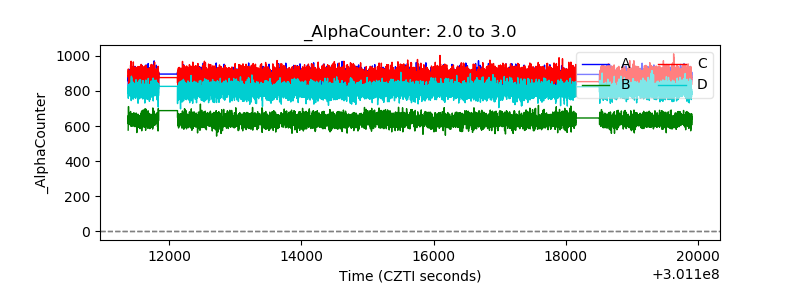 |
| _CPM_Rate | 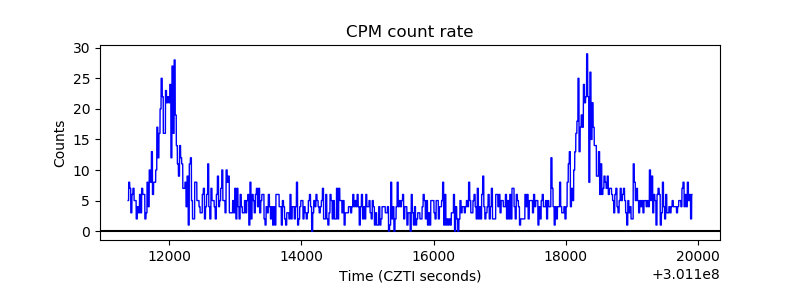 |
| CZT Counter | 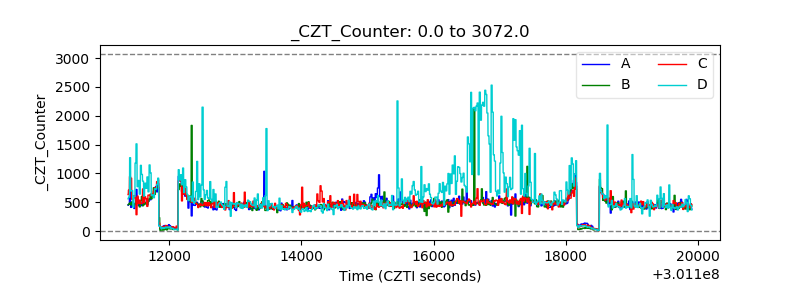 |
| +2.5 Volts monitor |  |
| +5 Volts monitor |  |
| _ROLL_ROT | 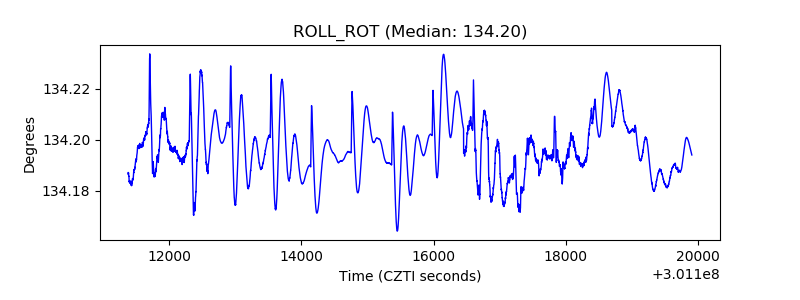 |
| _Roll_DEC | 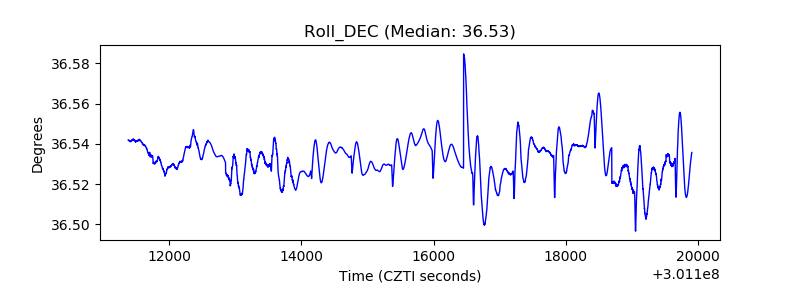 |
| _Roll_RA | 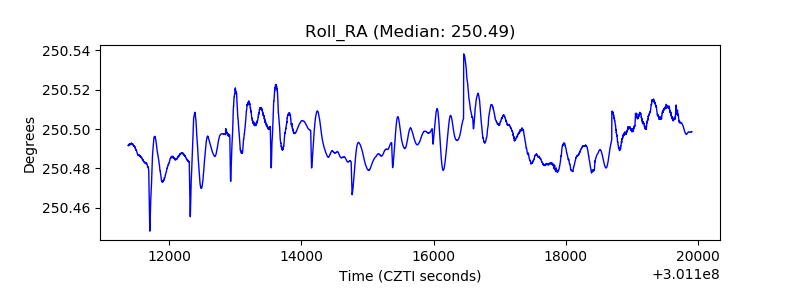 |
| Veto Counter | 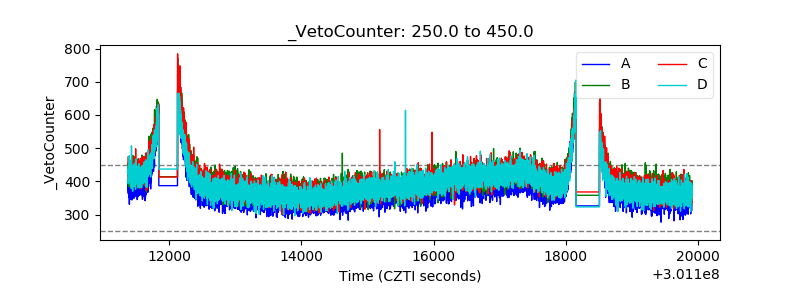 |