| Param | Original file | Final file |
|---|---|---|
| Filename | modeM0/AS1A05_072T04_9000003040_20567cztM0_level2.evt | modeM0/AS1A05_072T04_9000003040_20567cztM0_level2_quad_clean.evt |
| Size (bytes) | 802,033,920 | 136,932,480 |
| Size | 764.9 MB | 130.6 MB |
| Events in quadrant A | 5,339,178 | 853,425 |
| Events in quadrant B | 5,442,468 | 859,562 |
| Events in quadrant C | 5,535,238 | 841,478 |
| Events in quadrant D | 7,204,867 | 807,567 |
| Mode M9 | |||
|---|---|---|---|
| Quadrant | BADHDUFLAG | Total packets | Discarded packets |
| A | 0 | 9 | 0 |
| B | 0 | 9 | 0 |
| C | 0 | 9 | 0 |
| D | 0 | 9 | 0 |
| Mode M0 | |||
|---|---|---|---|
| Quadrant | BADHDUFLAG | Total packets | Discarded packets |
| A | 0 | 23290 | 2 |
| B | 0 | 23478 | 2 |
| C | 0 | 23395 | 2 |
| D | 0 | 29302 | 2 |
| Mode SS | |||
|---|---|---|---|
| Quadrant | BADHDUFLAG | Total packets | Discarded packets |
| A | 0 | 228 | 0 |
| B | 0 | 228 | 0 |
| C | 0 | 228 | 0 |
| D | 0 | 228 | 0 |
| Quadrant | Total seconds | Saturated seconds | Saturation percentage |
|---|---|---|---|
| A | 11348 | 133 | 1.172013% |
| B | 11349 | 178 | 1.568420% |
| C | 11349 | 148 | 1.304080% |
| D | 11349 | 418 | 3.683144% |
Noise dominated data is calculated using 1-second bins in cleaned event files. If a bin has >2000 counts, and if more than 50% of those come from <1% of pixels, then it is considered to be noise-dominated and hence unusable.
| Quadrant | # 1 sec bins | Bins with >0 counts | Bins with >2000 counts | High rate bins dominated by noise | Noise dominated (total time) | Noise dominated (detector-on time) | Marked lightcurve |
|---|---|---|---|---|---|---|---|
| A | 12128 | 11350 | 1 | 1 | 0.01% | 0.01% | 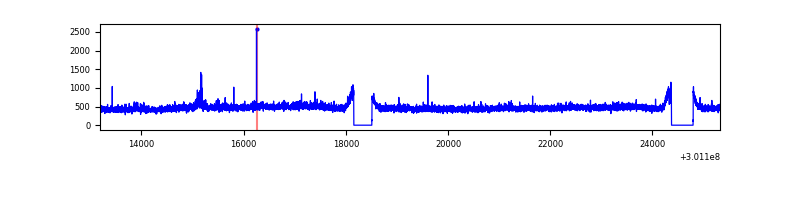 |
| B | 12129 | 11351 | 14 | 14 | 0.12% | 0.12% | 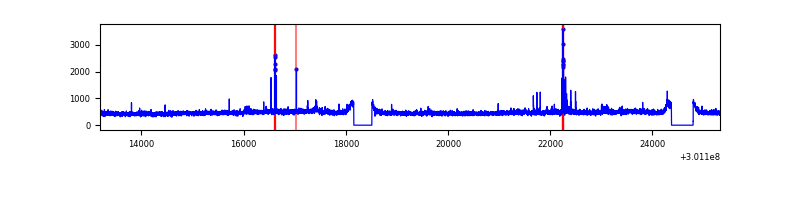 |
| C | 12129 | 11351 | 0 | 0 | 0.00% | 0.00% |  |
| D | 12129 | 11351 | 274 | 274 | 2.26% | 2.41% | 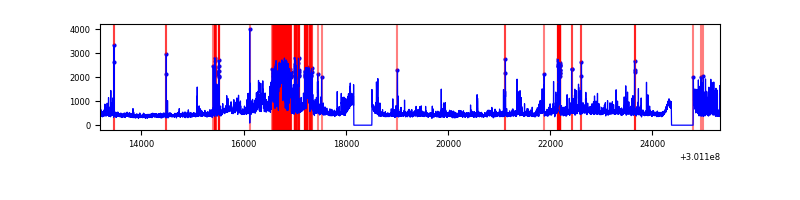 |
Top three noisy pixels from each quadrant. If the there are fewer than three noisy pixels in the level2.evt file, extra rows are filled as -1
| Pixel properties | Quadrant properties | ||||||
|---|---|---|---|---|---|---|---|
| Quadrant | DetID | PixID | Counts | Sigma | Mean | Median | Sigma |
| A | 14 | 239 | 90323 | 324.72 | 1355 | 1323 | 274.1 |
| A | 3 | 1 | 13076 | 42.88 | 1355 | 1323 | 274.1 |
| A | 8 | 205 | 11898 | 38.58 | 1355 | 1323 | 274.1 |
| B | 7 | 220 | 81779 | 310.03 | 1346 | 1310 | 259.5 |
| B | 0 | 219 | 39782 | 148.23 | 1346 | 1310 | 259.5 |
| B | 12 | 111 | 32162 | 118.87 | 1346 | 1310 | 259.5 |
| C | 14 | 238 | 201334 | 653.48 | 1309 | 1316 | 306.1 |
| C | 3 | 233 | 145721 | 471.79 | 1309 | 1316 | 306.1 |
| C | 3 | 9 | 73256 | 235.04 | 1309 | 1316 | 306.1 |
| D | 2 | 184 | 1380716 | 4310.15 | 1319 | 1281 | 320.0 |
| D | 5 | 222 | 327220 | 1018.42 | 1319 | 1281 | 320.0 |
| D | 2 | 16 | 161885 | 501.82 | 1319 | 1281 | 320.0 |
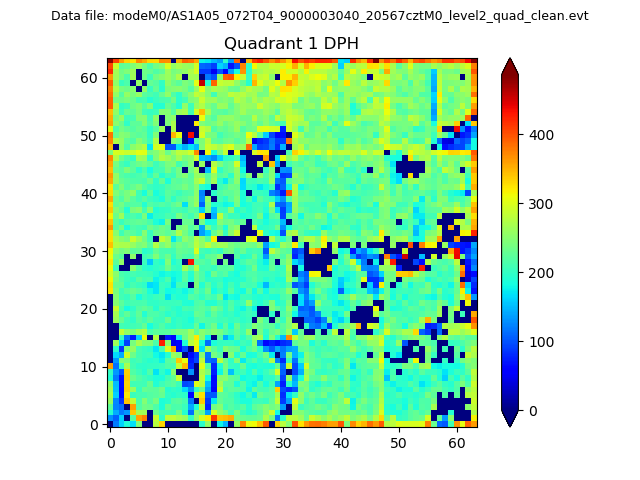
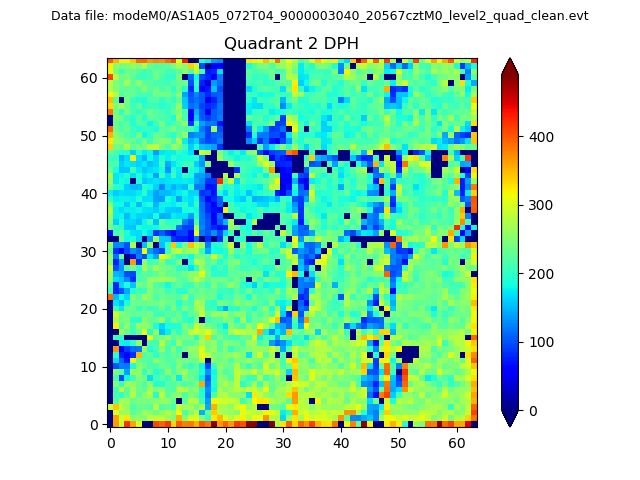
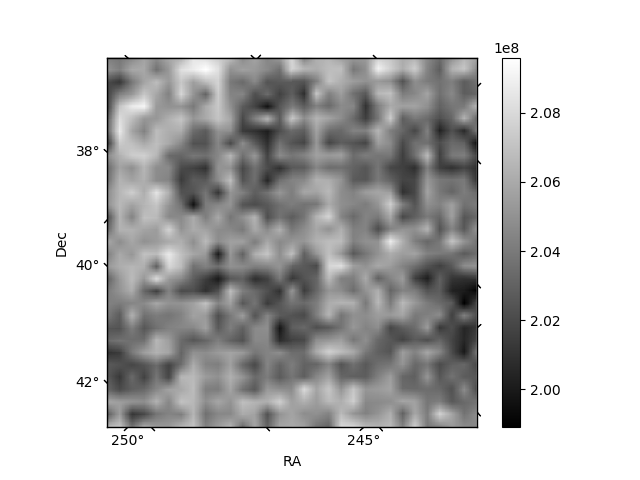
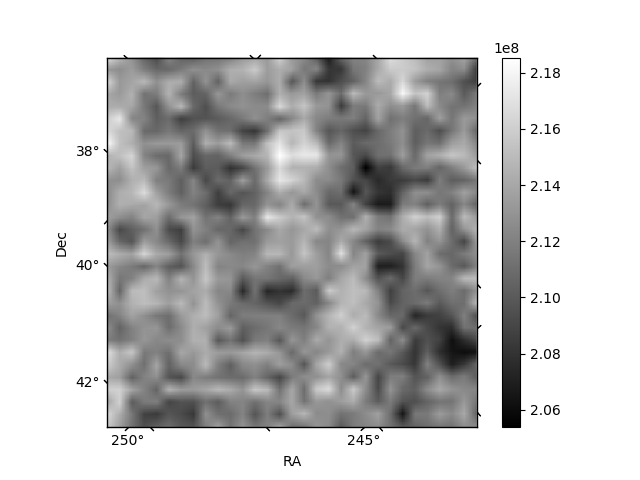
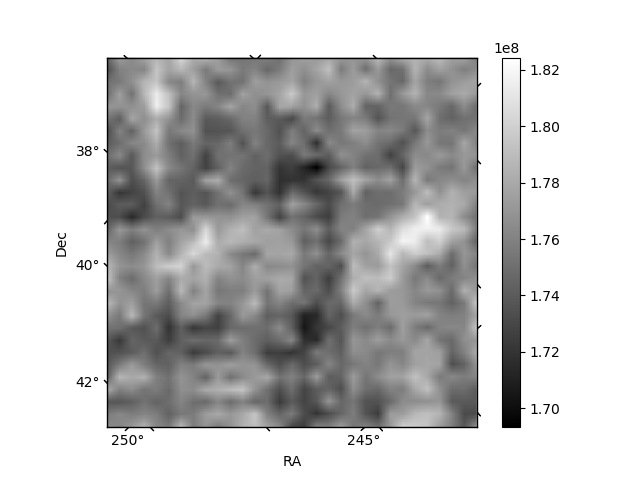
Histogram calculated using DETX and DETY for each event in the final _common_clean file
| Quadrant A |  |
 |
Quadrant B |
|---|---|---|---|
| Quadrant D | 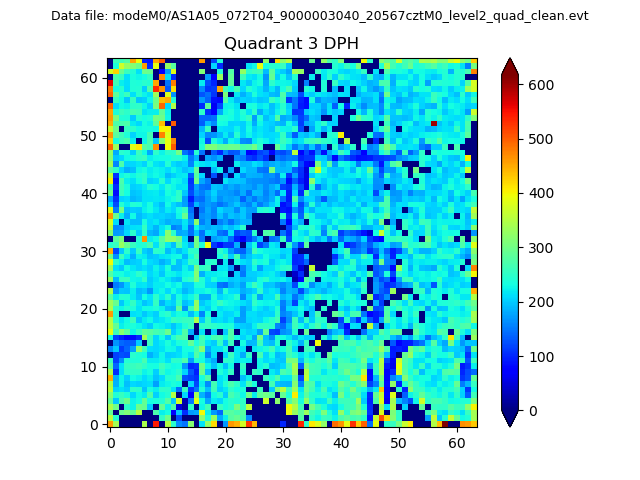 |
 |
Quadrant C |
| Plot type | Count rate plots | Images |
|---|---|---|
| Comparison with Poisson distribution Blue bars denote a histogram of data divided into 1 sec bins. Red curve is a Poisson curve with rate = median count rate of data. |
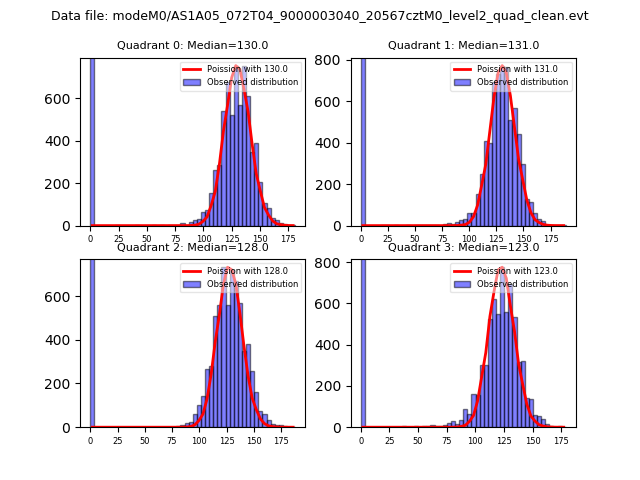 |
 |
| Quadrant-wise count rates Data is divided into 100 sec bins |
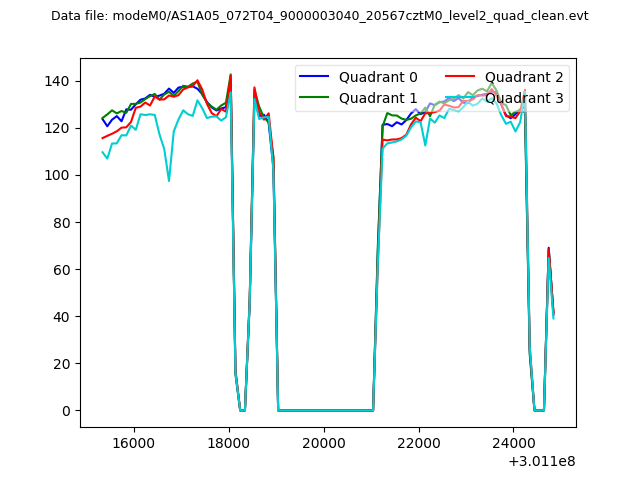 |
|
| Module-wise count rates for Quadrant A Data is divided into 100 sec bins |
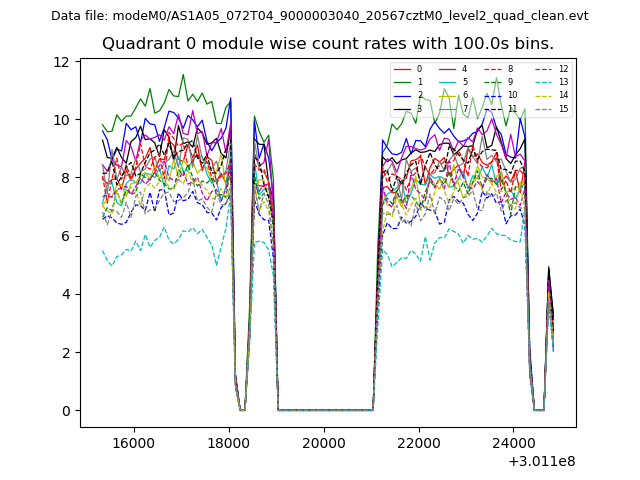 |
 |
| Module-wise count rates for Quadrant B Data is divided into 100 sec bins |
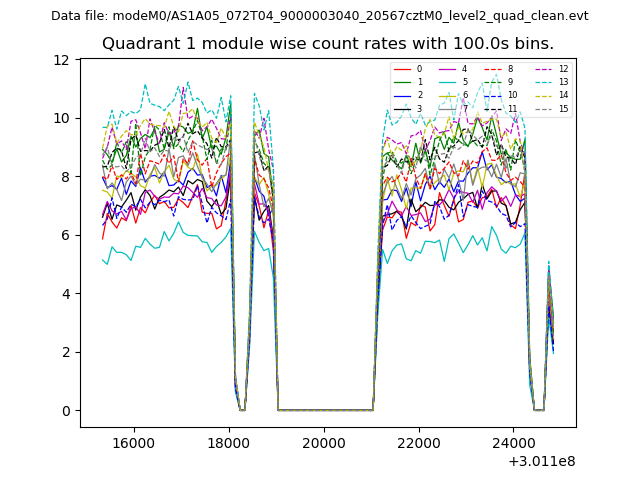 |
 |
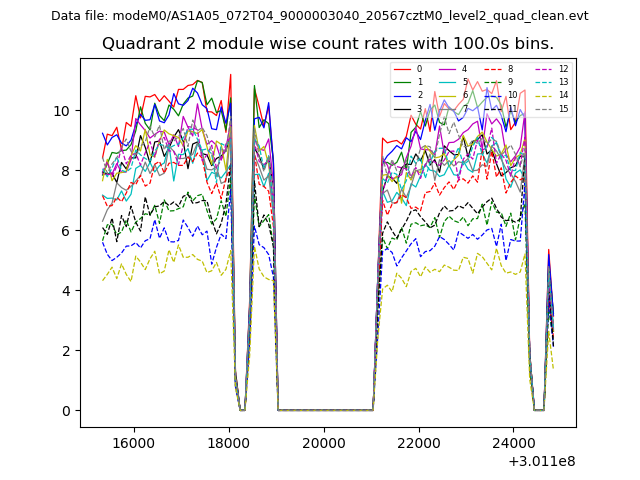
| Module-wise count rates for Quadrant C Data is divided into 100 sec bins |
 |
 |
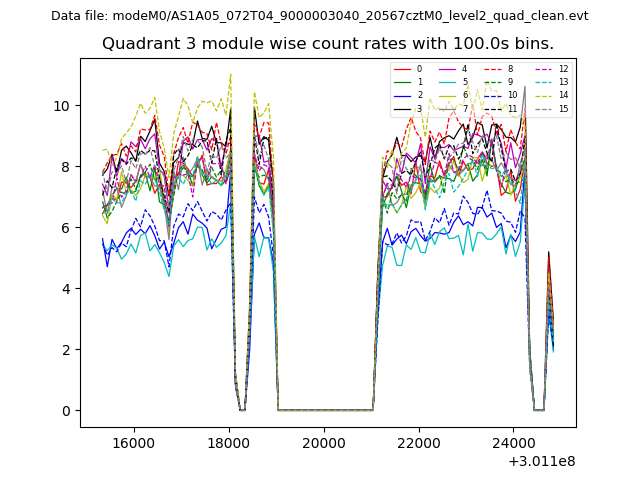
| Module-wise count rates for Quadrant D Data is divided into 100 sec bins |
 |
 |
| Parameter | Plot |
|---|---|
| CZT HV Monitor | 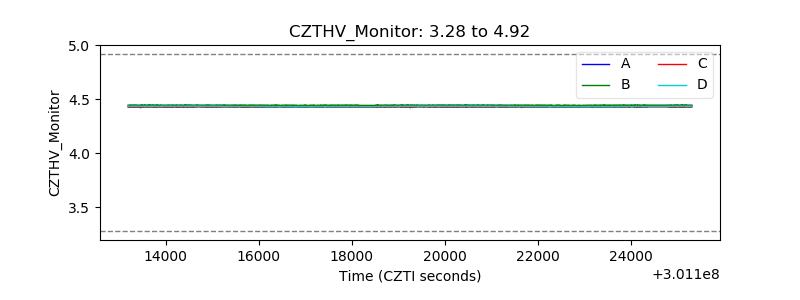 |
| D_VDD | 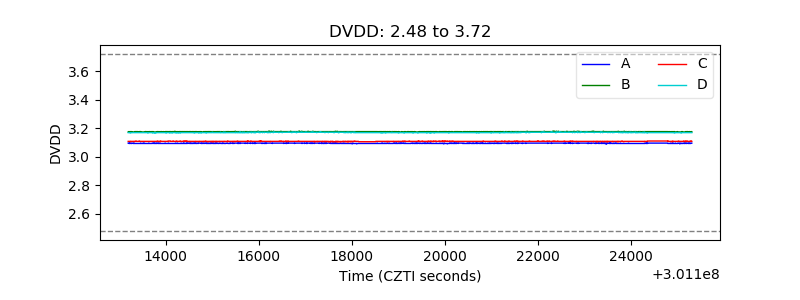 |
| Temperature 1 | 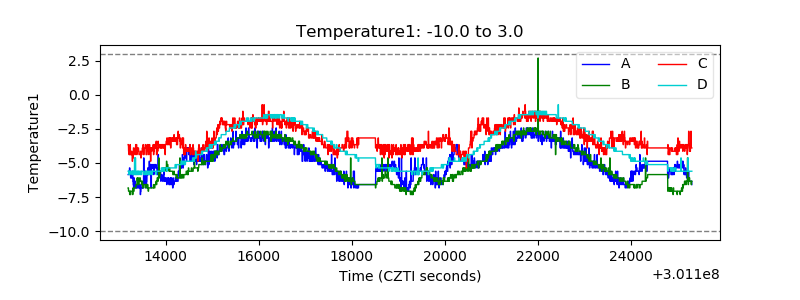 |
| Veto HV Monitor | 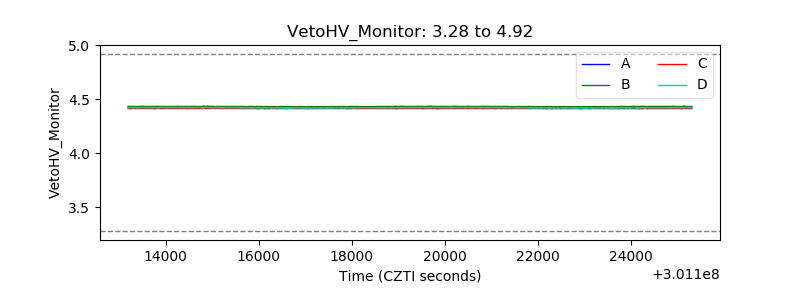 |
| Veto LLD | 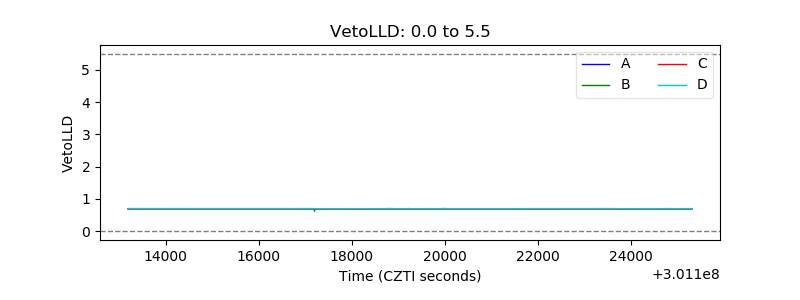 |
| Alpha Counter | 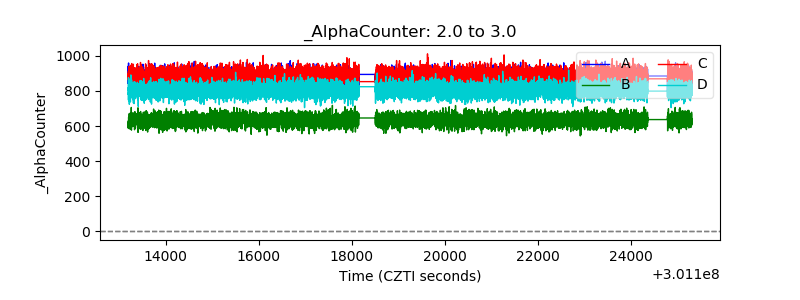 |
| _CPM_Rate | 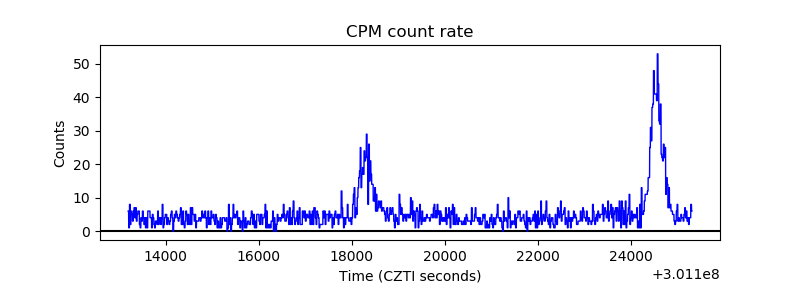 |
| CZT Counter | 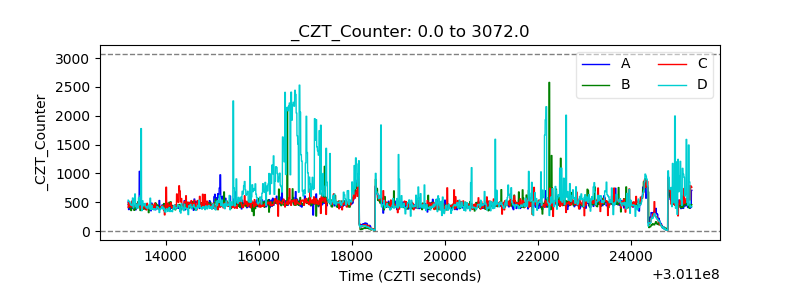 |
| +2.5 Volts monitor |  |
| +5 Volts monitor | 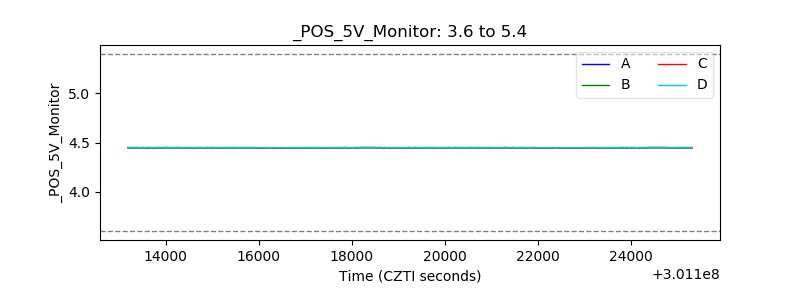 |
| _ROLL_ROT | 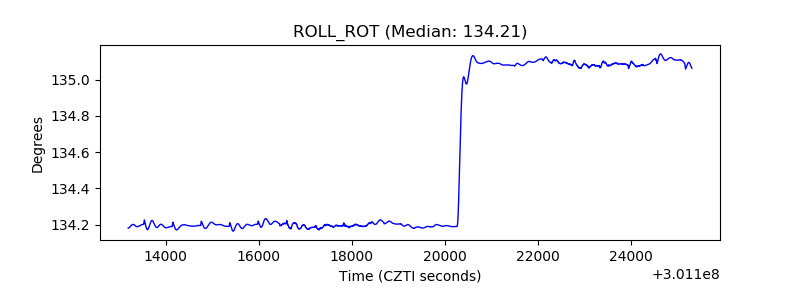 |
| _Roll_DEC | 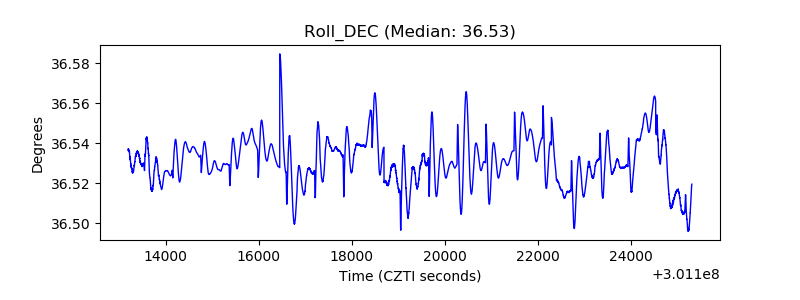 |
| _Roll_RA | 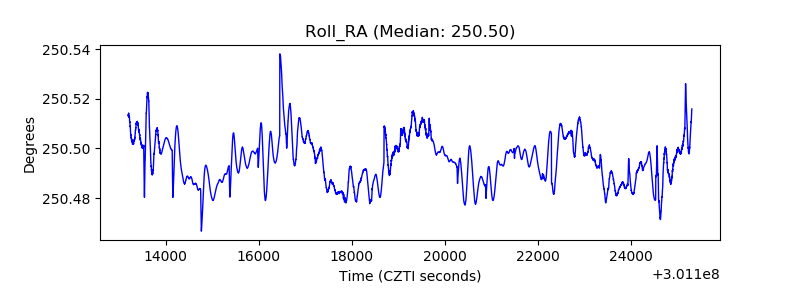 |
| Veto Counter | 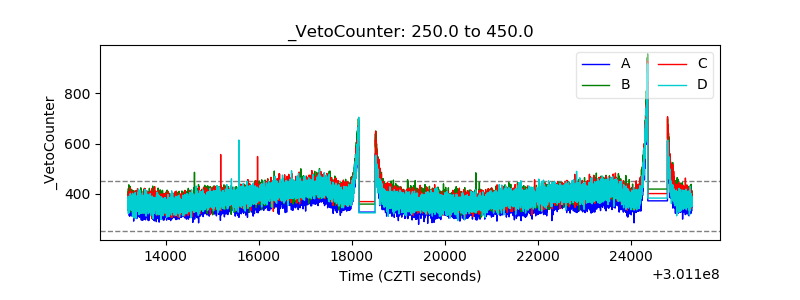 |