| Param | Original file | Final file |
|---|---|---|
| Filename | modeM0/AS1A05_072T04_9000003040_20568cztM0_level2.evt | modeM0/AS1A05_072T04_9000003040_20568cztM0_level2_quad_clean.evt |
| Size (bytes) | 1,572,281,280 | 279,743,040 |
| Size | 1.5 GB | 266.8 MB |
| Events in quadrant A | 9,799,779 | 1,802,972 |
| Events in quadrant B | 10,179,016 | 1,810,089 |
| Events in quadrant C | 10,619,245 | 1,763,318 |
| Events in quadrant D | 15,617,336 | 1,667,087 |
| Mode M9 | |||
|---|---|---|---|
| Quadrant | BADHDUFLAG | Total packets | Discarded packets |
| A | 0 | 29 | 0 |
| B | 0 | 29 | 0 |
| C | 0 | 29 | 0 |
| D | 0 | 29 | 0 |
| Mode M0 | |||
|---|---|---|---|
| Quadrant | BADHDUFLAG | Total packets | Discarded packets |
| A | 0 | 42544 | 4 |
| B | 0 | 43245 | 4 |
| C | 0 | 43764 | 4 |
| D | 0 | 60102 | 4 |
| Mode SS | |||
|---|---|---|---|
| Quadrant | BADHDUFLAG | Total packets | Discarded packets |
| A | 0 | 420 | 0 |
| B | 0 | 420 | 0 |
| C | 0 | 420 | 0 |
| D | 0 | 420 | 0 |
| Quadrant | Total seconds | Saturated seconds | Saturation percentage |
|---|---|---|---|
| A | 20770 | 281 | 1.352913% |
| B | 20771 | 369 | 1.776515% |
| C | 20771 | 357 | 1.718742% |
| D | 20771 | 1382 | 6.653507% |
Noise dominated data is calculated using 1-second bins in cleaned event files. If a bin has >2000 counts, and if more than 50% of those come from <1% of pixels, then it is considered to be noise-dominated and hence unusable.
| Quadrant | # 1 sec bins | Bins with >0 counts | Bins with >2000 counts | High rate bins dominated by noise | Noise dominated (total time) | Noise dominated (detector-on time) | Marked lightcurve |
|---|---|---|---|---|---|---|---|
| A | 23470 | 20775 | 0 | 0 | 0.00% | 0.00% |  |
| B | 23471 | 20776 | 13 | 13 | 0.06% | 0.06% |  |
| C | 23471 | 20776 | 0 | 0 | 0.00% | 0.00% | 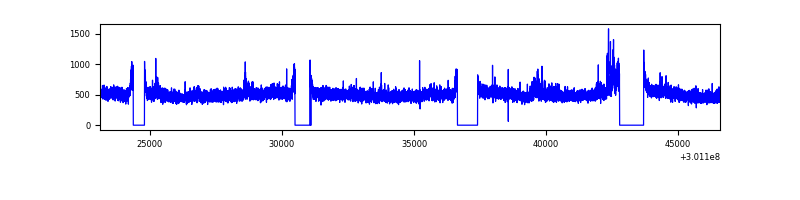 |
| D | 23471 | 20776 | 1259 | 1259 | 5.36% | 6.06% | 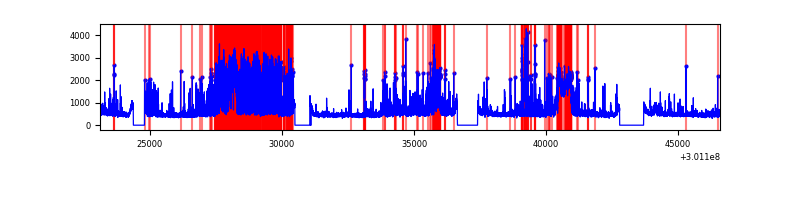 |
Top three noisy pixels from each quadrant. If the there are fewer than three noisy pixels in the level2.evt file, extra rows are filled as -1
| Pixel properties | Quadrant properties | ||||||
|---|---|---|---|---|---|---|---|
| Quadrant | DetID | PixID | Counts | Sigma | Mean | Median | Sigma |
| A | 14 | 239 | 58357 | 110.52 | 2513 | 2460 | 505.8 |
| A | 8 | 205 | 34428 | 63.21 | 2513 | 2460 | 505.8 |
| A | 0 | 226 | 21648 | 37.94 | 2513 | 2460 | 505.8 |
| B | 7 | 220 | 162526 | 336.39 | 2493 | 2427 | 475.9 |
| B | 0 | 197 | 60147 | 121.28 | 2493 | 2427 | 475.9 |
| B | 12 | 111 | 59305 | 119.51 | 2493 | 2427 | 475.9 |
| C | 3 | 9 | 376646 | 663.5 | 2419 | 2432 | 564.0 |
| C | 14 | 238 | 375049 | 660.67 | 2419 | 2432 | 564.0 |
| C | 3 | 233 | 356123 | 627.11 | 2419 | 2432 | 564.0 |
| D | 2 | 16 | 3170722 | 5510.0 | 2413 | 2348 | 575.0 |
| D | 1 | 52 | 1146780 | 1990.24 | 2413 | 2348 | 575.0 |
| D | 2 | 165 | 895193 | 1552.71 | 2413 | 2348 | 575.0 |
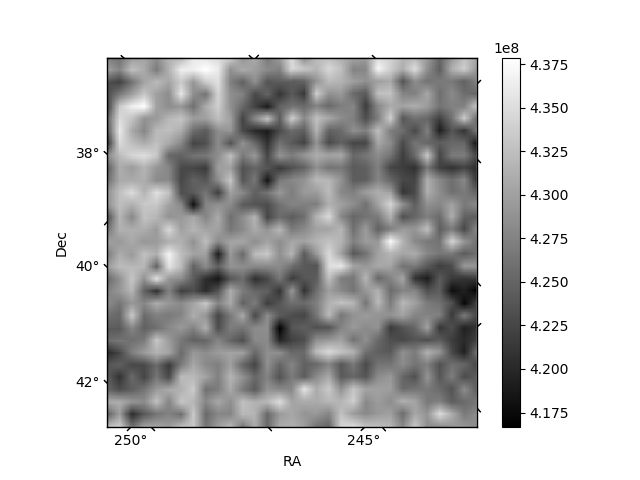
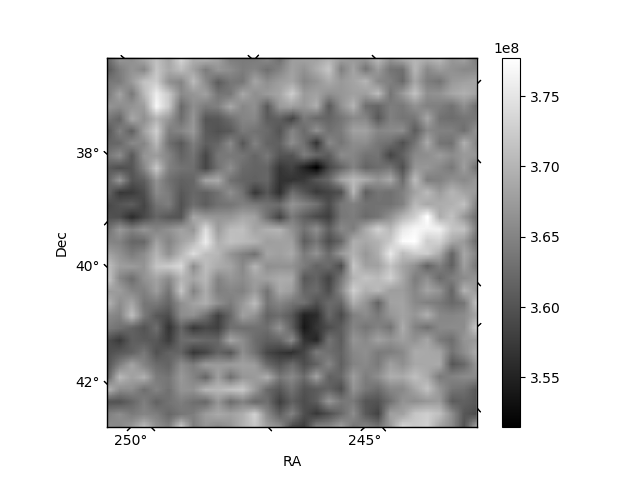
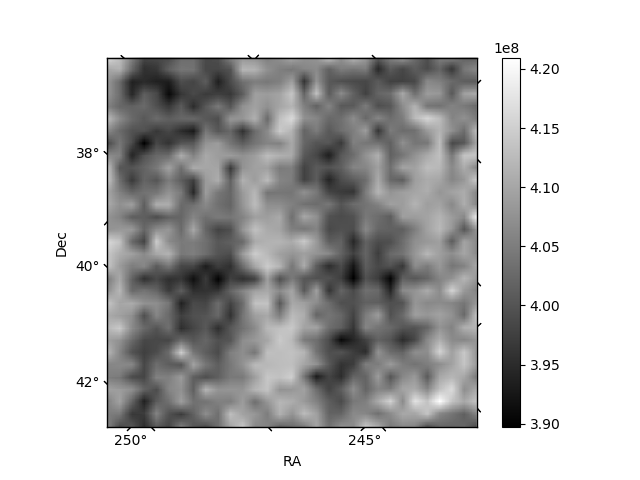
Histogram calculated using DETX and DETY for each event in the final _common_clean file
| Quadrant A | 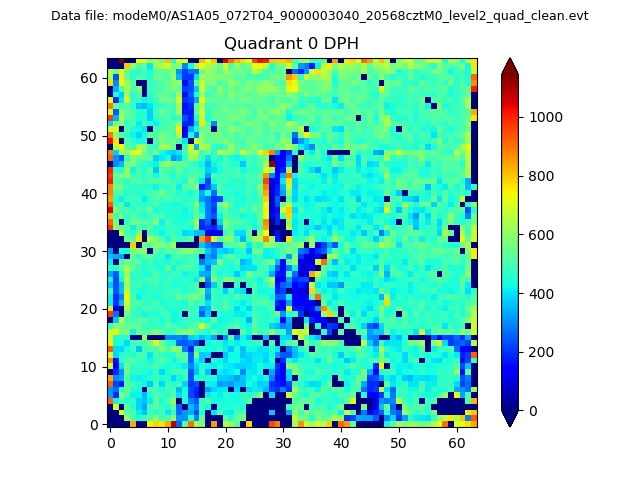 |
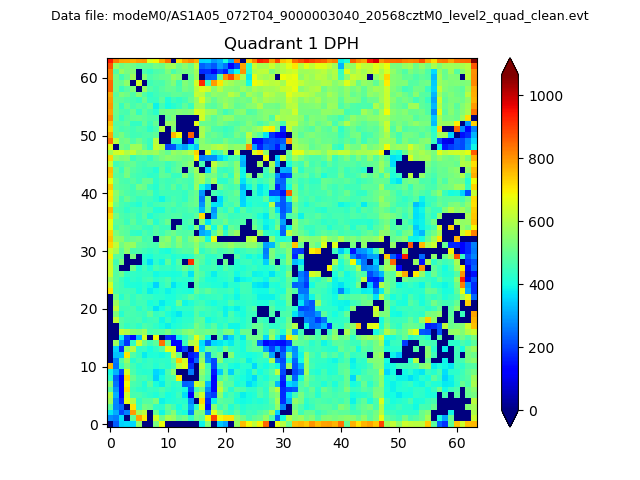 |
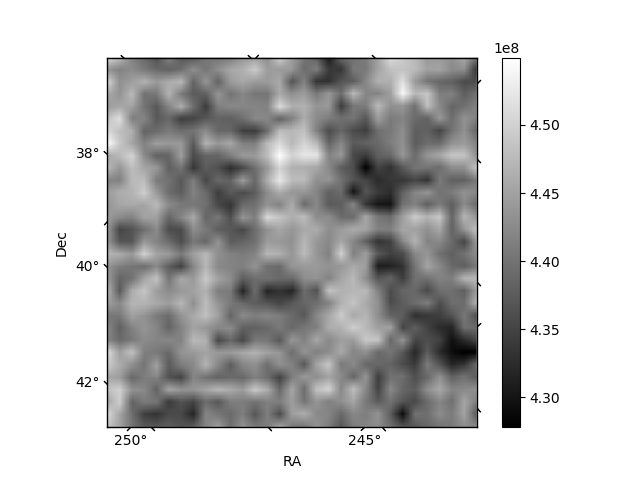
Quadrant B |
|---|---|---|---|
| Quadrant D |  |
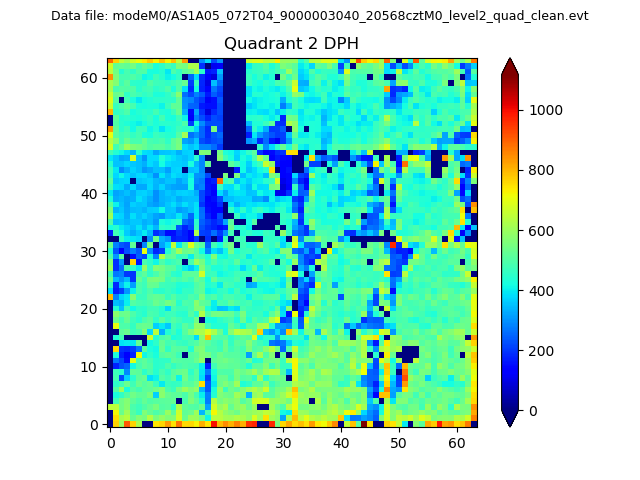 |
Quadrant C |
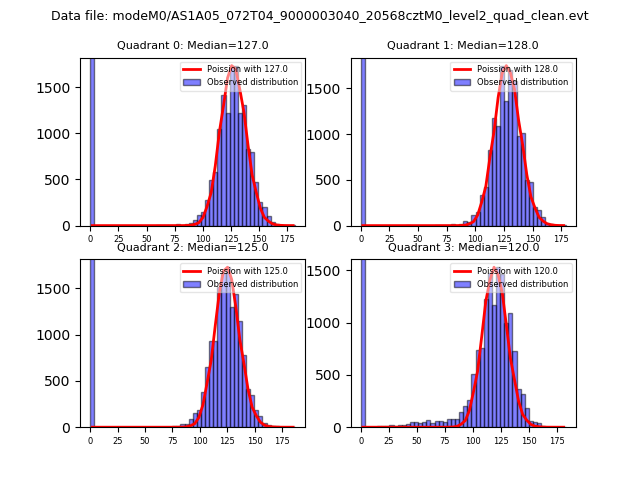
| Plot type | Count rate plots | Images |
|---|---|---|
| Comparison with Poisson distribution Blue bars denote a histogram of data divided into 1 sec bins. Red curve is a Poisson curve with rate = median count rate of data. |
 |
 |
| Quadrant-wise count rates Data is divided into 100 sec bins |
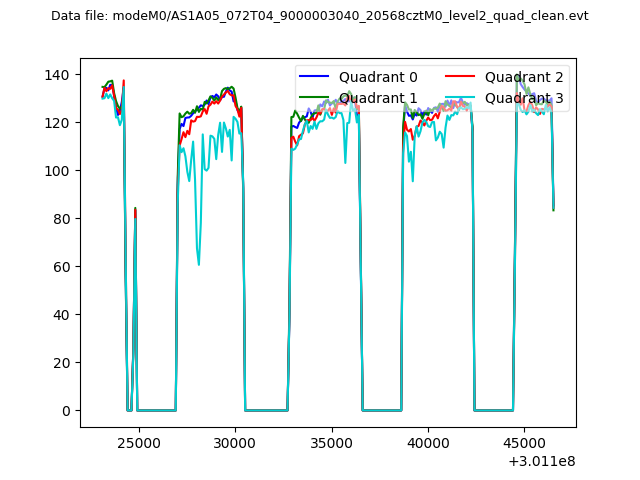 |
|
| Module-wise count rates for Quadrant A Data is divided into 100 sec bins |
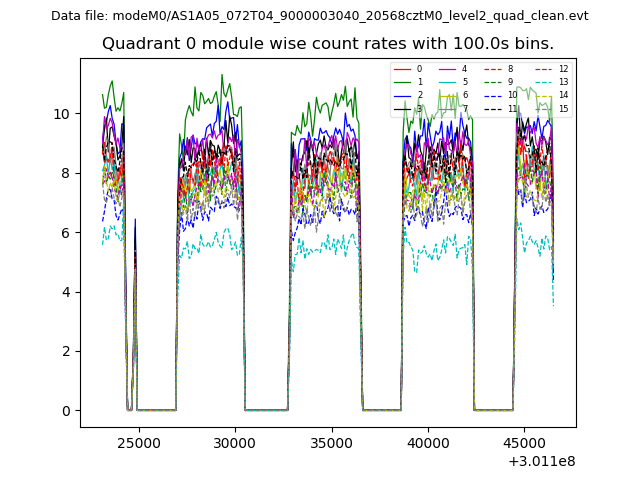 |
 |
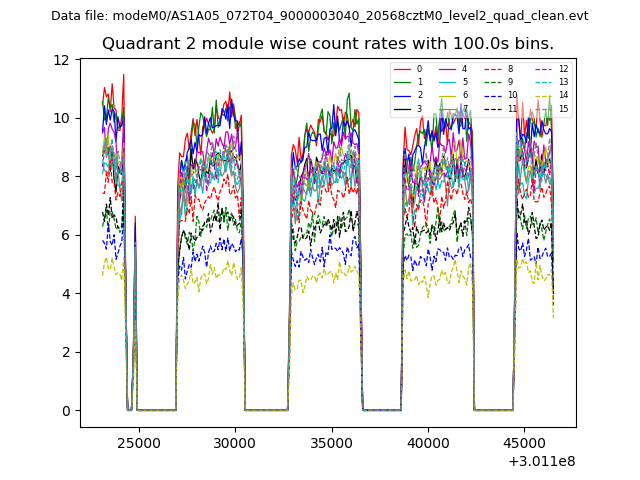
| Module-wise count rates for Quadrant B Data is divided into 100 sec bins |
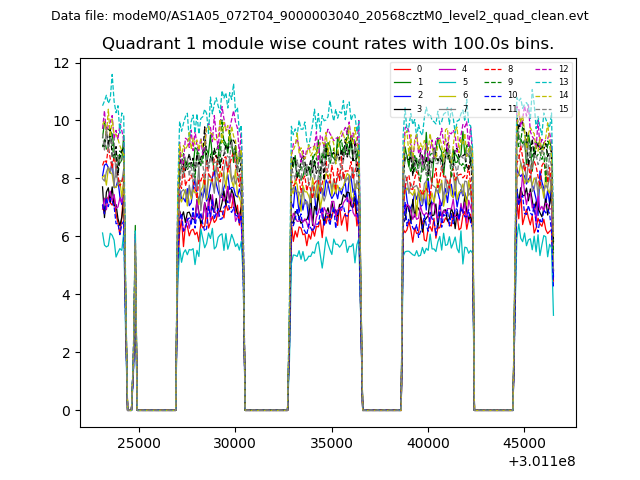 |
 |
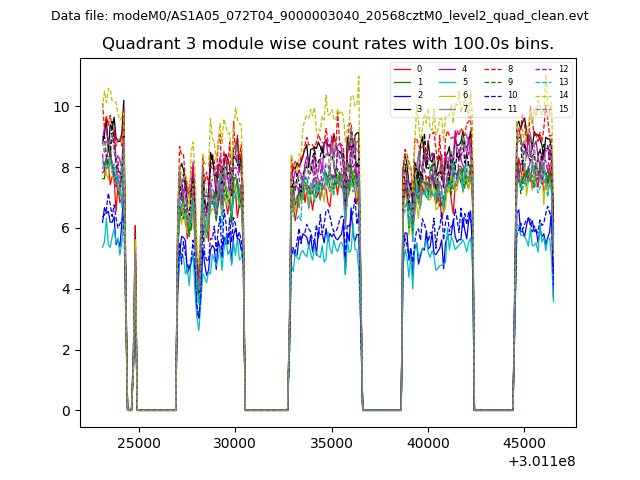
| Module-wise count rates for Quadrant C Data is divided into 100 sec bins |
 |
 |
| Module-wise count rates for Quadrant D Data is divided into 100 sec bins |
 |
 |
| Parameter | Plot |
|---|---|
| CZT HV Monitor | 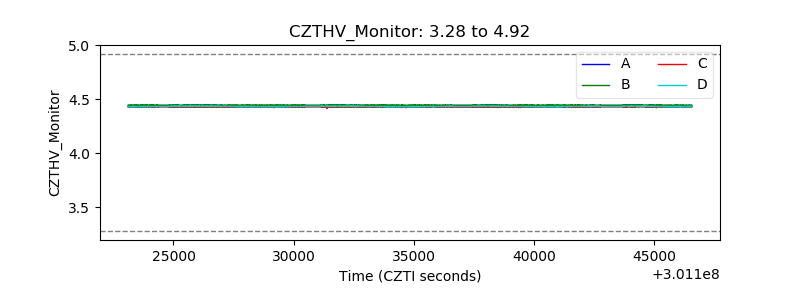 |
| D_VDD | 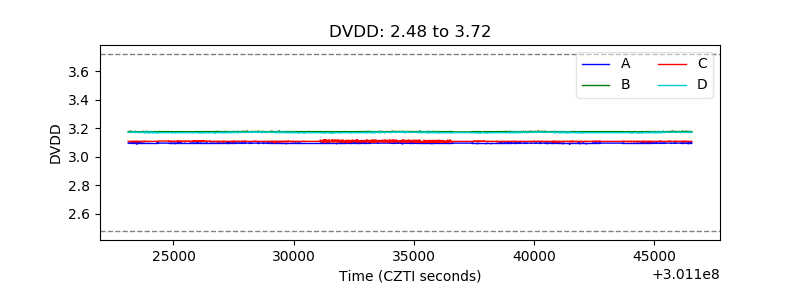 |
| Temperature 1 | 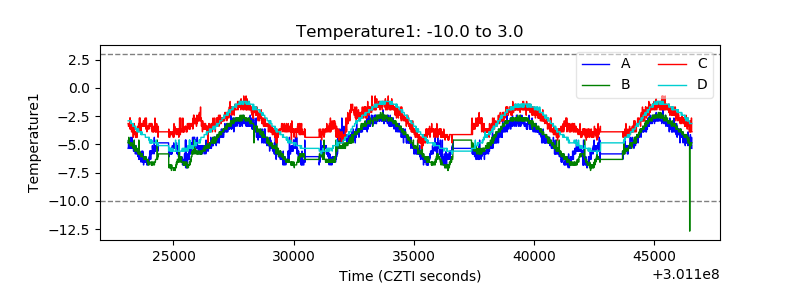 |
| Veto HV Monitor | 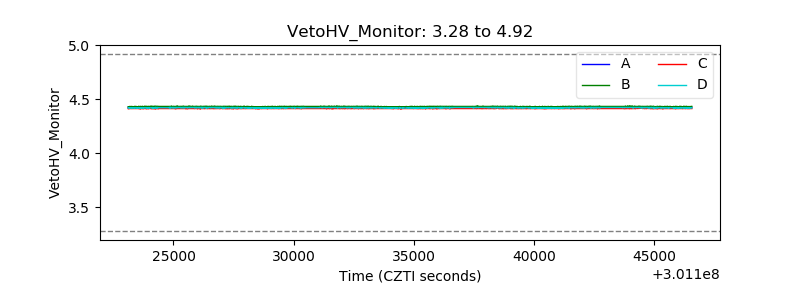 |
| Veto LLD | 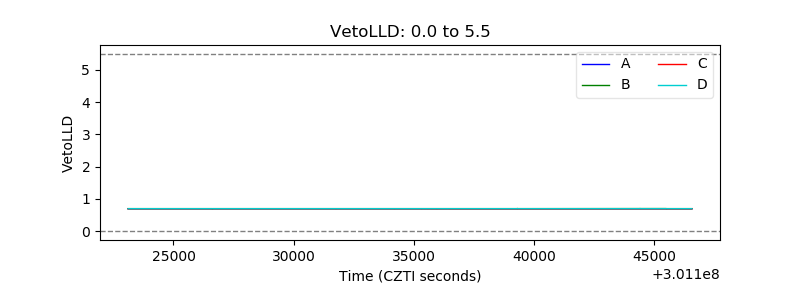 |
| Alpha Counter | 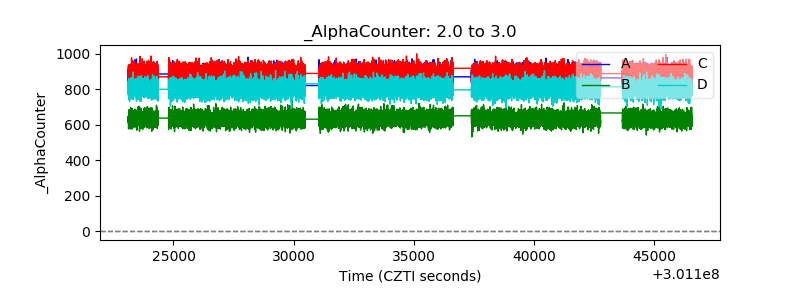 |
| _CPM_Rate | 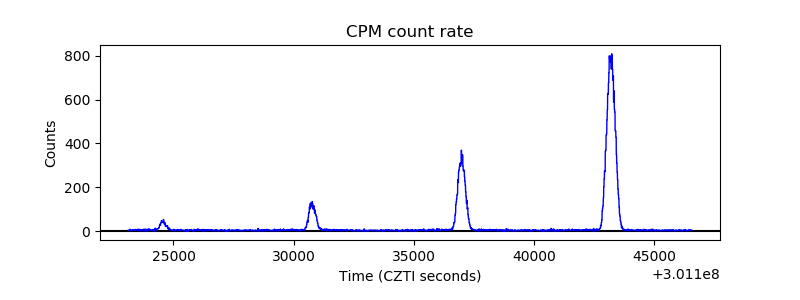 |
| CZT Counter | 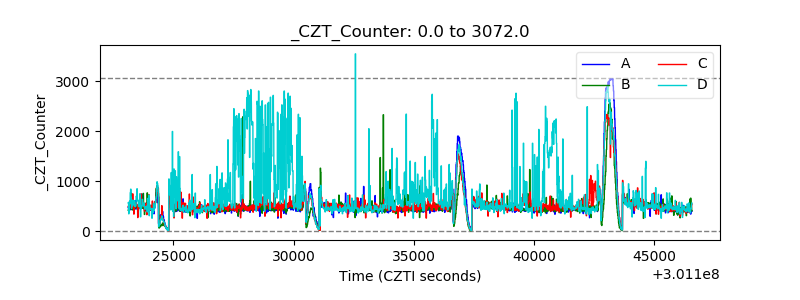 |
| +2.5 Volts monitor | 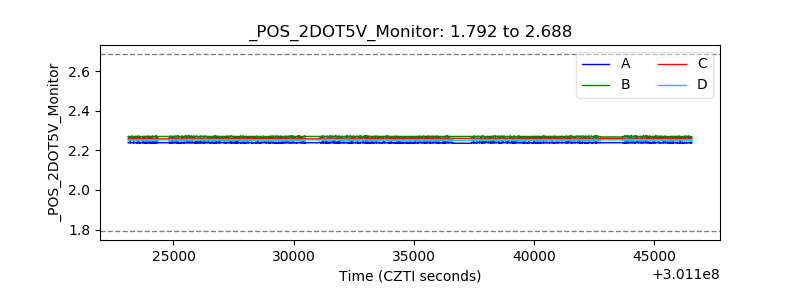 |
| +5 Volts monitor |  |
| _ROLL_ROT | 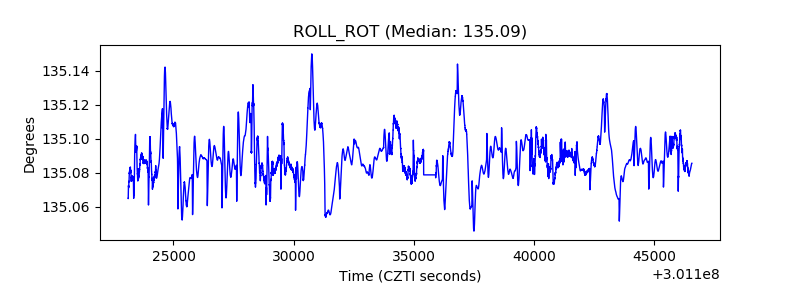 |
| _Roll_DEC | 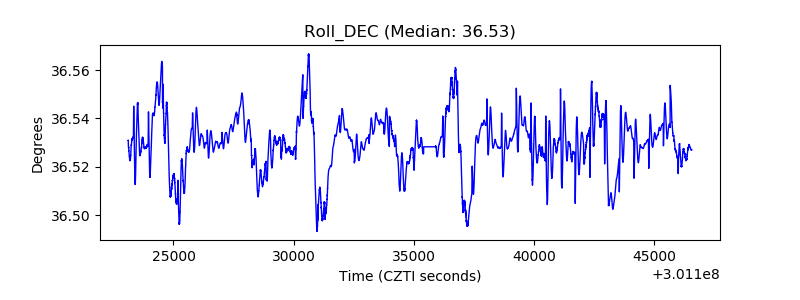 |
| _Roll_RA | 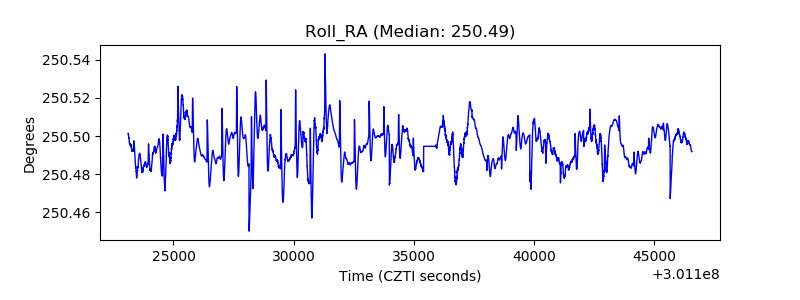 |
| Veto Counter | 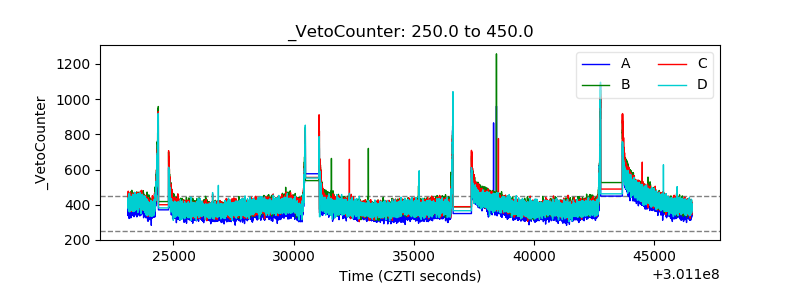 |