| Param | Original file | Final file |
|---|---|---|
| Filename | modeM0/AS1A05_088T03_9000003042cztM0_level2.fits | modeM0/AS1A05_088T03_9000003042cztM0_level2_quad_clean.evt |
| Size (bytes) | 209,108,160 | 221,592,960 |
| Size | 199.4 MB | 211.3 MB |
| Events in quadrant A | 1,330,616 | 1,425,213 |
| Events in quadrant B | 1,255,244 | 1,406,792 |
| Events in quadrant C | 1,291,934 | 1,359,303 |
| Events in quadrant D | 1,089,126 | 1,153,794 |
| Mode SS | |||
|---|---|---|---|
| Quadrant | BADHDUFLAG | Total packets | Discarded packets |
| A | 0 | 408 | 0 |
| B | 0 | 406 | 0 |
| C | 0 | 408 | 0 |
| D | 0 | 406 | 0 |
| Mode M9 | |||
|---|---|---|---|
| Quadrant | BADHDUFLAG | Total packets | Discarded packets |
| A | 0 | 51 | 0 |
| B | 0 | 50 | 0 |
| C | 0 | 50 | 0 |
| D | 0 | 50 | 0 |
| Mode M0 | |||
|---|---|---|---|
| Quadrant | BADHDUFLAG | Total packets | Discarded packets |
| A | 0 | 42589 | 0 |
| B | 0 | 44432 | 0 |
| C | 0 | 42555 | 0 |
| D | 0 | 53939 | 0 |
| Quadrant | Total seconds | Saturated seconds | Saturation percentage |
|---|---|---|---|
| A | 19817 | 266 | 1.342282% |
| B | 19817 | 296 | 1.493667% |
| C | 19823 | 361 | 1.821117% |
| D | 19828 | 1273 | 6.420214% |
Noise dominated data is calculated using 1-second bins in cleaned event files. If a bin has >2000 counts, and if more than 50% of those come from <1% of pixels, then it is considered to be noise-dominated and hence unusable.
| Quadrant | # 1 sec bins | Bins with >0 counts | Bins with >2000 counts | High rate bins dominated by noise | Noise dominated (total time) | Noise dominated (detector-on time) | Marked lightcurve |
|---|---|---|---|---|---|---|---|
| A | 22916 | 18222 | 0 | 0 | 0.00% | 0.00% | 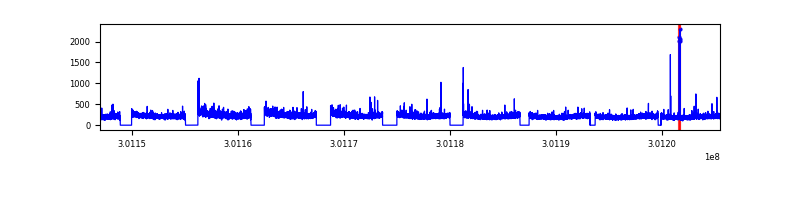 |
| B | 22916 | 18224 | 0 | 0 | 0.00% | 0.00% | 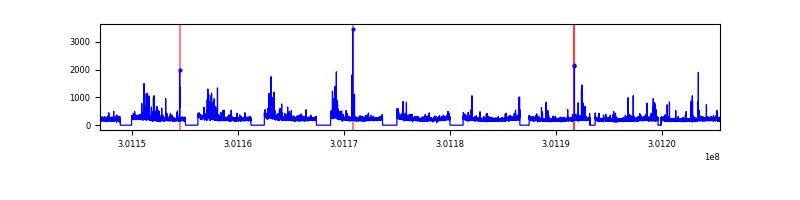 |
| C | 22916 | 18221 | 0 | 0 | 0.00% | 0.00% |  |
| D | 22916 | 18200 | 0 | 0 | 0.00% | 0.00% | 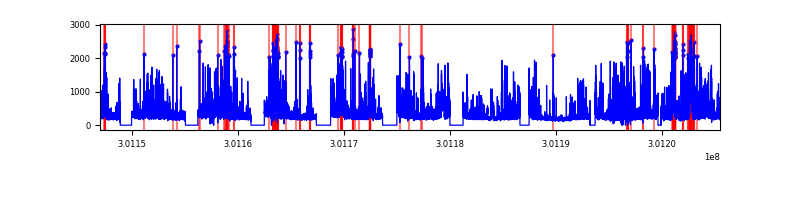 |
Top three noisy pixels from each quadrant. If the there are fewer than three noisy pixels in the level2.evt file, extra rows are filled as -1
| Pixel properties | Quadrant properties | ||||||
|---|---|---|---|---|---|---|---|
| Quadrant | DetID | PixID | Counts | Sigma | Mean | Median | Sigma |
| A | 0 | 29 | 1278 | 10.88 | 347 | 327 | 87.4 |
| A | 9 | 19 | 1042 | 8.18 | 347 | 327 | 87.4 |
| A | 7 | 110 | 1026 | 8.0 | 347 | 327 | 87.4 |
| B | 2 | 9 | 1011 | 10.37 | 332 | 318 | 66.8 |
| B | 5 | 128 | 855 | 8.04 | 332 | 318 | 66.8 |
| B | 2 | 8 | 838 | 7.78 | 332 | 318 | 66.8 |
| C | 12 | 249 | 876 | 6.25 | 341 | 321 | 88.7 |
| C | 12 | 241 | 874 | 6.23 | 341 | 321 | 88.7 |
| C | 2 | 191 | 857 | 6.04 | 341 | 321 | 88.7 |
| D | 10 | 189 | 848 | 6.72 | 311 | 285 | 83.8 |
| D | 7 | 5 | 779 | 5.9 | 311 | 285 | 83.8 |
| D | 6 | 231 | 778 | 5.88 | 311 | 285 | 83.8 |
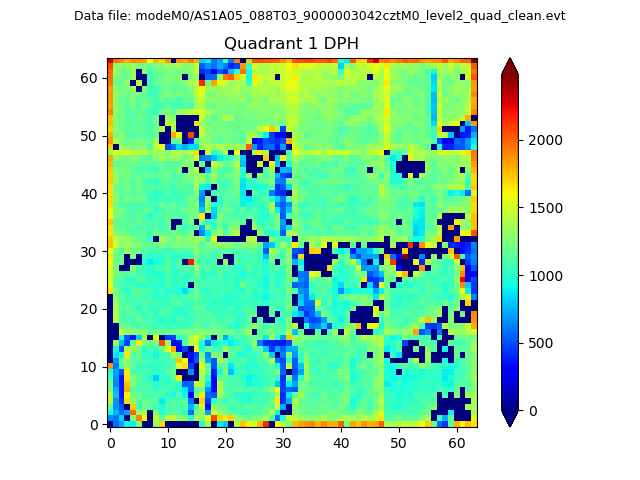
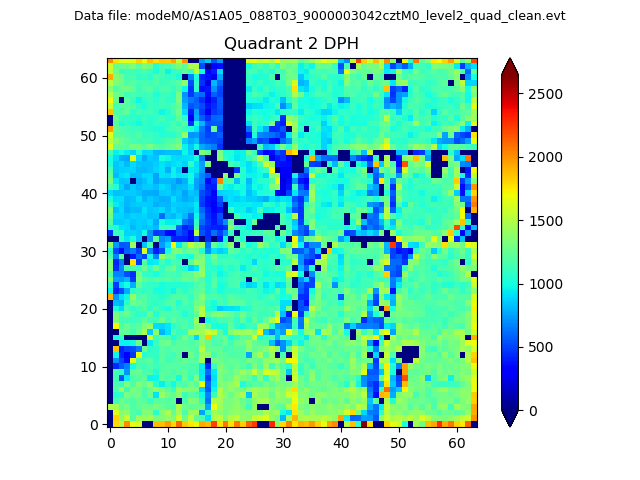
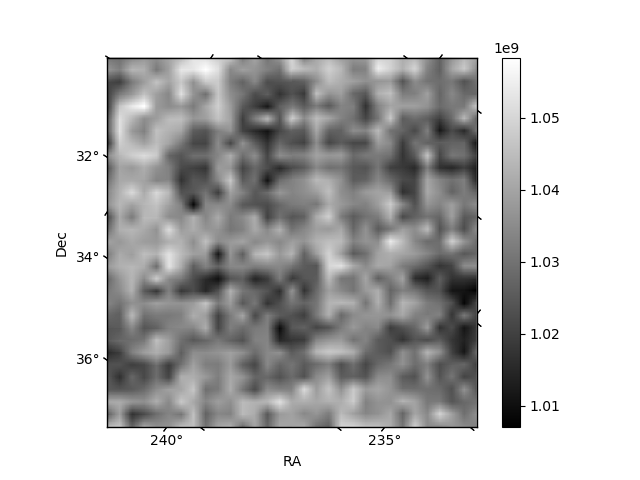
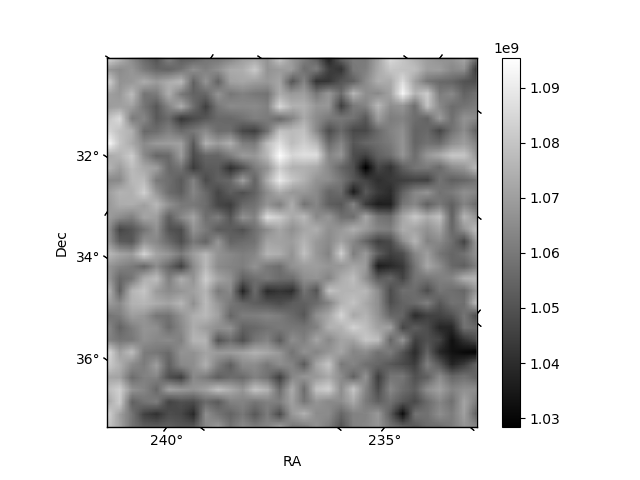
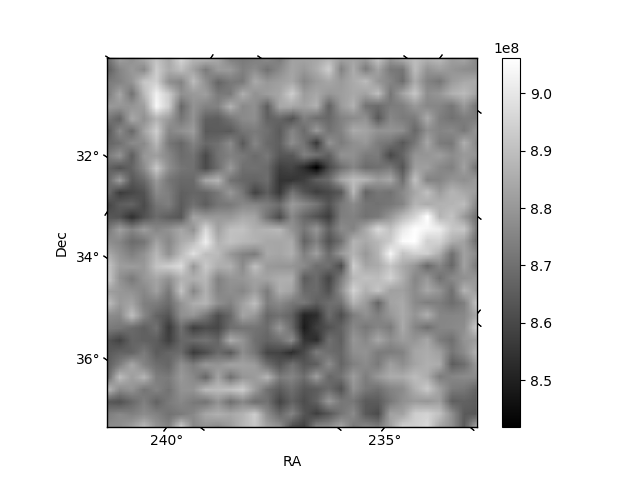
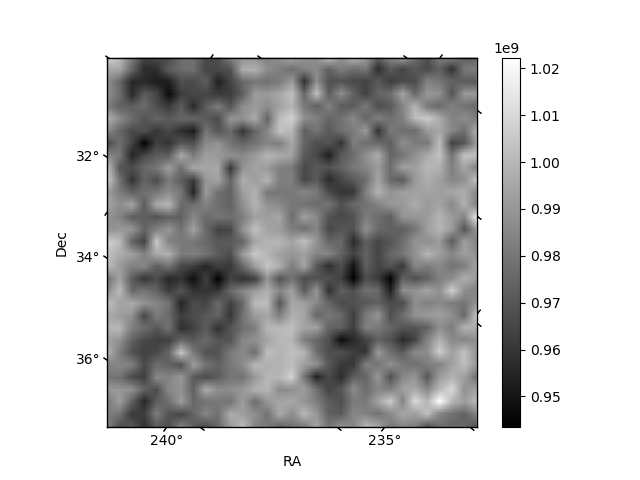
Histogram calculated using DETX and DETY for each event in the final _common_clean file
| Quadrant A | 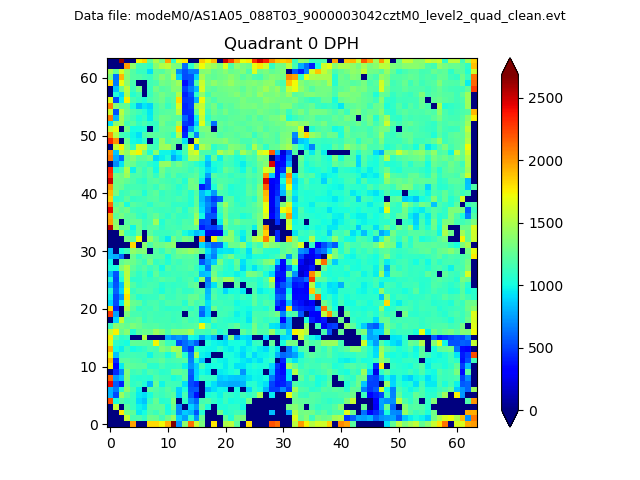 |
 |
Quadrant B |
|---|---|---|---|
| Quadrant D | 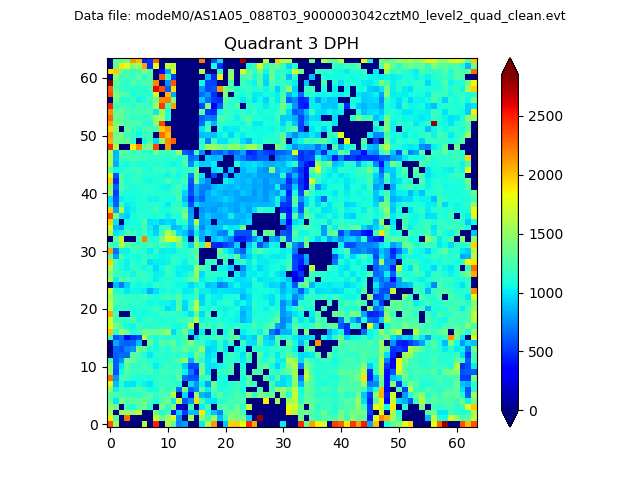 |
 |
Quadrant C |
| Plot type | Count rate plots | Images |
|---|---|---|
| Comparison with Poisson distribution Blue bars denote a histogram of data divided into 1 sec bins. Red curve is a Poisson curve with rate = median count rate of data. |
 |
 |
| Quadrant-wise count rates Data is divided into 100 sec bins |
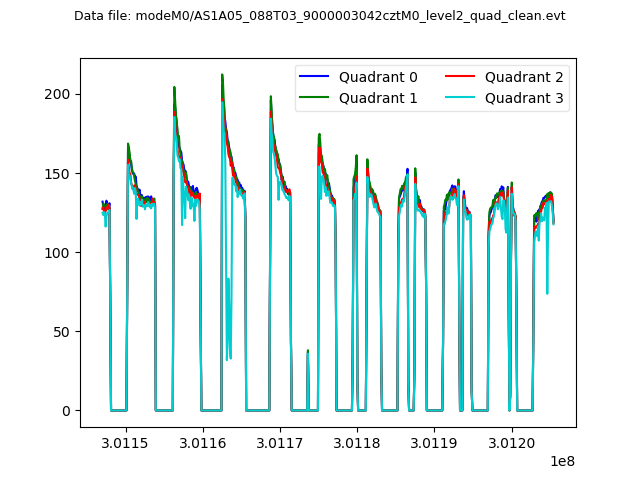 |
|
| Module-wise count rates for Quadrant A Data is divided into 100 sec bins |
 |
 |
| Module-wise count rates for Quadrant B Data is divided into 100 sec bins |
 |
 |
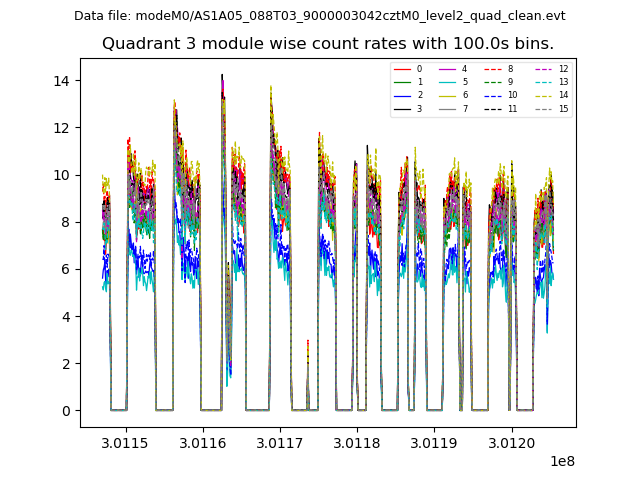
| Module-wise count rates for Quadrant C Data is divided into 100 sec bins |
 |
 |
| Module-wise count rates for Quadrant D Data is divided into 100 sec bins |
 |
 |
| Parameter | Plot |
|---|---|
| CZT HV Monitor | 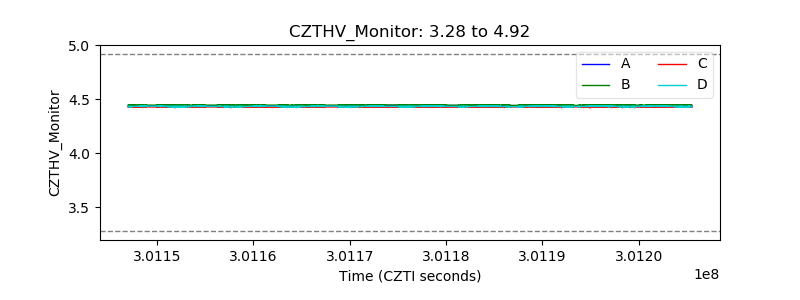 |
| D_VDD | 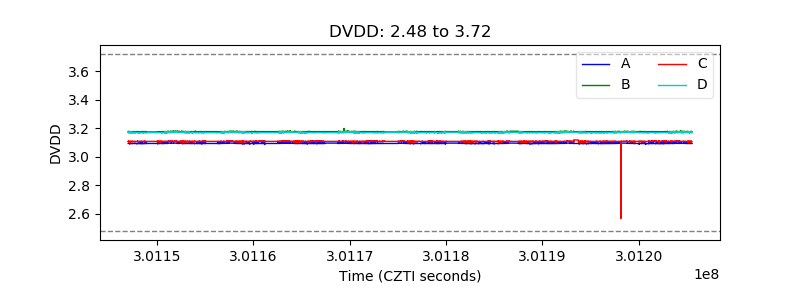 |
| Temperature 1 | 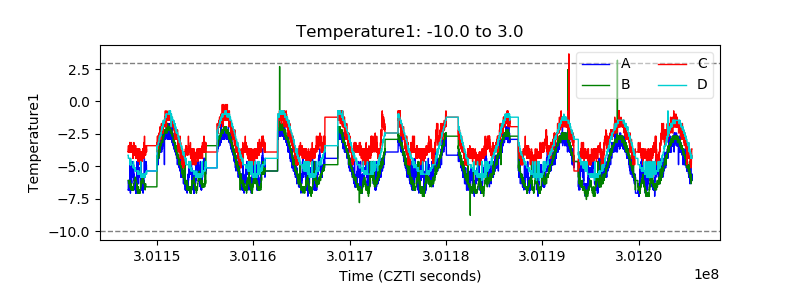 |
| Veto HV Monitor |  |
| Veto LLD | 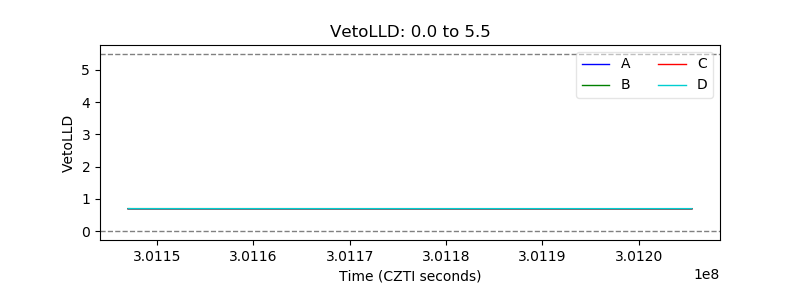 |
| Alpha Counter | 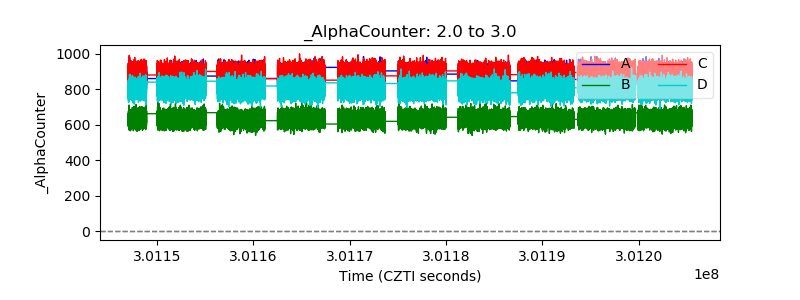 |
| _CPM_Rate | 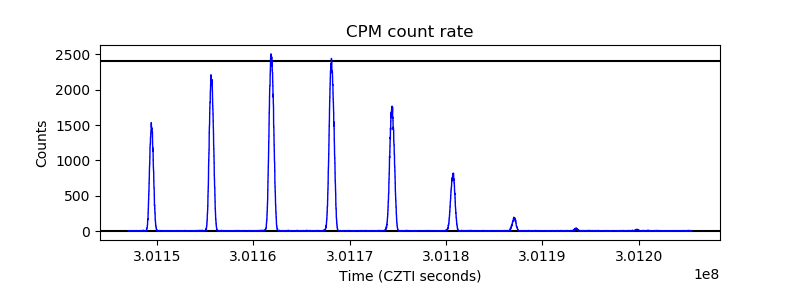 |
| CZT Counter | 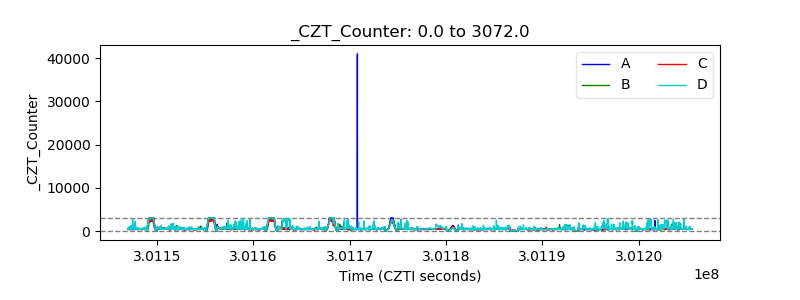 |
| +2.5 Volts monitor | 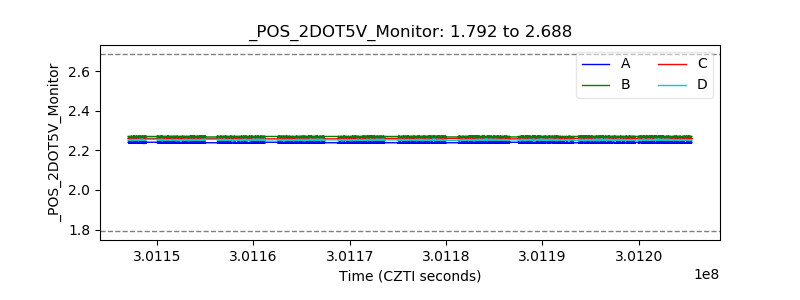 |
| +5 Volts monitor |  |
| _ROLL_ROT | 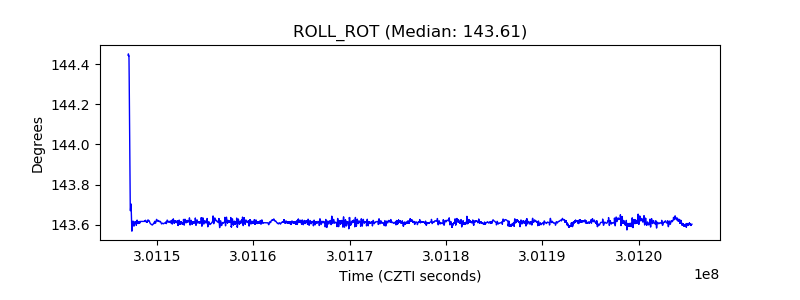 |
| _Roll_DEC | 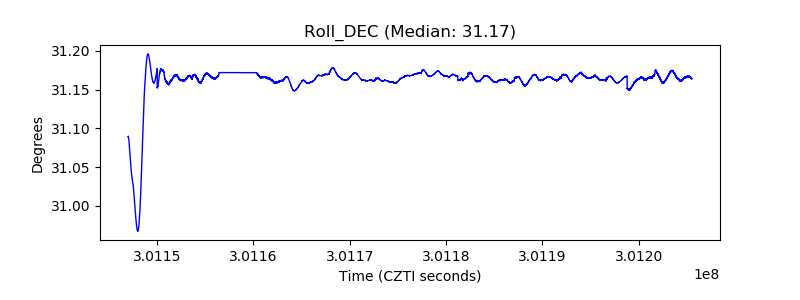 |
| _Roll_RA |  |
| Veto Counter | 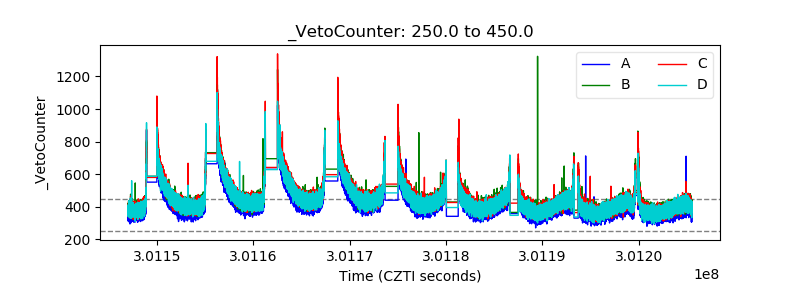 |