| Param | Original file | Final file |
|---|---|---|
| Filename | modeM0/AS1A05_088T03_9000003042_20566cztM0_level2.evt | modeM0/AS1A05_088T03_9000003042_20566cztM0_level2_quad_clean.evt |
| Size (bytes) | 469,566,720 | 113,808,960 |
| Size | 447.8 MB | 108.5 MB |
| Events in quadrant A | 3,213,802 | 772,232 |
| Events in quadrant B | 3,469,946 | 769,428 |
| Events in quadrant C | 3,240,281 | 742,338 |
| Events in quadrant D | 3,868,109 | 722,332 |
| Mode SS | |||
|---|---|---|---|
| Quadrant | BADHDUFLAG | Total packets | Discarded packets |
| A | 0 | 128 | 0 |
| B | 0 | 128 | 0 |
| C | 0 | 128 | 0 |
| D | 0 | 128 | 0 |
| Mode M9 | |||
|---|---|---|---|
| Quadrant | BADHDUFLAG | Total packets | Discarded packets |
| A | 0 | 12 | 0 |
| B | 0 | 12 | 0 |
| C | 0 | 12 | 0 |
| D | 0 | 12 | 0 |
| Mode M0 | |||
|---|---|---|---|
| Quadrant | BADHDUFLAG | Total packets | Discarded packets |
| A | 0 | 13691 | 1 |
| B | 0 | 14525 | 1 |
| C | 0 | 13629 | 1 |
| D | 0 | 15696 | 1 |
| Quadrant | Total seconds | Saturated seconds | Saturation percentage |
|---|---|---|---|
| A | 6314 | 76 | 1.203674% |
| B | 6314 | 79 | 1.251188% |
| C | 6315 | 95 | 1.504355% |
| D | 6315 | 199 | 3.151227% |
Noise dominated data is calculated using 1-second bins in cleaned event files. If a bin has >2000 counts, and if more than 50% of those come from <1% of pixels, then it is considered to be noise-dominated and hence unusable.
| Quadrant | # 1 sec bins | Bins with >0 counts | Bins with >2000 counts | High rate bins dominated by noise | Noise dominated (total time) | Noise dominated (detector-on time) | Marked lightcurve |
|---|---|---|---|---|---|---|---|
| A | 7489 | 6315 | 0 | 0 | 0.00% | 0.00% |  |
| B | 7489 | 6315 | 10 | 10 | 0.13% | 0.16% | 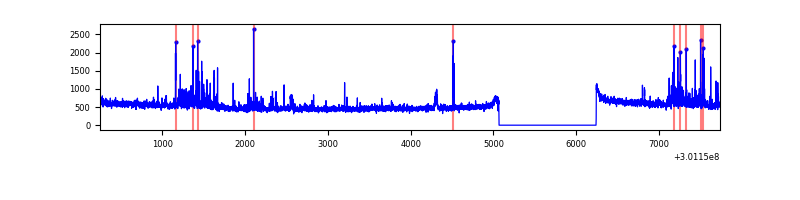 |
| C | 7490 | 6316 | 0 | 0 | 0.00% | 0.00% | 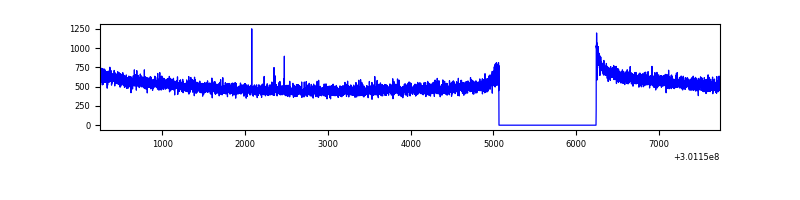 |
| D | 7490 | 6316 | 80 | 80 | 1.07% | 1.27% | 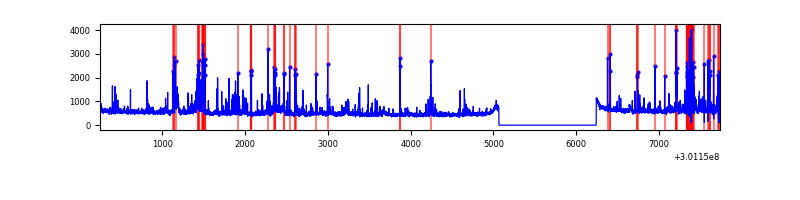 |
Top three noisy pixels from each quadrant. If the there are fewer than three noisy pixels in the level2.evt file, extra rows are filled as -1
| Pixel properties | Quadrant properties | ||||||
|---|---|---|---|---|---|---|---|
| Quadrant | DetID | PixID | Counts | Sigma | Mean | Median | Sigma |
| A | 6 | 16 | 20522 | 119.16 | 827 | 810 | 165.4 |
| A | 0 | 226 | 7230 | 38.81 | 827 | 810 | 165.4 |
| A | 3 | 137 | 6465 | 34.19 | 827 | 810 | 165.4 |
| B | 7 | 220 | 176209 | 1143.38 | 814 | 794 | 153.4 |
| B | 0 | 197 | 26752 | 169.2 | 814 | 794 | 153.4 |
| B | 12 | 111 | 18061 | 112.55 | 814 | 794 | 153.4 |
| C | 14 | 238 | 123781 | 671.98 | 792 | 798 | 183.0 |
| C | 3 | 9 | 15510 | 80.39 | 792 | 798 | 183.0 |
| C | 3 | 233 | 12779 | 65.46 | 792 | 798 | 183.0 |
| D | 1 | 52 | 437735 | 2254.95 | 802 | 783 | 193.8 |
| D | 7 | 238 | 107103 | 548.68 | 802 | 783 | 193.8 |
| D | 13 | 153 | 77959 | 398.28 | 802 | 783 | 193.8 |
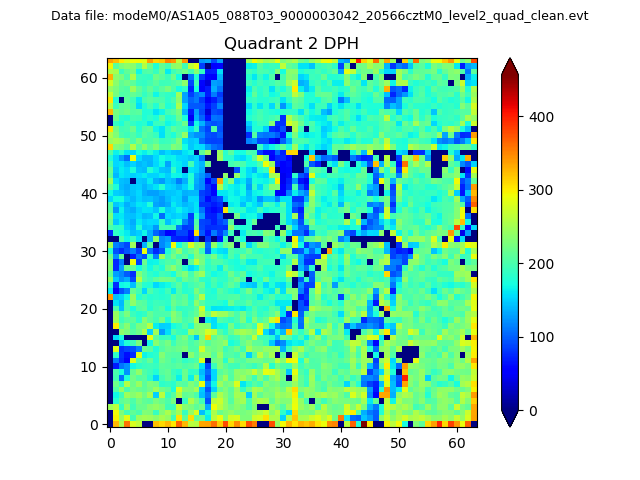
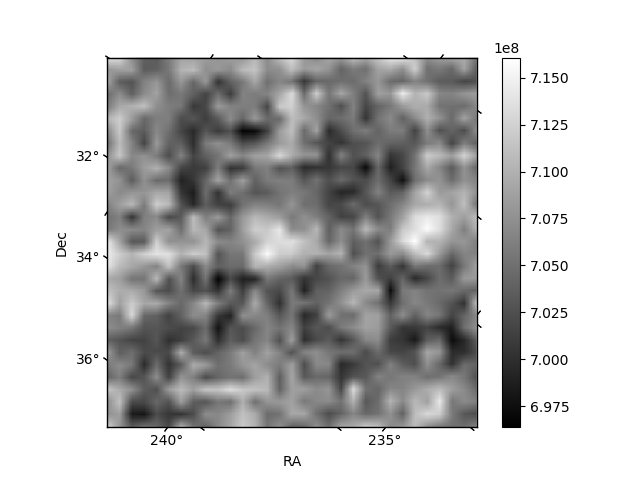
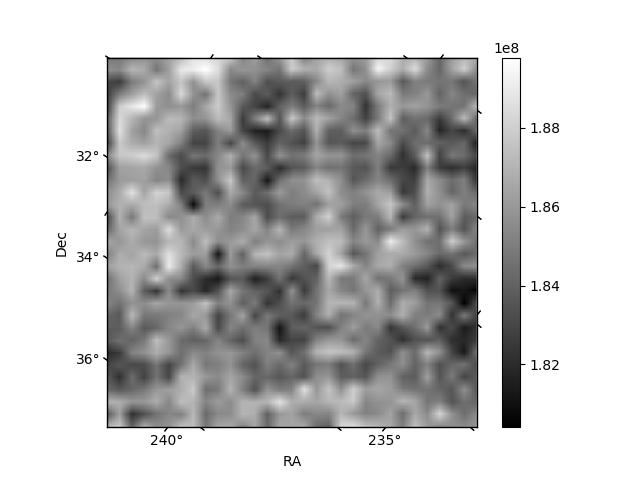
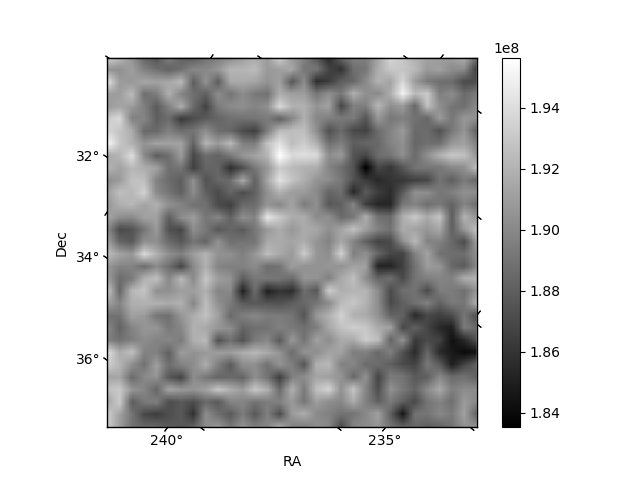
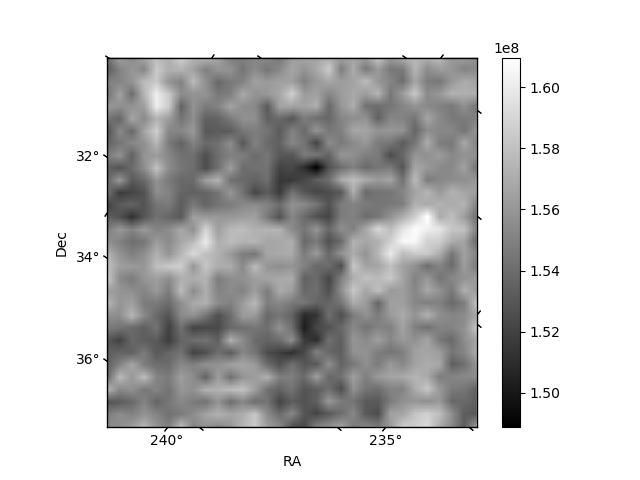
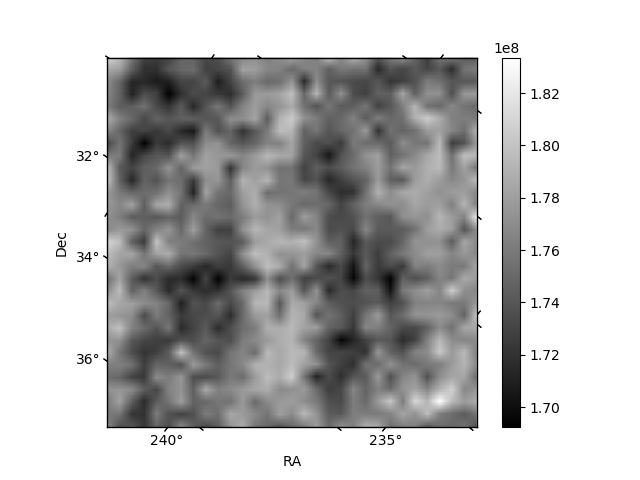
Histogram calculated using DETX and DETY for each event in the final _common_clean file
| Quadrant A |  |
 |
Quadrant B |
|---|---|---|---|
| Quadrant D |  |
 |
Quadrant C |
| Plot type | Count rate plots | Images |
|---|---|---|
| Comparison with Poisson distribution Blue bars denote a histogram of data divided into 1 sec bins. Red curve is a Poisson curve with rate = median count rate of data. |
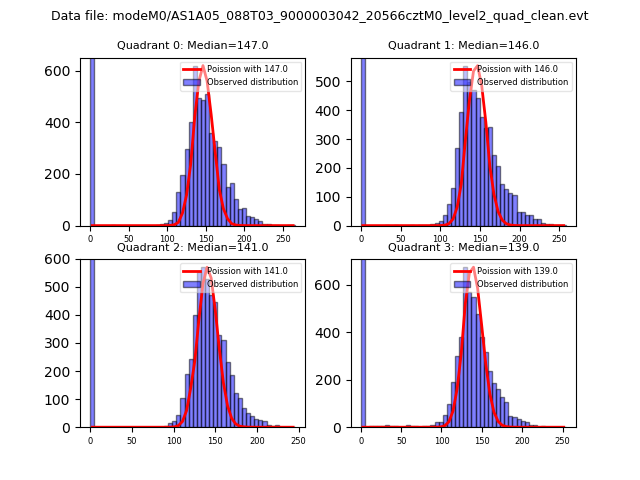 |
 |
| Quadrant-wise count rates Data is divided into 100 sec bins |
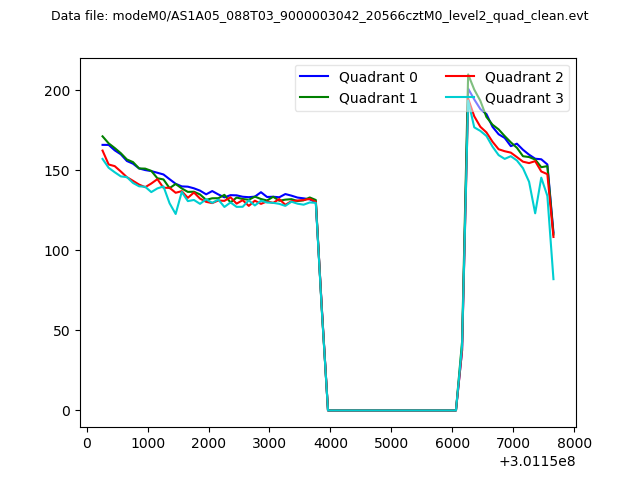 |
|
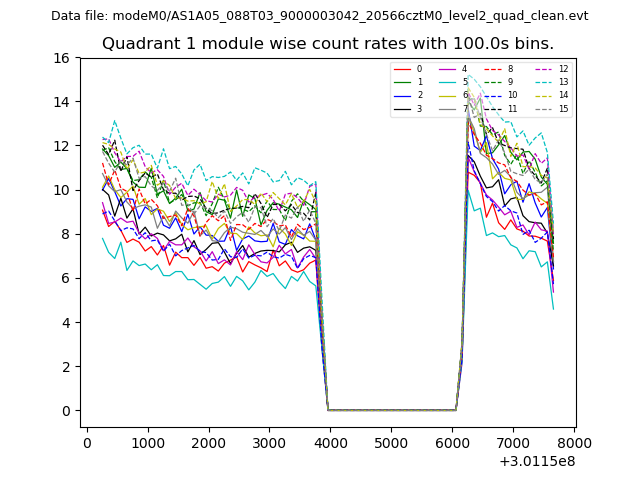
| Module-wise count rates for Quadrant A Data is divided into 100 sec bins |
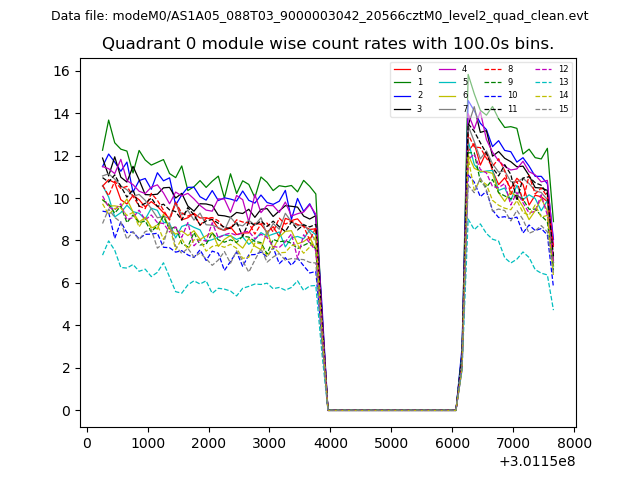 |
 |
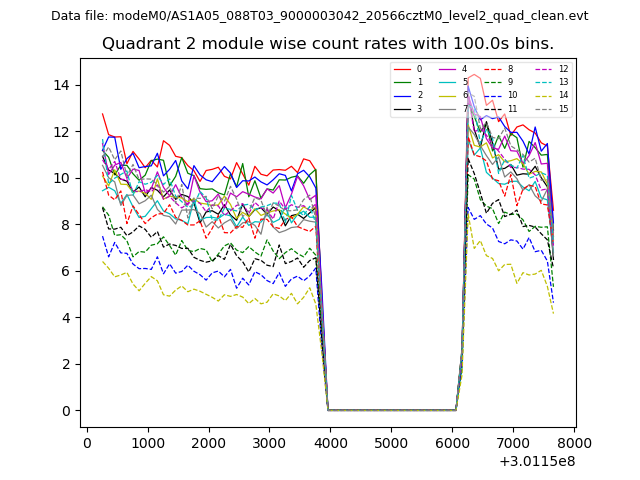
| Module-wise count rates for Quadrant B Data is divided into 100 sec bins |
 |
 |
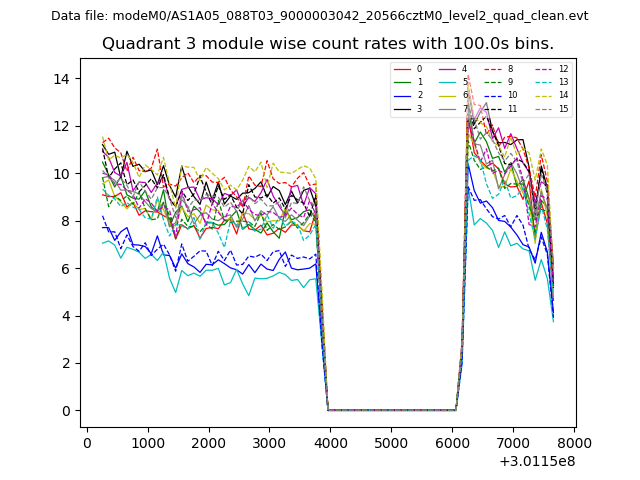
| Module-wise count rates for Quadrant C Data is divided into 100 sec bins |
 |
 |
| Module-wise count rates for Quadrant D Data is divided into 100 sec bins |
 |
 |
| Parameter | Plot |
|---|---|
| CZT HV Monitor | 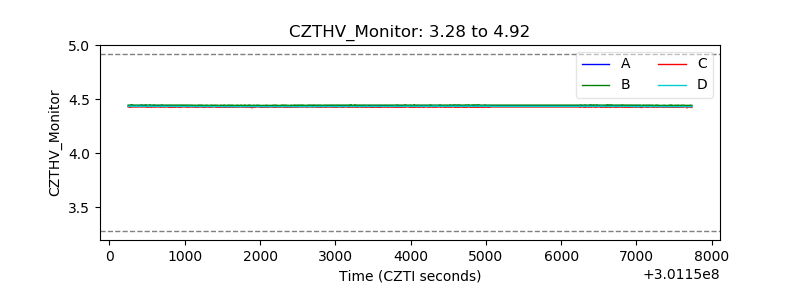 |
| D_VDD |  |
| Temperature 1 | 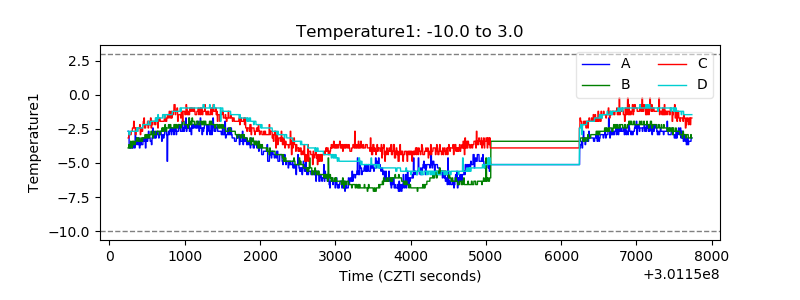 |
| Veto HV Monitor | 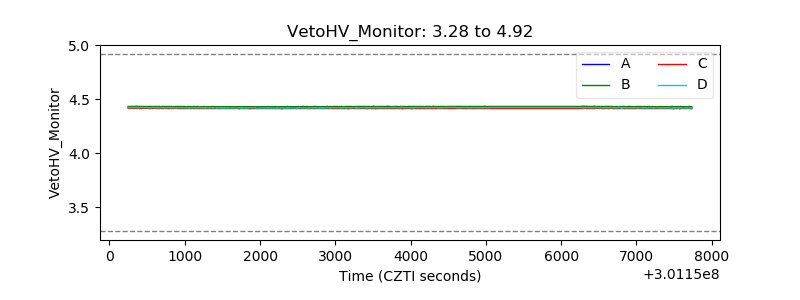 |
| Veto LLD | 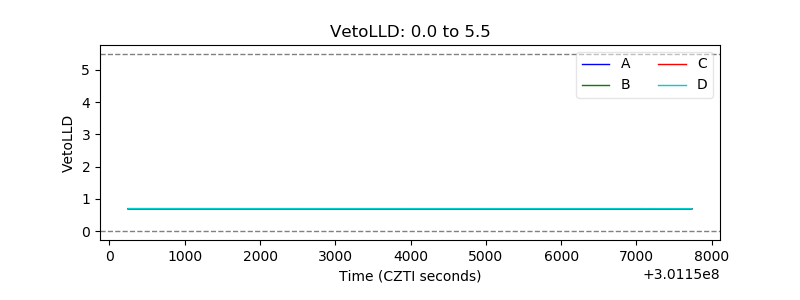 |
| Alpha Counter | 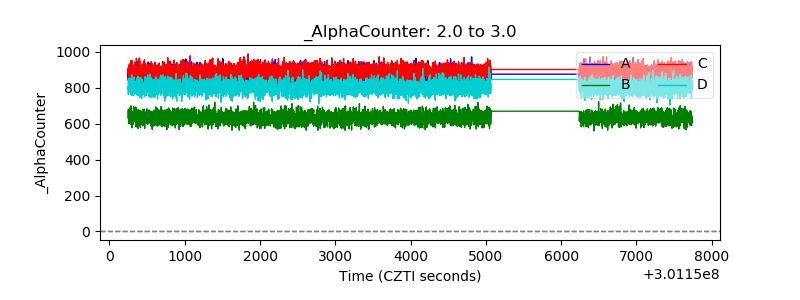 |
| _CPM_Rate | 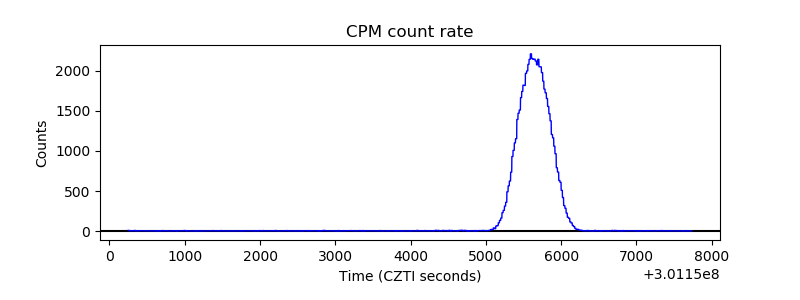 |
| CZT Counter | 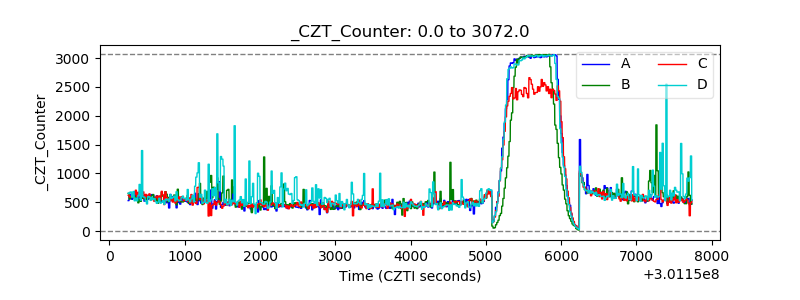 |
| +2.5 Volts monitor |  |
| +5 Volts monitor | 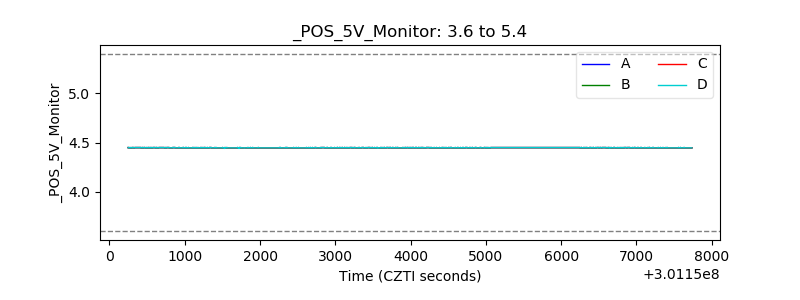 |
| _ROLL_ROT | 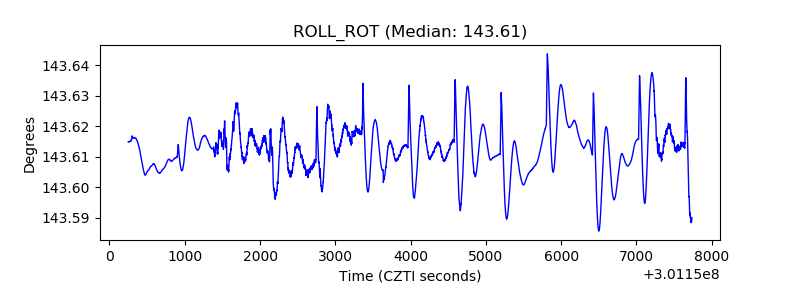 |
| _Roll_DEC | 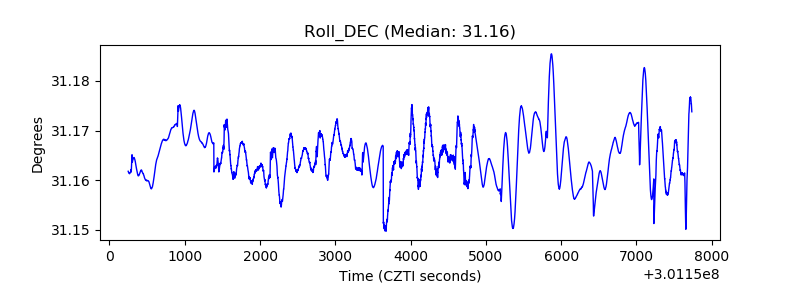 |
| _Roll_RA | 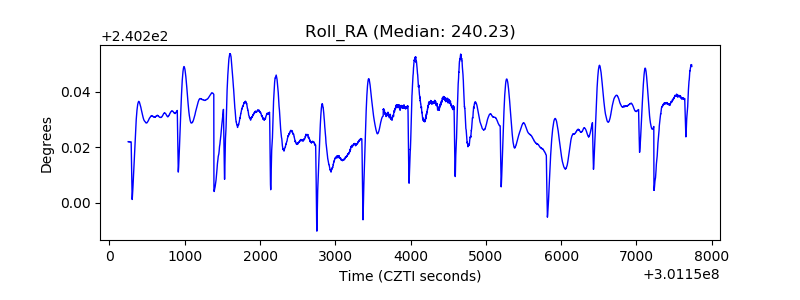 |
| Veto Counter | 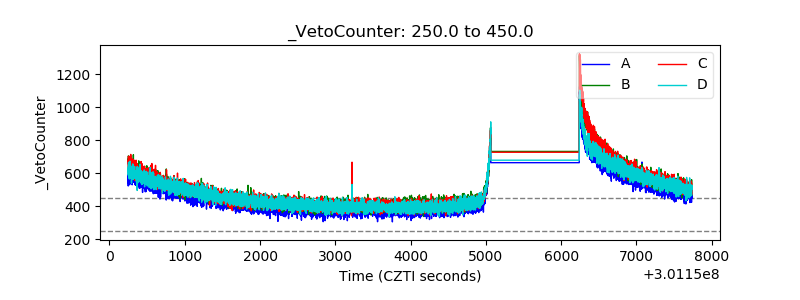 |