| Param | Original file | Final file |
|---|---|---|
| Filename | modeM0/AS1A05_088T03_9000003042_20568cztM0_level2.evt | modeM0/AS1A05_088T03_9000003042_20568cztM0_level2_quad_clean.evt |
| Size (bytes) | 1,388,272,320 | 281,079,360 |
| Size | 1.3 GB | 268.1 MB |
| Events in quadrant A | 9,141,051 | 1,883,787 |
| Events in quadrant B | 9,728,732 | 1,874,072 |
| Events in quadrant C | 9,259,498 | 1,825,334 |
| Events in quadrant D | 12,695,077 | 1,685,749 |
| Mode SS | |||
|---|---|---|---|
| Quadrant | BADHDUFLAG | Total packets | Discarded packets |
| A | 0 | 370 | 0 |
| B | 0 | 370 | 0 |
| C | 0 | 370 | 0 |
| D | 0 | 370 | 0 |
| Mode M9 | |||
|---|---|---|---|
| Quadrant | BADHDUFLAG | Total packets | Discarded packets |
| A | 0 | 48 | 0 |
| B | 0 | 48 | 0 |
| C | 0 | 48 | 0 |
| D | 0 | 48 | 0 |
| Mode M0 | |||
|---|---|---|---|
| Quadrant | BADHDUFLAG | Total packets | Discarded packets |
| A | 0 | 38905 | 4 |
| B | 0 | 40669 | 4 |
| C | 0 | 38844 | 4 |
| D | 0 | 49845 | 4 |
| Quadrant | Total seconds | Saturated seconds | Saturation percentage |
|---|---|---|---|
| A | 18056 | 257 | 1.423350% |
| B | 18056 | 289 | 1.600576% |
| C | 18056 | 338 | 1.871954% |
| D | 18056 | 1257 | 6.961675% |
Noise dominated data is calculated using 1-second bins in cleaned event files. If a bin has >2000 counts, and if more than 50% of those come from <1% of pixels, then it is considered to be noise-dominated and hence unusable.
| Quadrant | # 1 sec bins | Bins with >0 counts | Bins with >2000 counts | High rate bins dominated by noise | Noise dominated (total time) | Noise dominated (detector-on time) | Marked lightcurve |
|---|---|---|---|---|---|---|---|
| A | 22916 | 18059 | 0 | 0 | 0.00% | 0.00% | 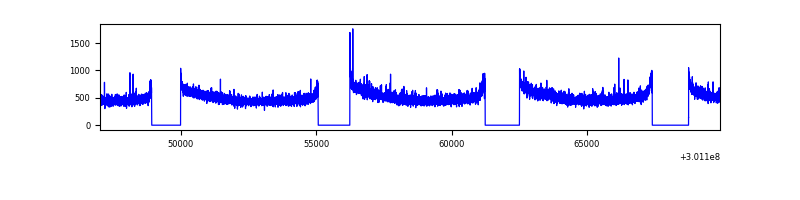 |
| B | 22916 | 18059 | 28 | 28 | 0.12% | 0.16% | 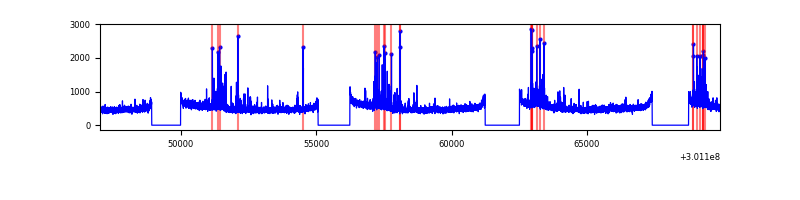 |
| C | 22916 | 18059 | 0 | 0 | 0.00% | 0.00% | 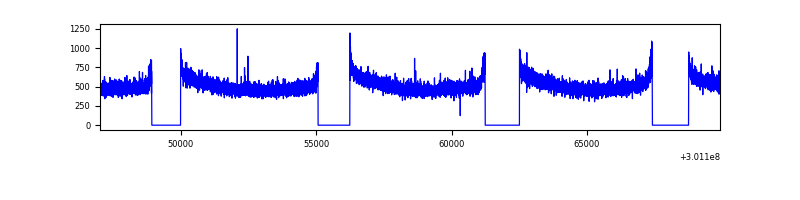 |
| D | 22916 | 18059 | 872 | 872 | 3.81% | 4.83% | 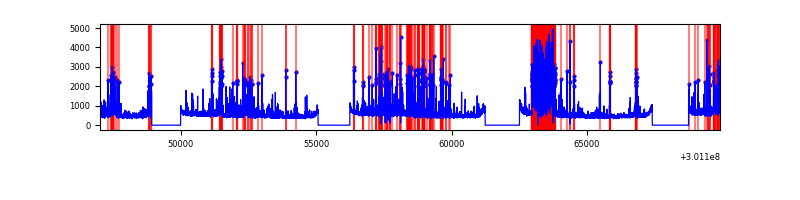 |
Top three noisy pixels from each quadrant. If the there are fewer than three noisy pixels in the level2.evt file, extra rows are filled as -1
| Pixel properties | Quadrant properties | ||||||
|---|---|---|---|---|---|---|---|
| Quadrant | DetID | PixID | Counts | Sigma | Mean | Median | Sigma |
| A | 6 | 16 | 95918 | 200.88 | 2345 | 2297 | 466.1 |
| A | 8 | 205 | 24291 | 47.19 | 2345 | 2297 | 466.1 |
| A | 0 | 226 | 20456 | 38.96 | 2345 | 2297 | 466.1 |
| B | 7 | 220 | 376532 | 875.8 | 2321 | 2269 | 427.3 |
| B | 0 | 197 | 87285 | 198.94 | 2321 | 2269 | 427.3 |
| B | 0 | 219 | 68875 | 155.86 | 2321 | 2269 | 427.3 |
| C | 14 | 238 | 353938 | 676.92 | 2260 | 2280 | 519.5 |
| C | 3 | 9 | 64381 | 119.54 | 2260 | 2280 | 519.5 |
| C | 3 | 233 | 16976 | 28.29 | 2260 | 2280 | 519.5 |
| D | 5 | 222 | 2288634 | 4298.84 | 2216 | 2160 | 531.9 |
| D | 1 | 52 | 1097371 | 2059.13 | 2216 | 2160 | 531.9 |
| D | 7 | 238 | 231938 | 432.01 | 2216 | 2160 | 531.9 |
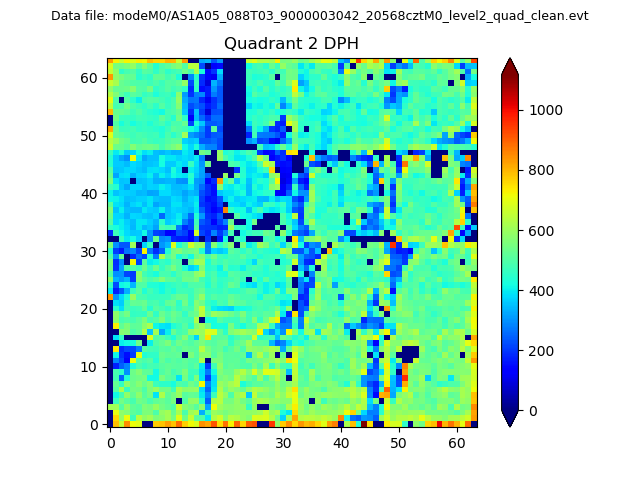
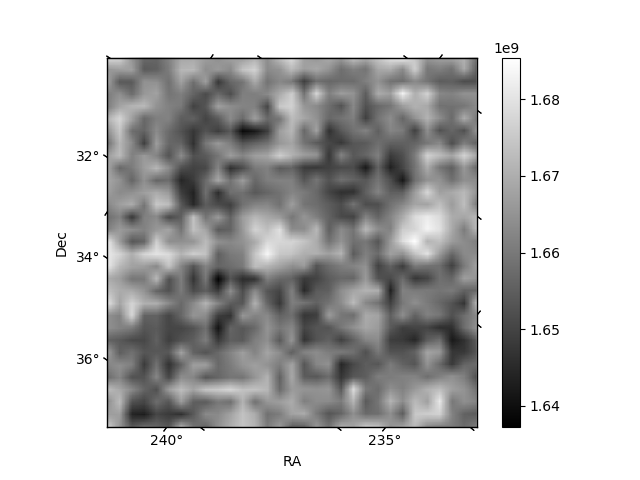
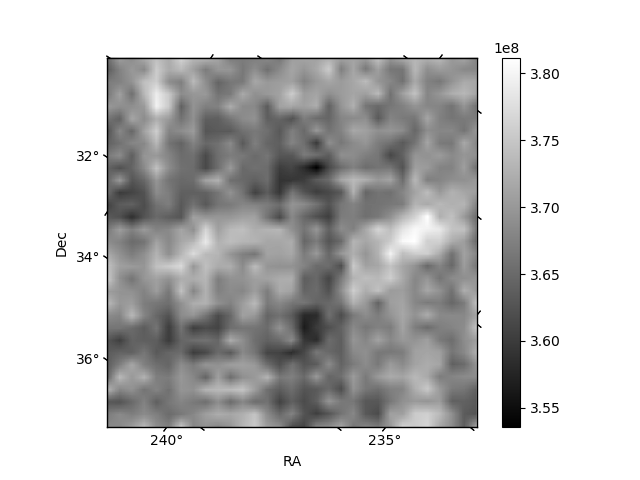
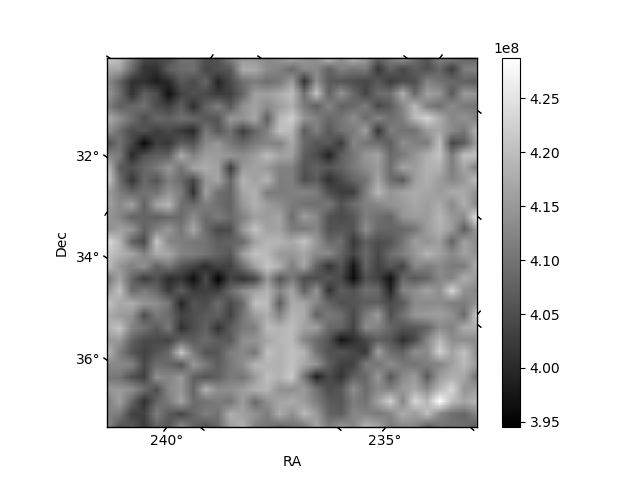
Histogram calculated using DETX and DETY for each event in the final _common_clean file
| Quadrant A | 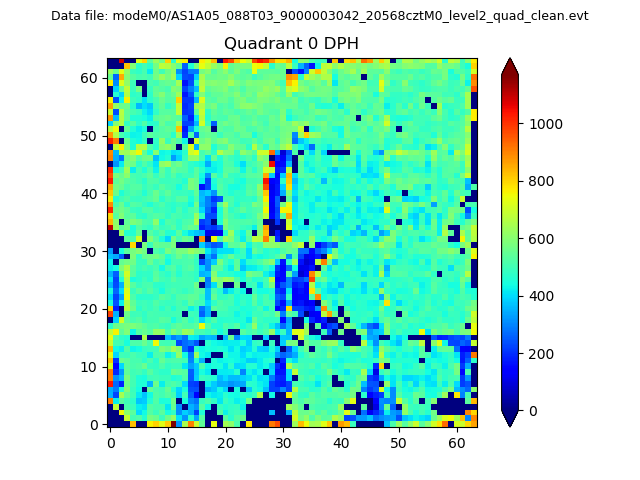 |
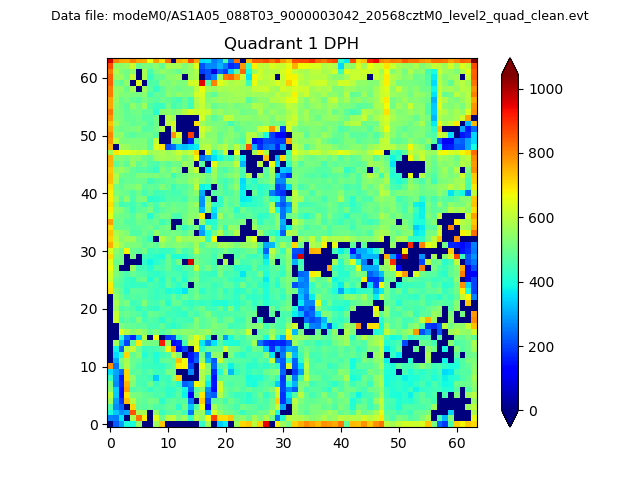 |
Quadrant B |
|---|---|---|---|
| Quadrant D | 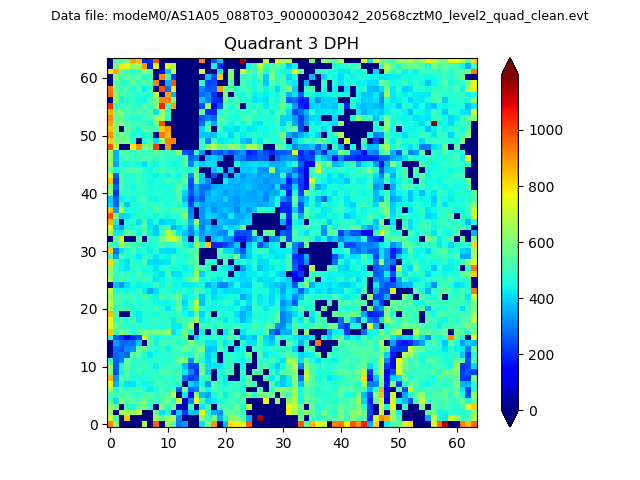 |
 |
Quadrant C |
| Plot type | Count rate plots | Images |
|---|---|---|
| Comparison with Poisson distribution Blue bars denote a histogram of data divided into 1 sec bins. Red curve is a Poisson curve with rate = median count rate of data. |
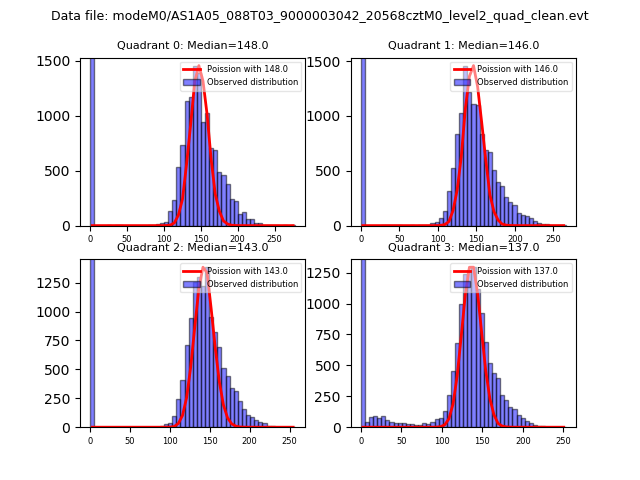 |
 |
| Quadrant-wise count rates Data is divided into 100 sec bins |
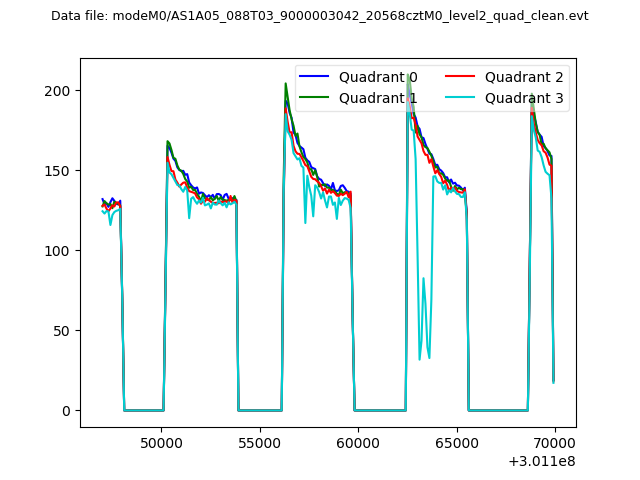 |
|
| Module-wise count rates for Quadrant A Data is divided into 100 sec bins |
 |
 |
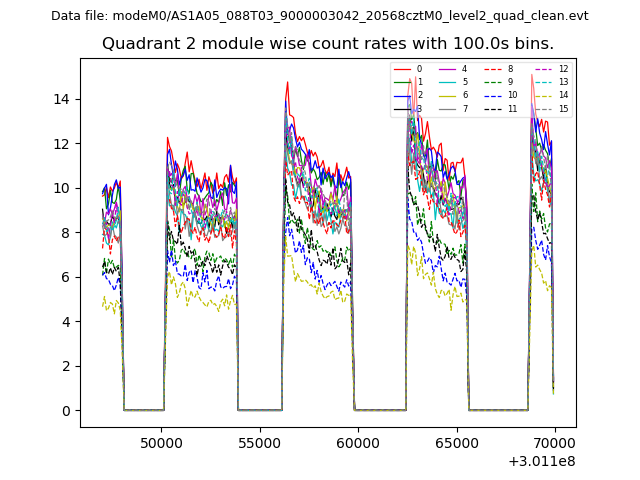
| Module-wise count rates for Quadrant B Data is divided into 100 sec bins |
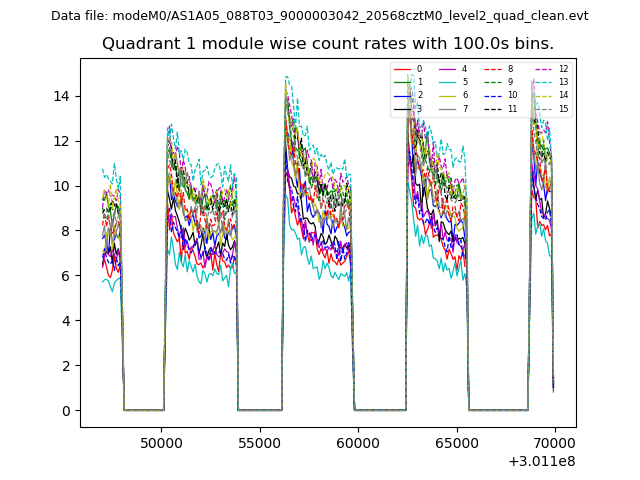 |
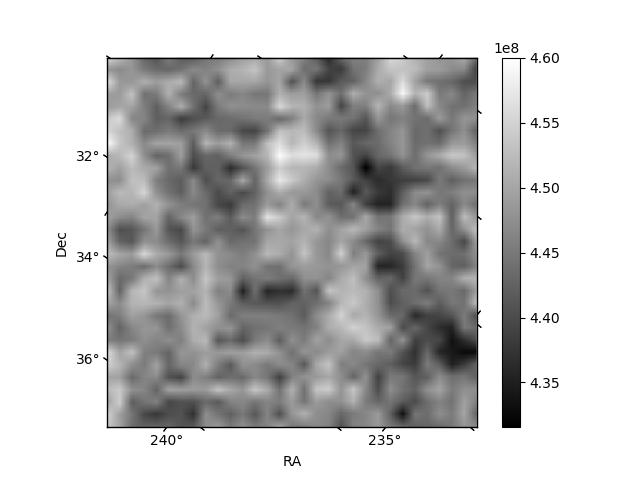 |
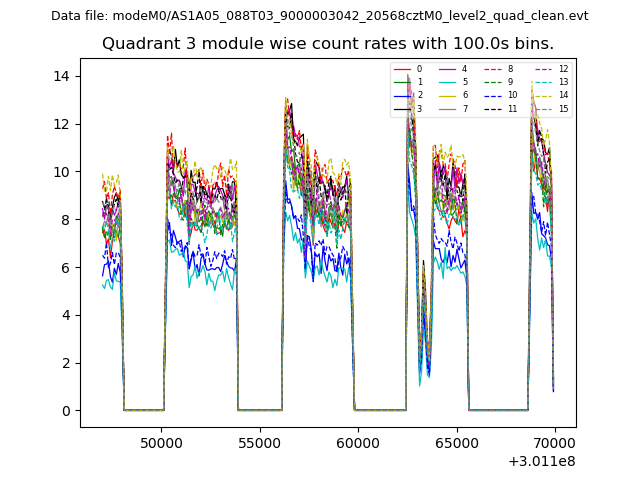
| Module-wise count rates for Quadrant C Data is divided into 100 sec bins |
 |
 |
| Module-wise count rates for Quadrant D Data is divided into 100 sec bins |
 |
 |
| Parameter | Plot |
|---|---|
| CZT HV Monitor | 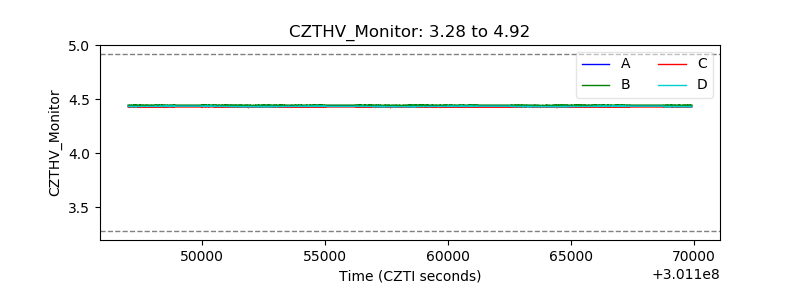 |
| D_VDD |  |
| Temperature 1 | 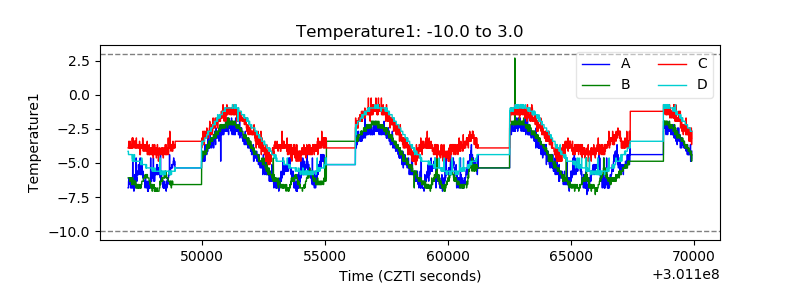 |
| Veto HV Monitor | 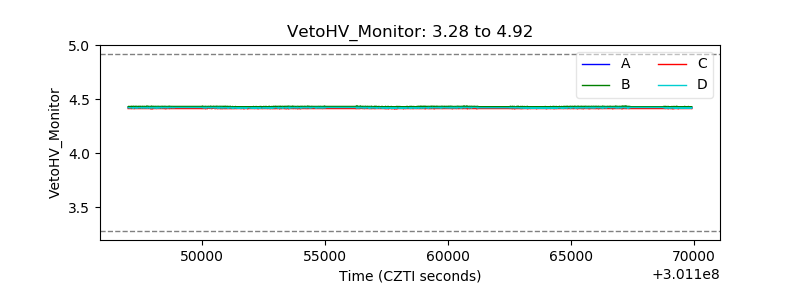 |
| Veto LLD | 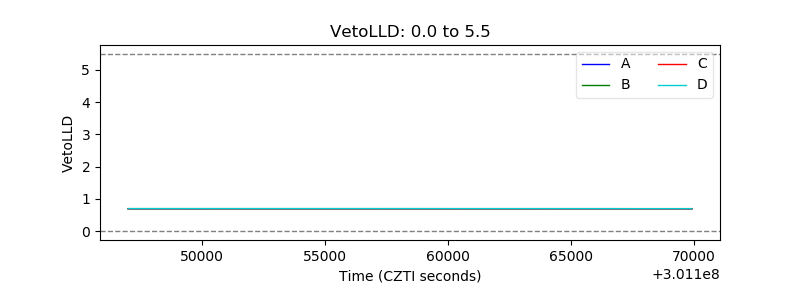 |
| Alpha Counter | 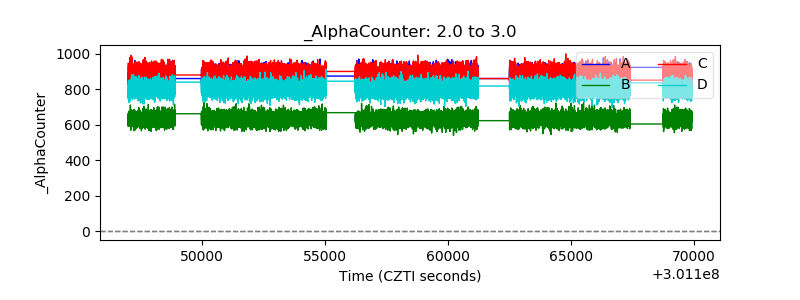 |
| _CPM_Rate | 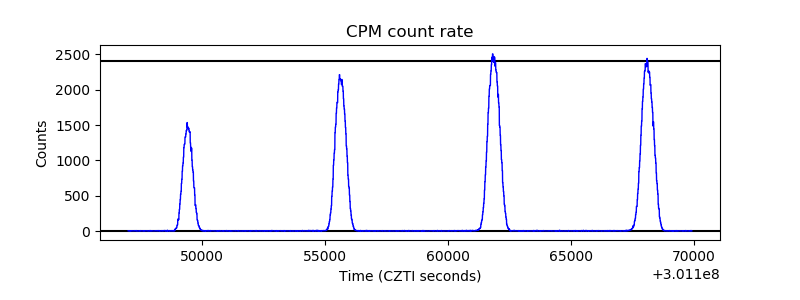 |
| CZT Counter | 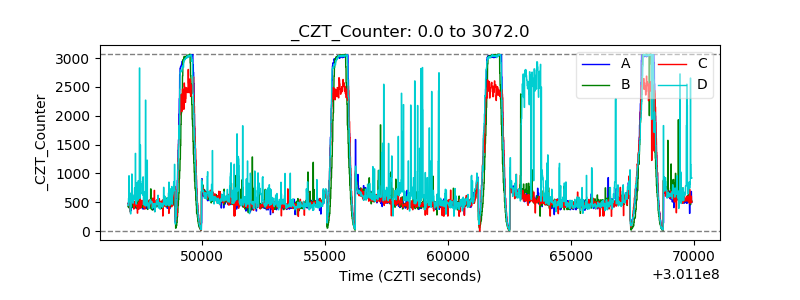 |
| +2.5 Volts monitor |  |
| +5 Volts monitor |  |
| _ROLL_ROT | 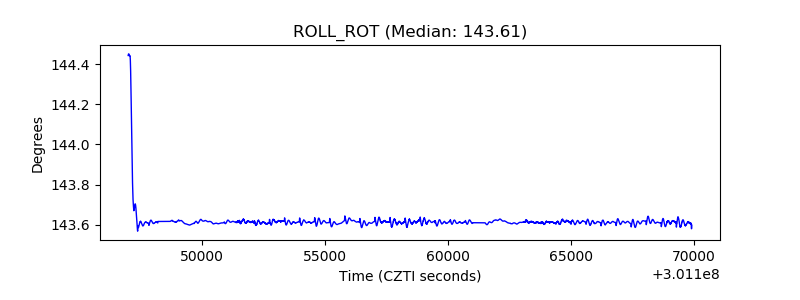 |
| _Roll_DEC |  |
| _Roll_RA | 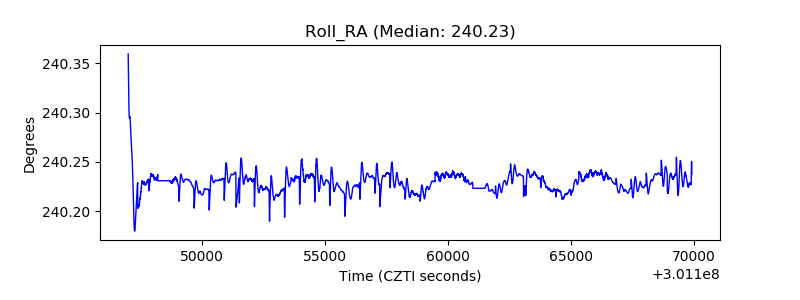 |
| Veto Counter | 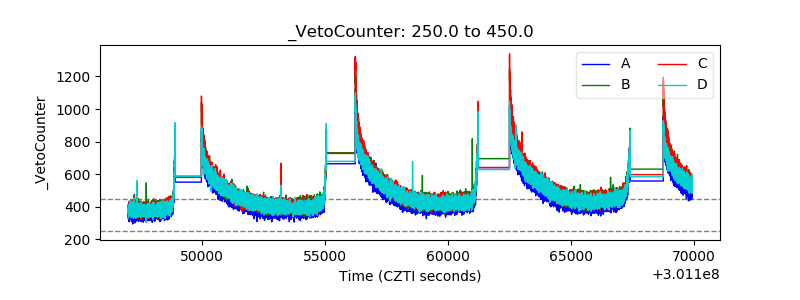 |