| Param | Original file | Final file |
|---|---|---|
| Filename | modeM0/AS1A05_088T03_9000003042_20569cztM0_level2.evt | modeM0/AS1A05_088T03_9000003042_20569cztM0_level2_quad_clean.evt |
| Size (bytes) | 468,748,800 | 94,412,160 |
| Size | 447.0 MB | 90.0 MB |
| Events in quadrant A | 3,124,235 | 619,297 |
| Events in quadrant B | 3,314,431 | 623,336 |
| Events in quadrant C | 3,185,871 | 606,236 |
| Events in quadrant D | 4,153,698 | 580,471 |
| Mode SS | |||
|---|---|---|---|
| Quadrant | BADHDUFLAG | Total packets | Discarded packets |
| A | 0 | 124 | 0 |
| B | 0 | 124 | 0 |
| C | 0 | 124 | 0 |
| D | 0 | 124 | 0 |
| Mode M9 | |||
|---|---|---|---|
| Quadrant | BADHDUFLAG | Total packets | Discarded packets |
| A | 0 | 21 | 0 |
| B | 0 | 22 | 0 |
| C | 0 | 22 | 0 |
| D | 0 | 22 | 0 |
| Mode M0 | |||
|---|---|---|---|
| Quadrant | BADHDUFLAG | Total packets | Discarded packets |
| A | 0 | 13138 | 2 |
| B | 0 | 13717 | 2 |
| C | 0 | 13205 | 2 |
| D | 0 | 16482 | 2 |
| Quadrant | Total seconds | Saturated seconds | Saturation percentage |
|---|---|---|---|
| A | 6161 | 35 | 0.568090% |
| B | 6161 | 58 | 0.941406% |
| C | 6161 | 68 | 1.103717% |
| D | 6161 | 162 | 2.629443% |
Noise dominated data is calculated using 1-second bins in cleaned event files. If a bin has >2000 counts, and if more than 50% of those come from <1% of pixels, then it is considered to be noise-dominated and hence unusable.
| Quadrant | # 1 sec bins | Bins with >0 counts | Bins with >2000 counts | High rate bins dominated by noise | Noise dominated (total time) | Noise dominated (detector-on time) | Marked lightcurve |
|---|---|---|---|---|---|---|---|
| A | 7516 | 6162 | 0 | 0 | 0.00% | 0.00% | 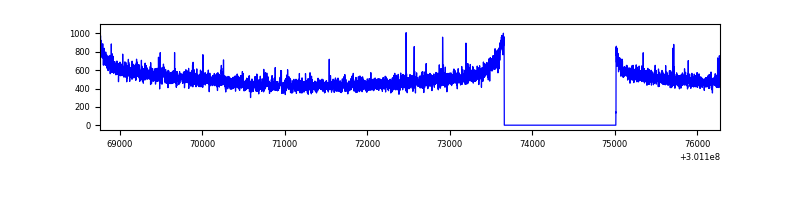 |
| B | 7516 | 6162 | 11 | 11 | 0.15% | 0.18% | 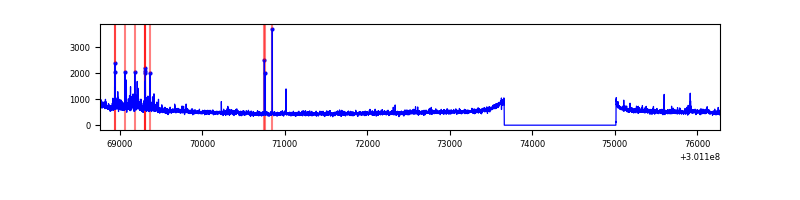 |
| C | 7516 | 6162 | 0 | 0 | 0.00% | 0.00% | 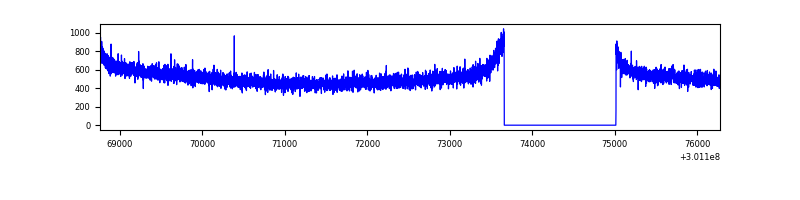 |
| D | 7516 | 6162 | 111 | 111 | 1.48% | 1.80% | 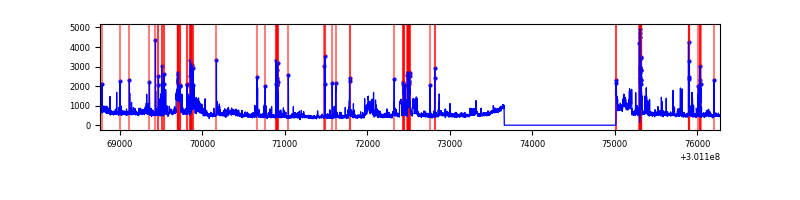 |
Top three noisy pixels from each quadrant. If the there are fewer than three noisy pixels in the level2.evt file, extra rows are filled as -1
| Pixel properties | Quadrant properties | ||||||
|---|---|---|---|---|---|---|---|
| Quadrant | DetID | PixID | Counts | Sigma | Mean | Median | Sigma |
| A | 6 | 16 | 23634 | 142.05 | 806 | 792 | 160.8 |
| A | 0 | 226 | 7177 | 39.71 | 806 | 792 | 160.8 |
| A | 3 | 137 | 6161 | 33.39 | 806 | 792 | 160.8 |
| B | 7 | 220 | 66341 | 441.33 | 802 | 784 | 148.5 |
| B | 0 | 197 | 47642 | 315.45 | 802 | 784 | 148.5 |
| B | 12 | 111 | 17134 | 110.07 | 802 | 784 | 148.5 |
| C | 14 | 238 | 122597 | 668.29 | 783 | 790 | 182.3 |
| C | 9 | 54 | 7103 | 34.64 | 783 | 790 | 182.3 |
| C | 13 | 61 | 5413 | 25.36 | 783 | 790 | 182.3 |
| D | 5 | 222 | 374869 | 2008.58 | 781 | 761 | 186.3 |
| D | 1 | 52 | 274683 | 1470.68 | 781 | 761 | 186.3 |
| D | 2 | 165 | 232948 | 1246.61 | 781 | 761 | 186.3 |
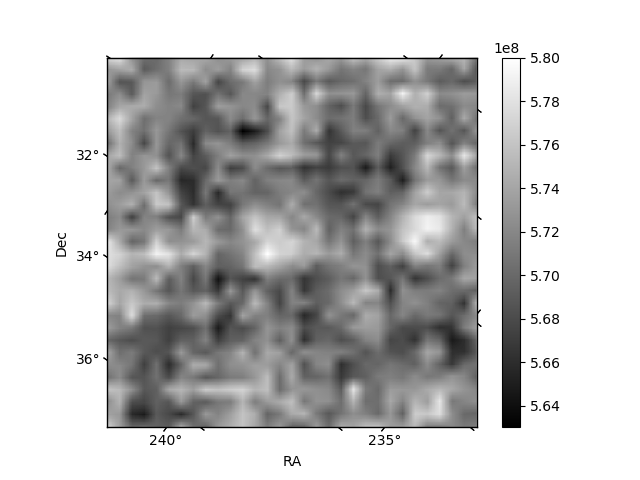
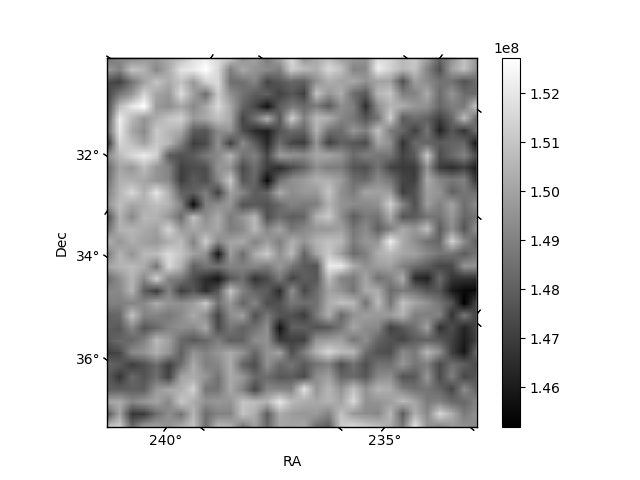
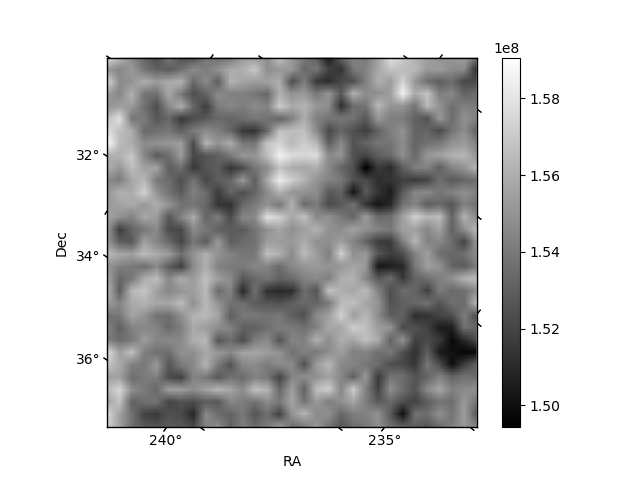
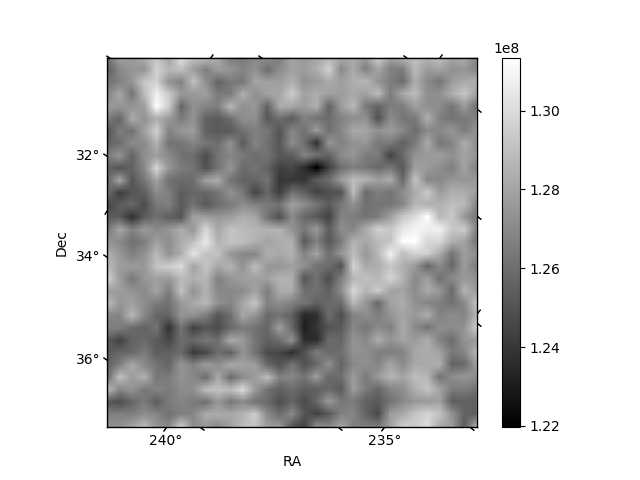
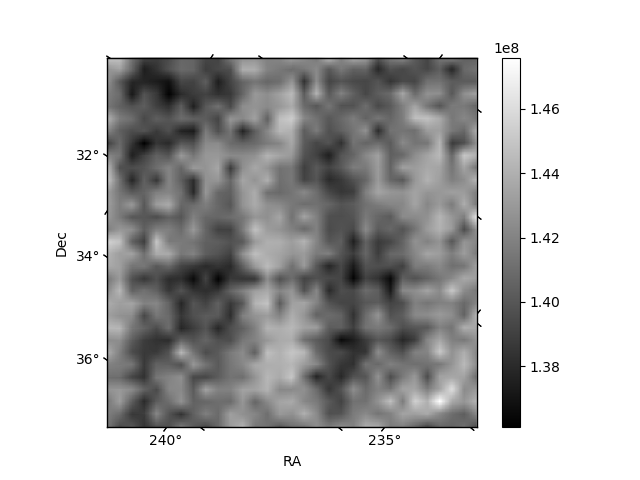
Histogram calculated using DETX and DETY for each event in the final _common_clean file
| Quadrant A | 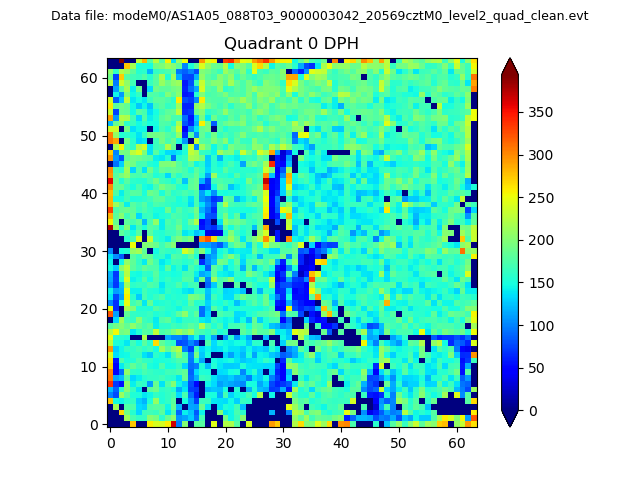 |
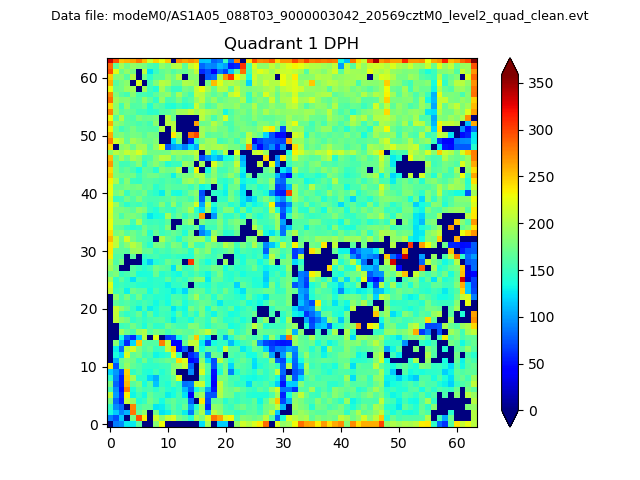 |
Quadrant B |
|---|---|---|---|
| Quadrant D |  |
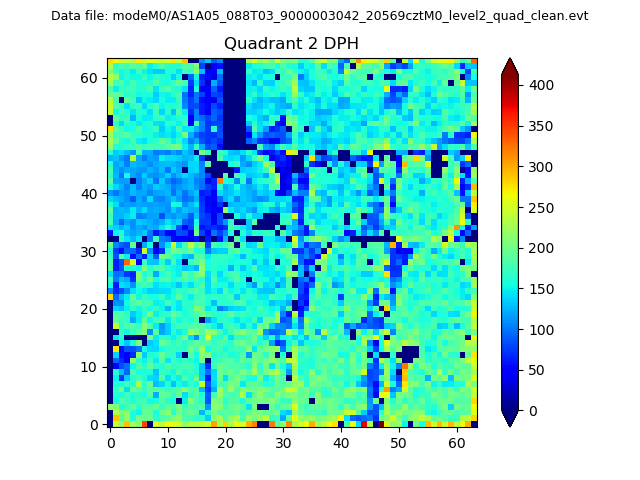 |
Quadrant C |
| Plot type | Count rate plots | Images |
|---|---|---|
| Comparison with Poisson distribution Blue bars denote a histogram of data divided into 1 sec bins. Red curve is a Poisson curve with rate = median count rate of data. |
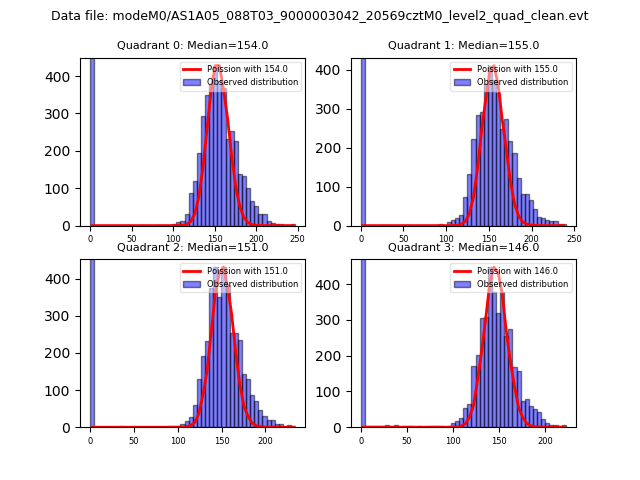 |
 |
| Quadrant-wise count rates Data is divided into 100 sec bins |
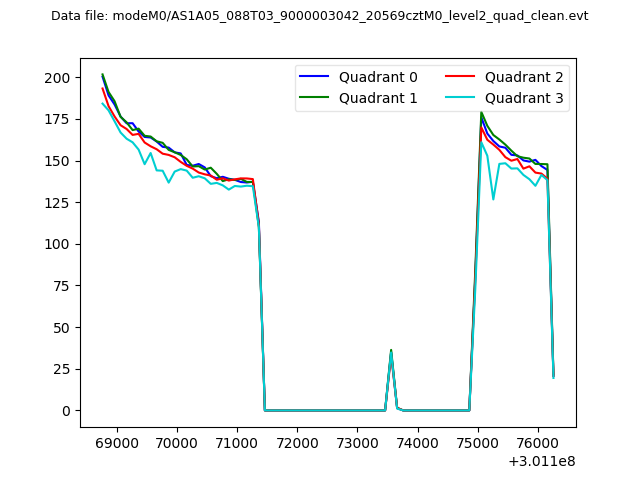 |
|
| Module-wise count rates for Quadrant A Data is divided into 100 sec bins |
 |
 |
| Module-wise count rates for Quadrant B Data is divided into 100 sec bins |
 |
 |
| Module-wise count rates for Quadrant C Data is divided into 100 sec bins |
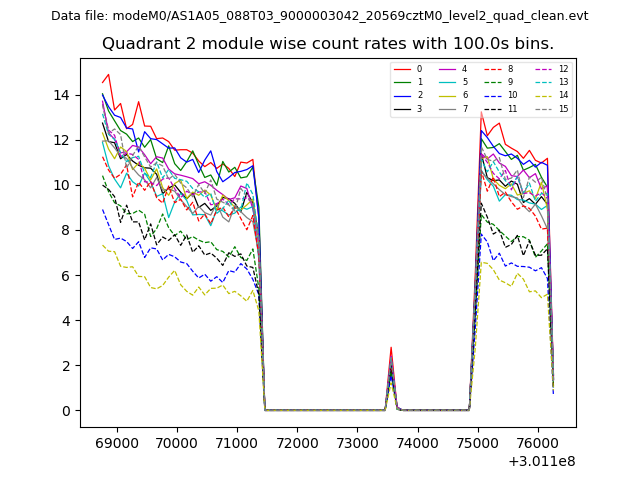 |
 |
| Module-wise count rates for Quadrant D Data is divided into 100 sec bins |
 |
 |
| Parameter | Plot |
|---|---|
| CZT HV Monitor | 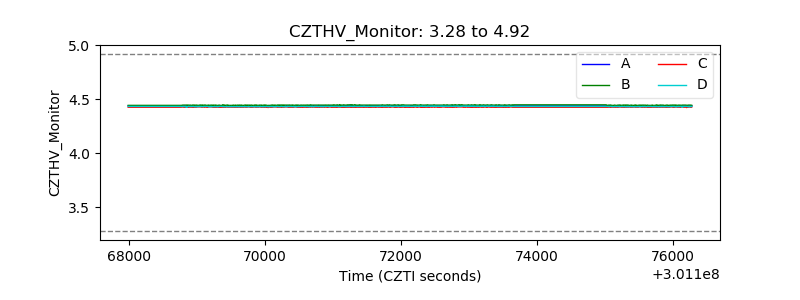 |
| D_VDD | 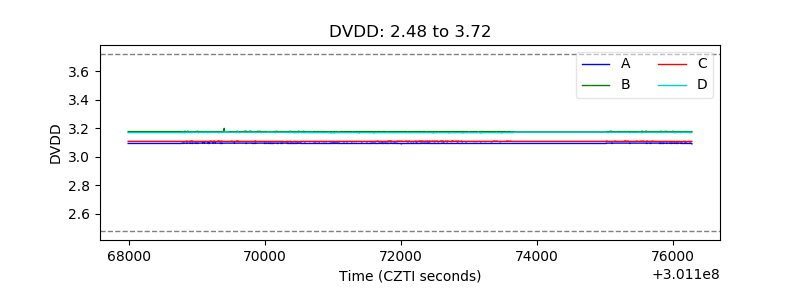 |
| Temperature 1 | 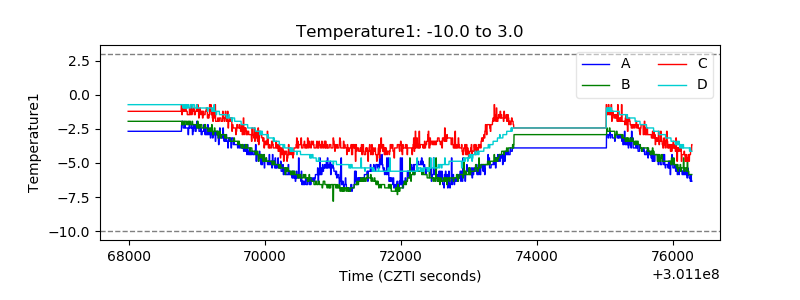 |
| Veto HV Monitor | 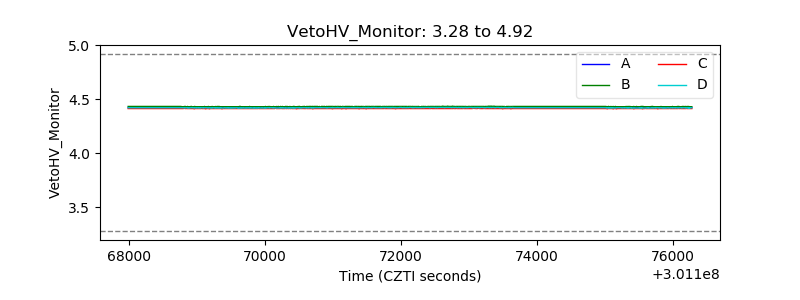 |
| Veto LLD | 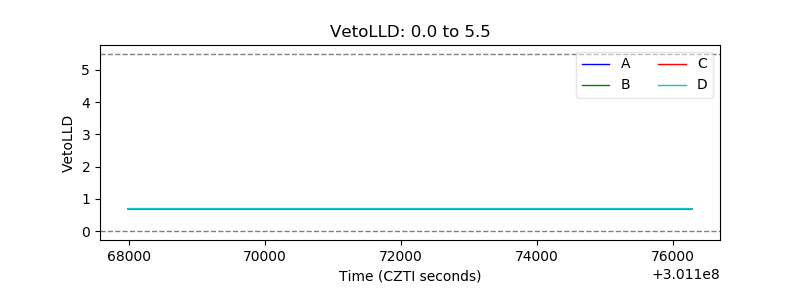 |
| Alpha Counter | 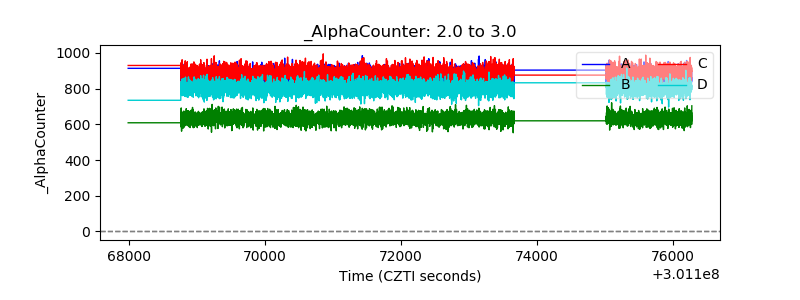 |
| _CPM_Rate |  |
| CZT Counter | 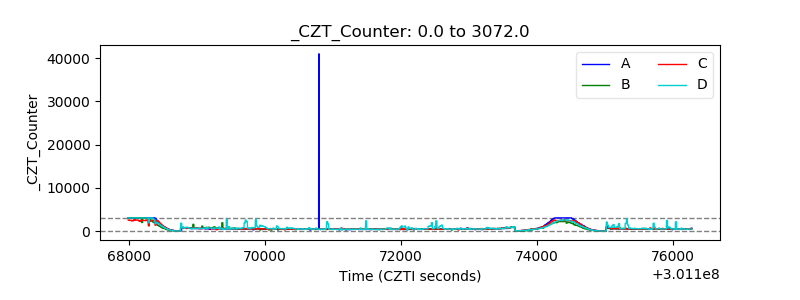 |
| +2.5 Volts monitor |  |
| +5 Volts monitor | 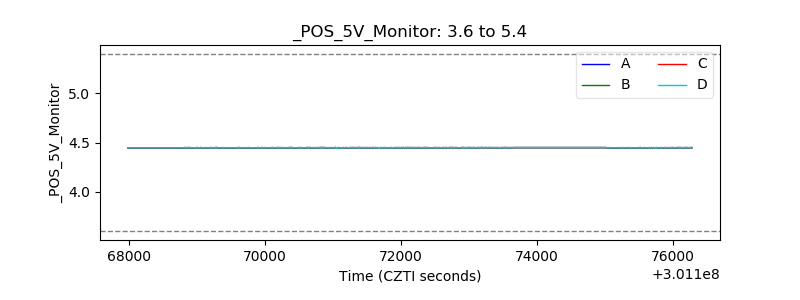 |
| _ROLL_ROT | 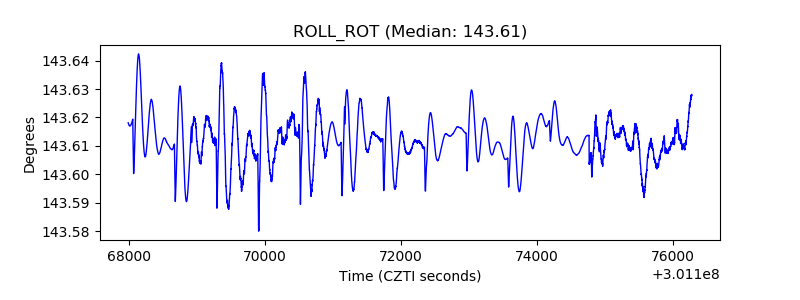 |
| _Roll_DEC | 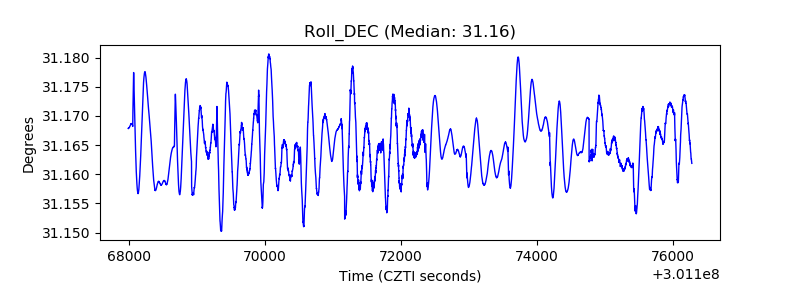 |
| _Roll_RA | 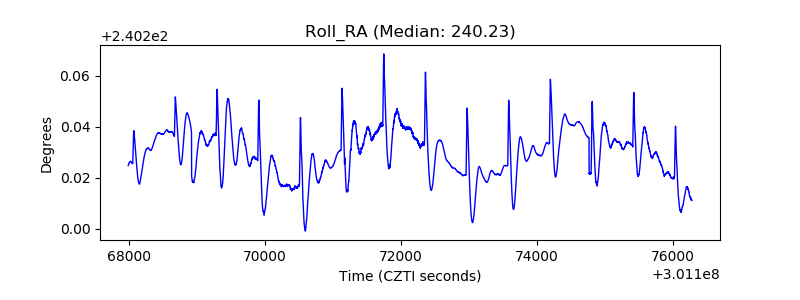 |
| Veto Counter |  |