| Param | Original file | Final file |
|---|---|---|
| Filename | modeM0/AS1A05_088T03_9000003042_20570cztM0_level2.evt | modeM0/AS1A05_088T03_9000003042_20570cztM0_level2_quad_clean.evt |
| Size (bytes) | 448,764,480 | 90,290,880 |
| Size | 428.0 MB | 86.1 MB |
| Events in quadrant A | 3,025,294 | 585,454 |
| Events in quadrant B | 3,107,798 | 592,264 |
| Events in quadrant C | 3,064,138 | 570,092 |
| Events in quadrant D | 3,971,454 | 552,669 |
| Mode SS | |||
|---|---|---|---|
| Quadrant | BADHDUFLAG | Total packets | Discarded packets |
| A | 0 | 126 | 0 |
| B | 0 | 126 | 0 |
| C | 0 | 126 | 0 |
| D | 0 | 126 | 0 |
| Mode M9 | |||
|---|---|---|---|
| Quadrant | BADHDUFLAG | Total packets | Discarded packets |
| A | 0 | 18 | 0 |
| B | 0 | 19 | 0 |
| C | 0 | 19 | 0 |
| D | 0 | 19 | 0 |
| Mode M0 | |||
|---|---|---|---|
| Quadrant | BADHDUFLAG | Total packets | Discarded packets |
| A | 0 | 12987 | 2 |
| B | 0 | 13119 | 2 |
| C | 0 | 12986 | 2 |
| D | 0 | 15911 | 2 |
| Quadrant | Total seconds | Saturated seconds | Saturation percentage |
|---|---|---|---|
| A | 6217 | 18 | 0.289529% |
| B | 6217 | 24 | 0.386038% |
| C | 6217 | 41 | 0.659482% |
| D | 6217 | 95 | 1.528068% |
Noise dominated data is calculated using 1-second bins in cleaned event files. If a bin has >2000 counts, and if more than 50% of those come from <1% of pixels, then it is considered to be noise-dominated and hence unusable.
| Quadrant | # 1 sec bins | Bins with >0 counts | Bins with >2000 counts | High rate bins dominated by noise | Noise dominated (total time) | Noise dominated (detector-on time) | Marked lightcurve |
|---|---|---|---|---|---|---|---|
| A | 7457 | 6218 | 1 | 1 | 0.01% | 0.02% | 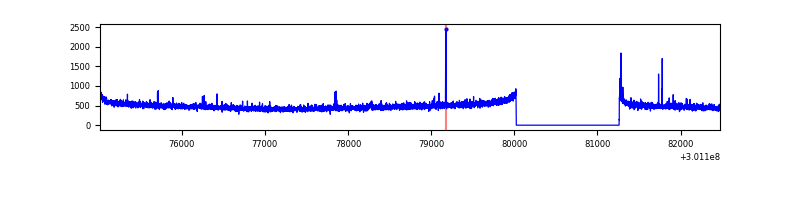 |
| B | 7457 | 6218 | 0 | 0 | 0.00% | 0.00% | 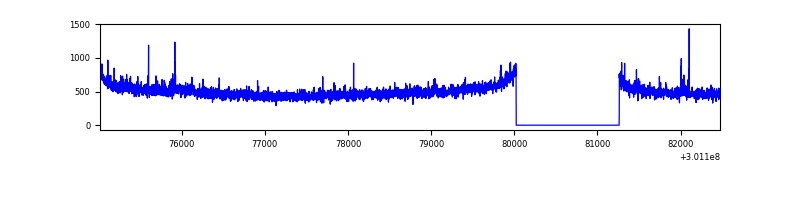 |
| C | 7457 | 6218 | 0 | 0 | 0.00% | 0.00% | 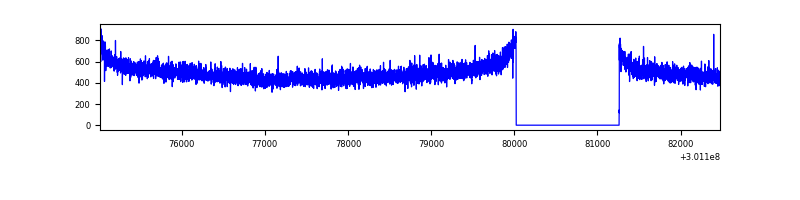 |
| D | 7457 | 6218 | 51 | 51 | 0.68% | 0.82% | 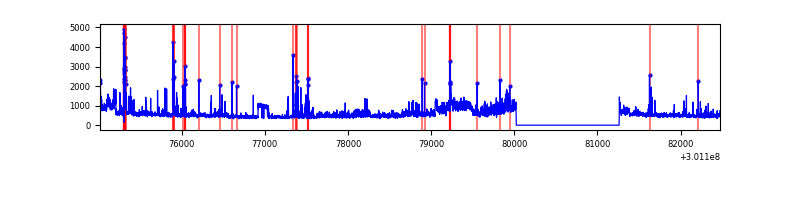 |
Top three noisy pixels from each quadrant. If the there are fewer than three noisy pixels in the level2.evt file, extra rows are filled as -1
| Pixel properties | Quadrant properties | ||||||
|---|---|---|---|---|---|---|---|
| Quadrant | DetID | PixID | Counts | Sigma | Mean | Median | Sigma |
| A | 12 | 96 | 23141 | 143.71 | 778 | 763 | 155.7 |
| A | 0 | 226 | 6821 | 38.9 | 778 | 763 | 155.7 |
| A | 3 | 137 | 6286 | 35.47 | 778 | 763 | 155.7 |
| B | 0 | 197 | 25565 | 171.51 | 776 | 759 | 144.6 |
| B | 12 | 111 | 17571 | 116.24 | 776 | 759 | 144.6 |
| B | 11 | 111 | 15098 | 99.14 | 776 | 759 | 144.6 |
| C | 14 | 238 | 118836 | 668.41 | 754 | 761 | 176.6 |
| C | 9 | 54 | 6908 | 34.8 | 754 | 761 | 176.6 |
| C | 13 | 61 | 5198 | 25.12 | 754 | 761 | 176.6 |
| D | 5 | 222 | 473724 | 2605.32 | 753 | 733 | 181.5 |
| D | 1 | 20 | 232282 | 1275.41 | 753 | 733 | 181.5 |
| D | 1 | 52 | 196364 | 1077.57 | 753 | 733 | 181.5 |
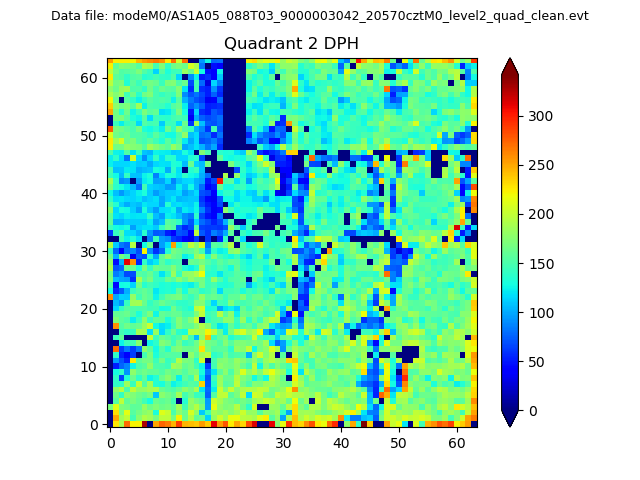
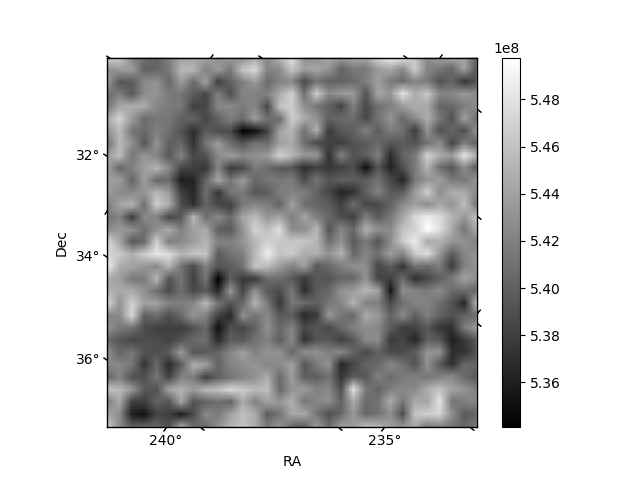
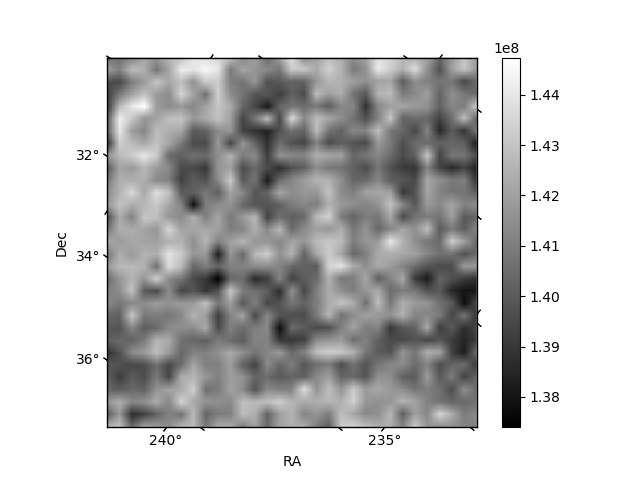
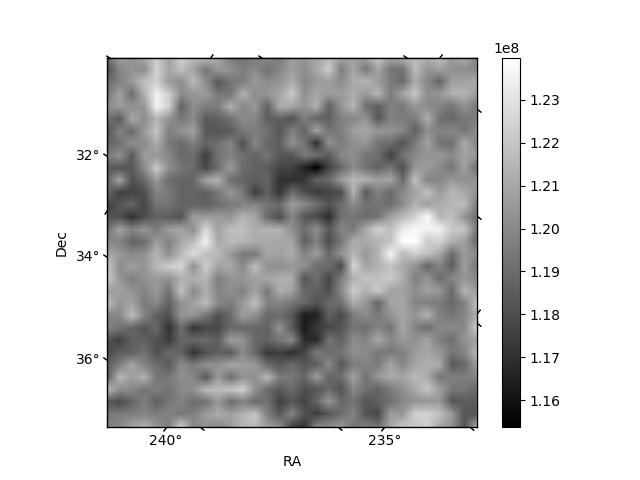
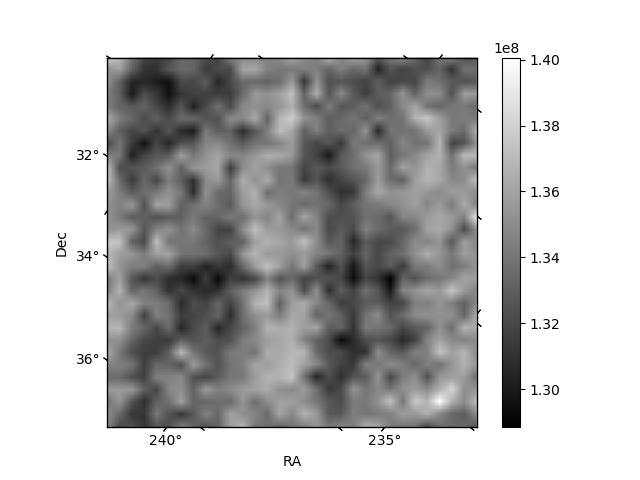
Histogram calculated using DETX and DETY for each event in the final _common_clean file
| Quadrant A | 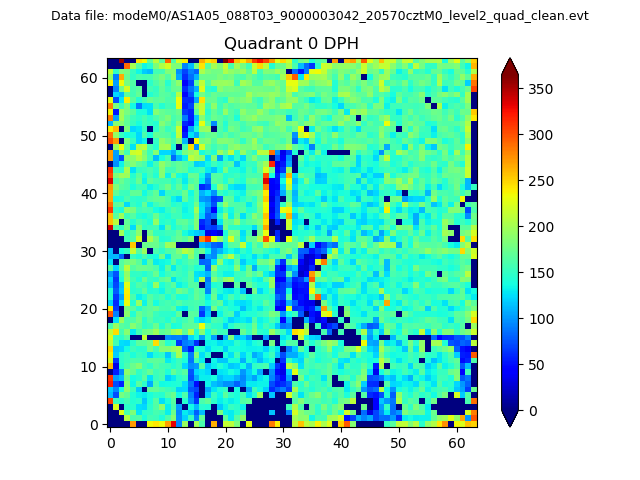 |
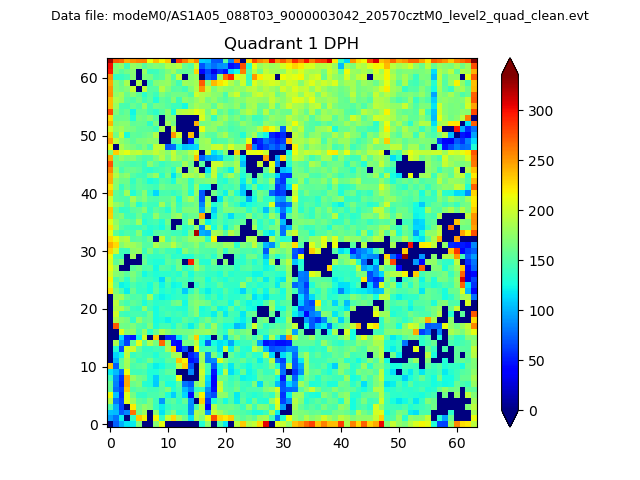 |
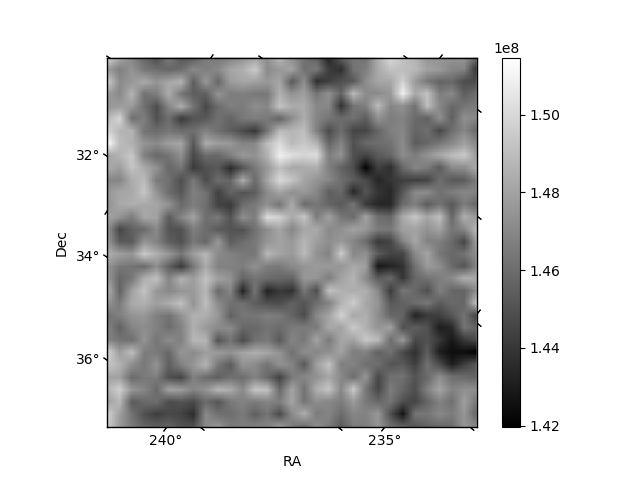
Quadrant B |
|---|---|---|---|
| Quadrant D | 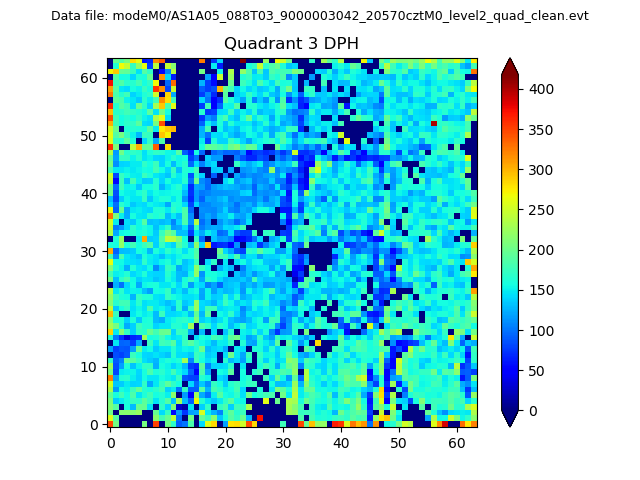 |
 |
Quadrant C |
| Plot type | Count rate plots | Images |
|---|---|---|
| Comparison with Poisson distribution Blue bars denote a histogram of data divided into 1 sec bins. Red curve is a Poisson curve with rate = median count rate of data. |
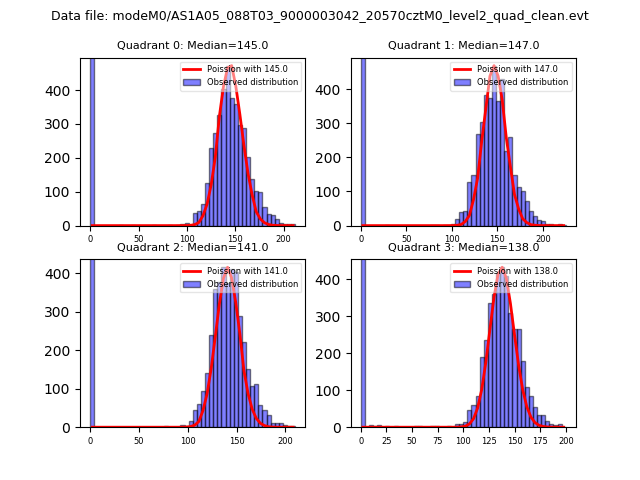 |
 |
| Quadrant-wise count rates Data is divided into 100 sec bins |
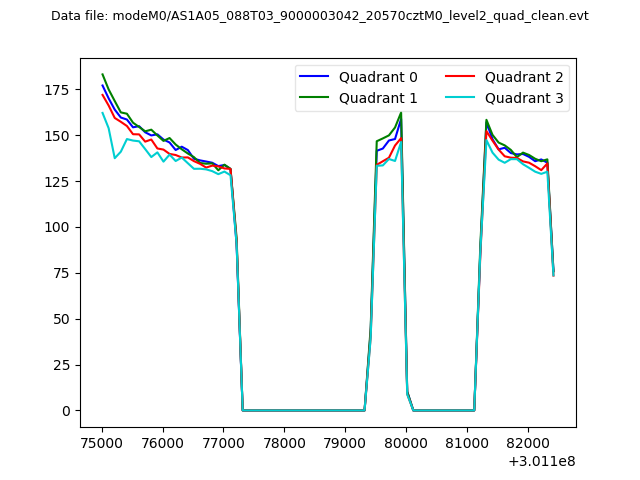 |
|
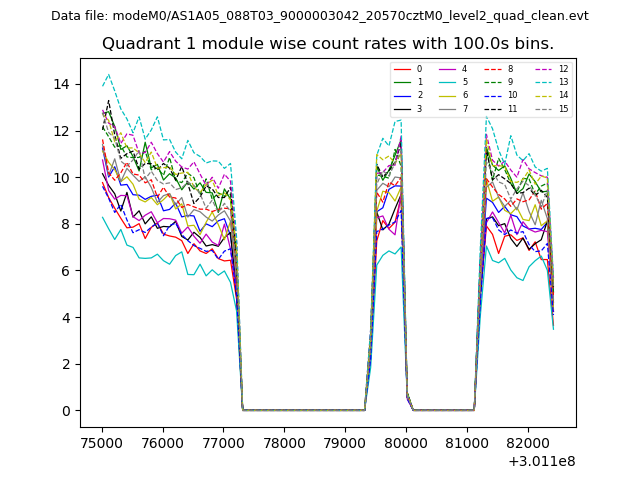
| Module-wise count rates for Quadrant A Data is divided into 100 sec bins |
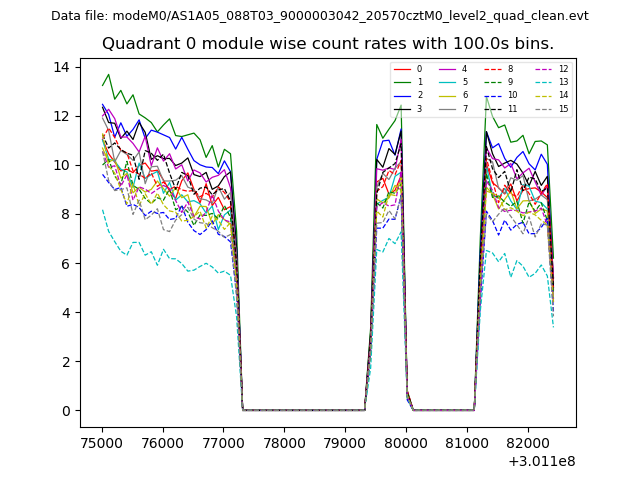 |
 |
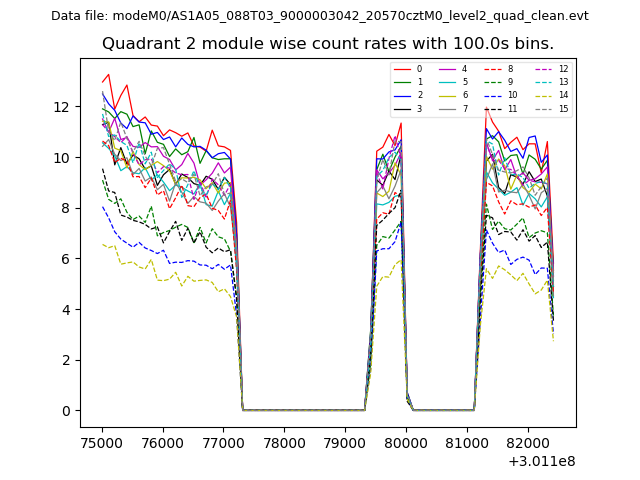
| Module-wise count rates for Quadrant B Data is divided into 100 sec bins |
 |
 |
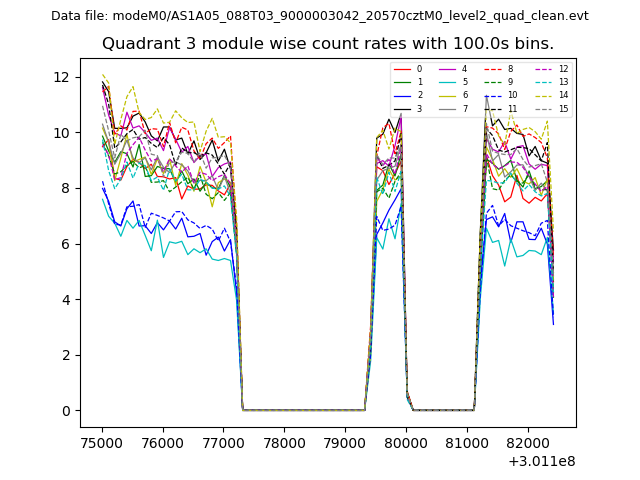
| Module-wise count rates for Quadrant C Data is divided into 100 sec bins |
 |
 |
| Module-wise count rates for Quadrant D Data is divided into 100 sec bins |
 |
 |
| Parameter | Plot |
|---|---|
| CZT HV Monitor | 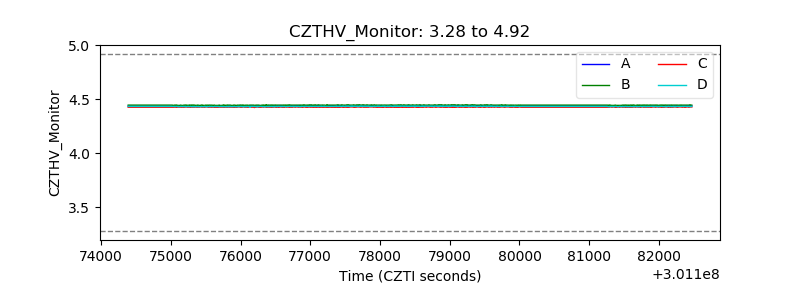 |
| D_VDD | 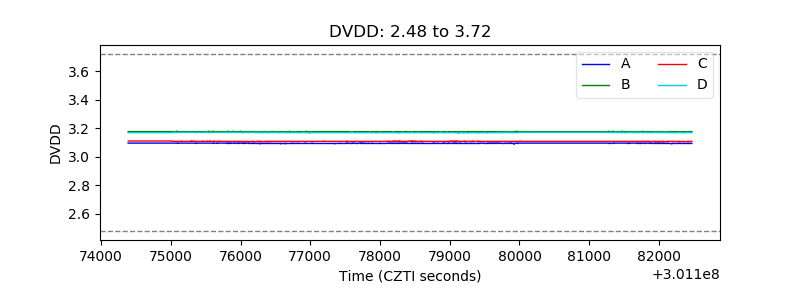 |
| Temperature 1 | 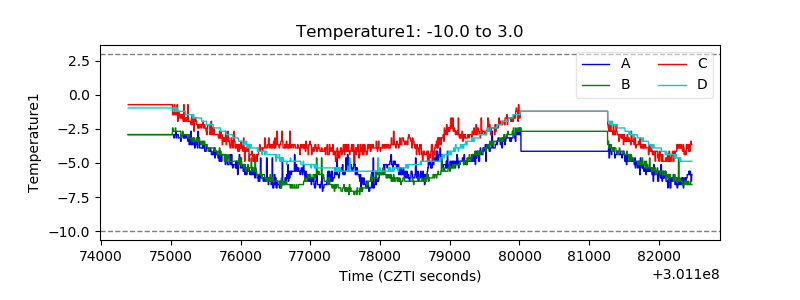 |
| Veto HV Monitor | 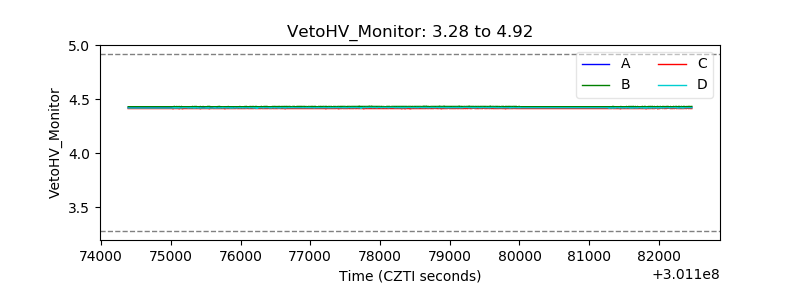 |
| Veto LLD | 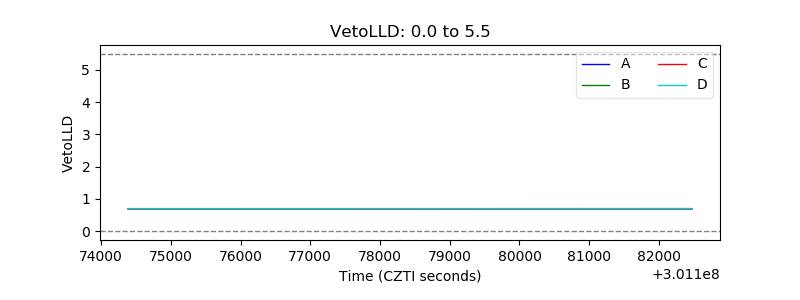 |
| Alpha Counter | 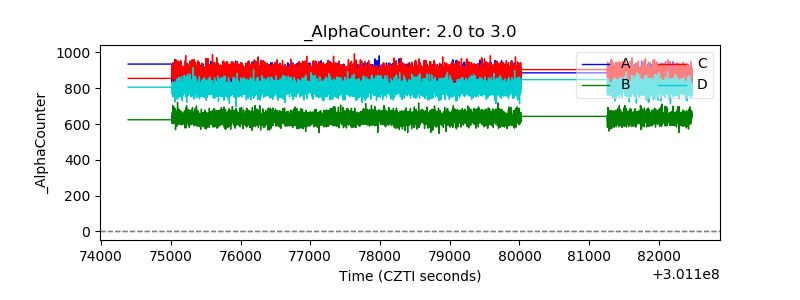 |
| _CPM_Rate | 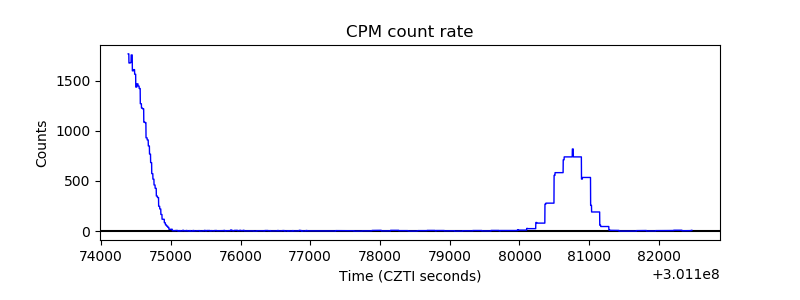 |
| CZT Counter | 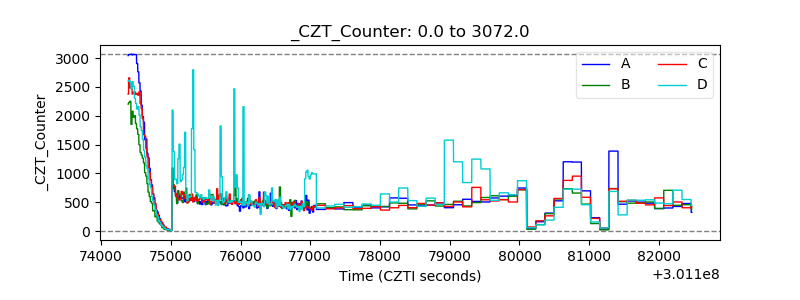 |
| +2.5 Volts monitor |  |
| +5 Volts monitor |  |
| _ROLL_ROT | 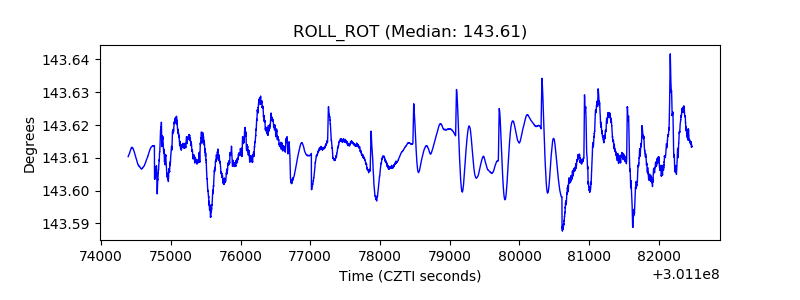 |
| _Roll_DEC | 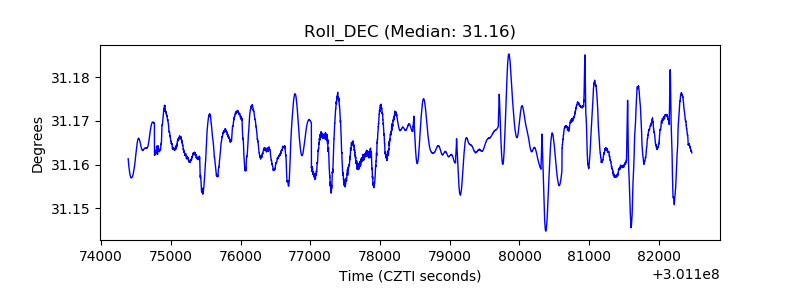 |
| _Roll_RA | 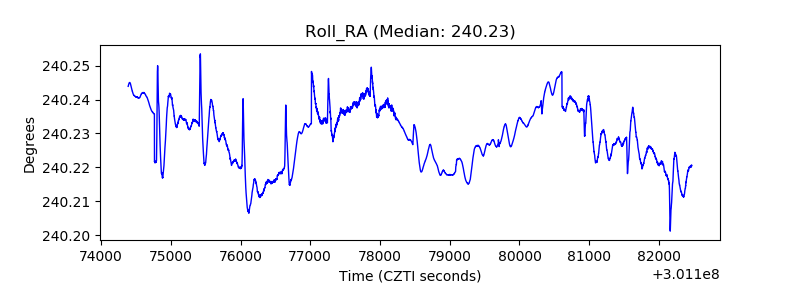 |
| Veto Counter | 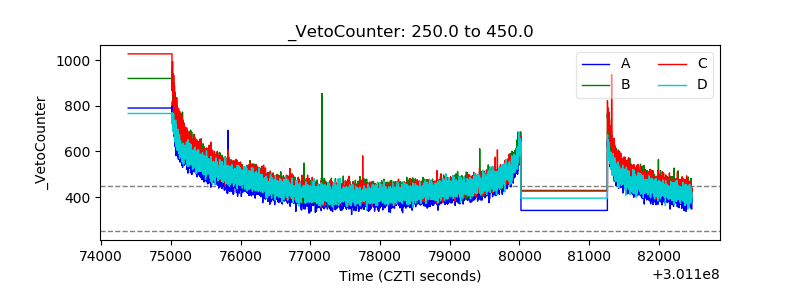 |