| Param | Original file | Final file |
|---|---|---|
| Filename | modeM0/AS1A05_088T03_9000003042_20571cztM0_level2.evt | modeM0/AS1A05_088T03_9000003042_20571cztM0_level2_quad_clean.evt |
| Size (bytes) | 454,763,520 | 95,935,680 |
| Size | 433.7 MB | 91.5 MB |
| Events in quadrant A | 3,146,791 | 618,899 |
| Events in quadrant B | 3,267,901 | 622,349 |
| Events in quadrant C | 3,191,257 | 605,665 |
| Events in quadrant D | 3,710,484 | 590,561 |
| Mode SS | |||
|---|---|---|---|
| Quadrant | BADHDUFLAG | Total packets | Discarded packets |
| A | 0 | 136 | 0 |
| B | 0 | 136 | 0 |
| C | 0 | 136 | 0 |
| D | 0 | 136 | 0 |
| Mode M9 | |||
|---|---|---|---|
| Quadrant | BADHDUFLAG | Total packets | Discarded packets |
| A | 0 | 15 | 0 |
| B | 0 | 16 | 0 |
| C | 0 | 16 | 0 |
| D | 0 | 16 | 0 |
| Mode M0 | |||
|---|---|---|---|
| Quadrant | BADHDUFLAG | Total packets | Discarded packets |
| A | 0 | 13828 | 2 |
| B | 0 | 13997 | 2 |
| C | 0 | 13821 | 2 |
| D | 0 | 15536 | 2 |
| Quadrant | Total seconds | Saturated seconds | Saturation percentage |
|---|---|---|---|
| A | 6713 | 21 | 0.312826% |
| B | 6713 | 43 | 0.640548% |
| C | 6713 | 58 | 0.863995% |
| D | 6713 | 44 | 0.655445% |
Noise dominated data is calculated using 1-second bins in cleaned event files. If a bin has >2000 counts, and if more than 50% of those come from <1% of pixels, then it is considered to be noise-dominated and hence unusable.
| Quadrant | # 1 sec bins | Bins with >0 counts | Bins with >2000 counts | High rate bins dominated by noise | Noise dominated (total time) | Noise dominated (detector-on time) | Marked lightcurve |
|---|---|---|---|---|---|---|---|
| A | 7583 | 6714 | 0 | 0 | 0.00% | 0.00% | 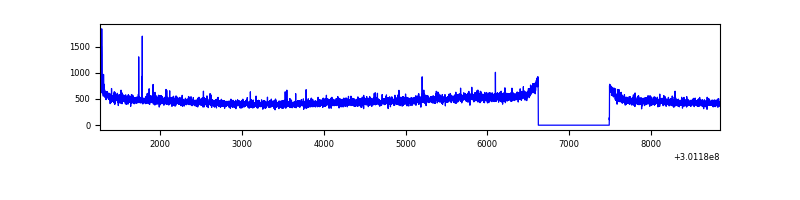 |
| B | 7583 | 6714 | 2 | 2 | 0.03% | 0.03% | 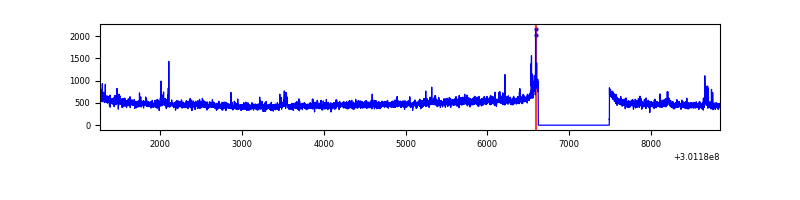 |
| C | 7583 | 6714 | 0 | 0 | 0.00% | 0.00% | 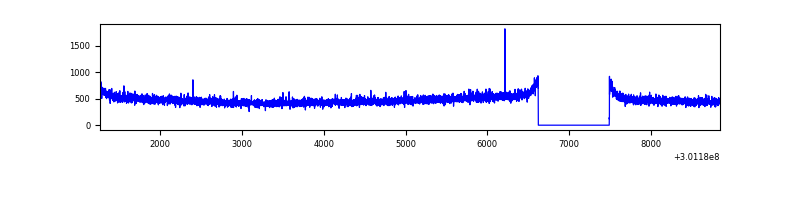 |
| D | 7583 | 6714 | 18 | 18 | 0.24% | 0.27% | 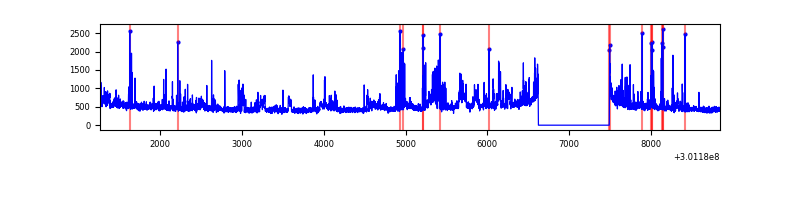 |
Top three noisy pixels from each quadrant. If the there are fewer than three noisy pixels in the level2.evt file, extra rows are filled as -1
| Pixel properties | Quadrant properties | ||||||
|---|---|---|---|---|---|---|---|
| Quadrant | DetID | PixID | Counts | Sigma | Mean | Median | Sigma |
| A | 12 | 96 | 16908 | 98.4 | 812 | 796 | 163.7 |
| A | 0 | 226 | 7039 | 38.13 | 812 | 796 | 163.7 |
| A | 3 | 137 | 6723 | 36.2 | 812 | 796 | 163.7 |
| B | 0 | 230 | 34195 | 217.18 | 811 | 790 | 153.8 |
| B | 12 | 111 | 18645 | 116.08 | 811 | 790 | 153.8 |
| B | 11 | 111 | 16753 | 103.78 | 811 | 790 | 153.8 |
| C | 14 | 238 | 122922 | 662.32 | 787 | 794 | 184.4 |
| C | 13 | 61 | 5366 | 24.79 | 787 | 794 | 184.4 |
| C | 3 | 233 | 1979 | 6.43 | 787 | 794 | 184.4 |
| D | 1 | 20 | 271078 | 1434.24 | 789 | 770 | 188.5 |
| D | 1 | 52 | 229006 | 1211.01 | 789 | 770 | 188.5 |
| D | 5 | 222 | 95591 | 503.12 | 789 | 770 | 188.5 |
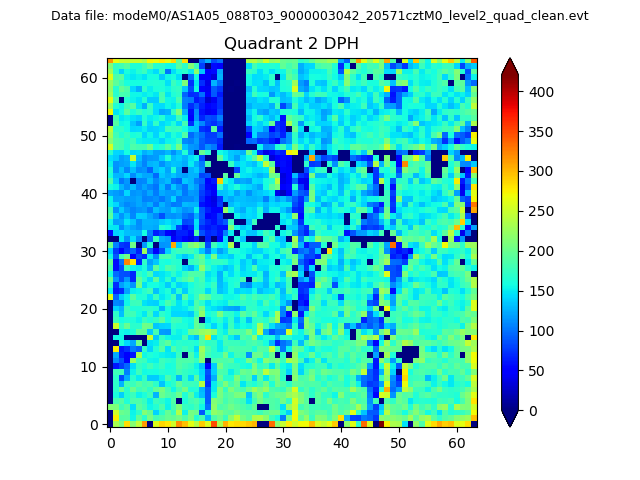
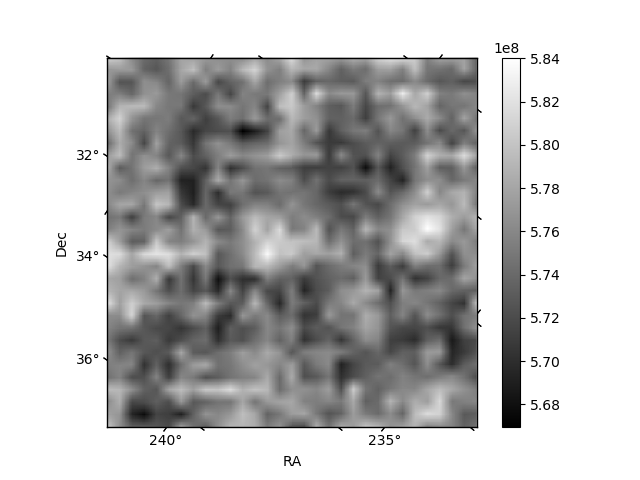
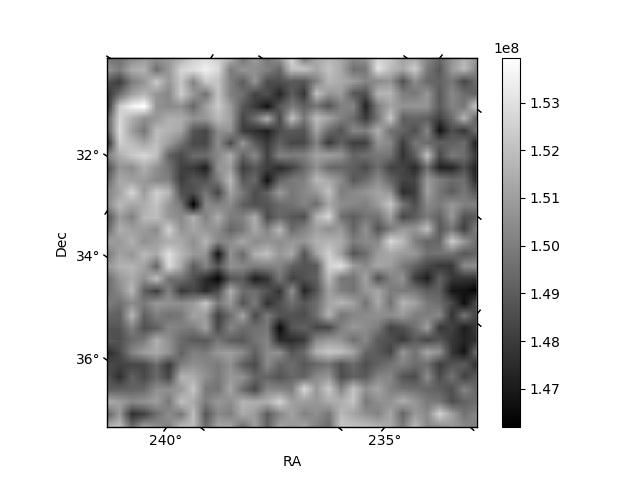
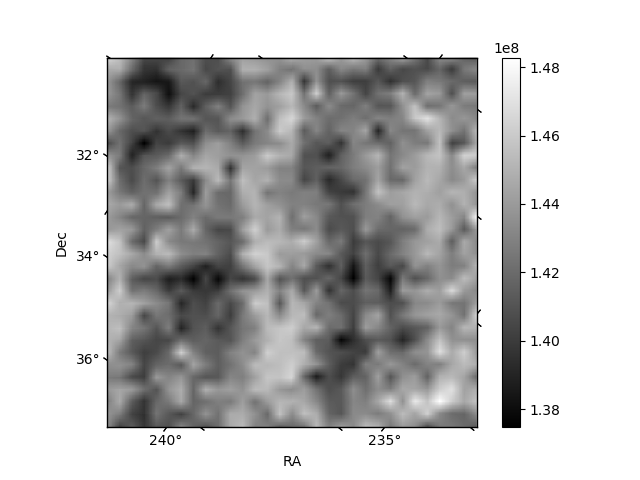
Histogram calculated using DETX and DETY for each event in the final _common_clean file
| Quadrant A | 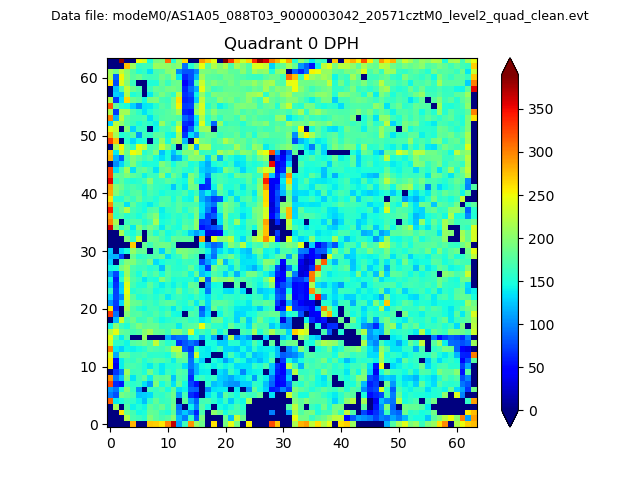 |
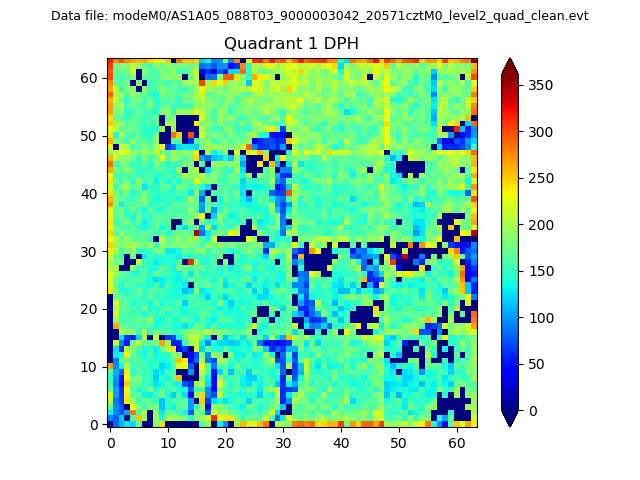 |
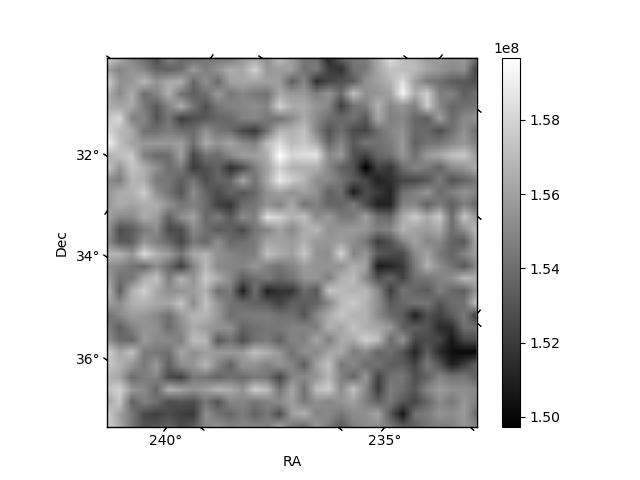
Quadrant B |
|---|---|---|---|
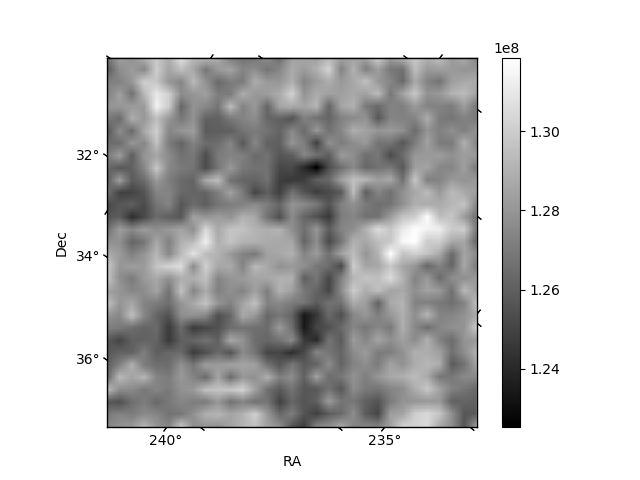
| Quadrant D | 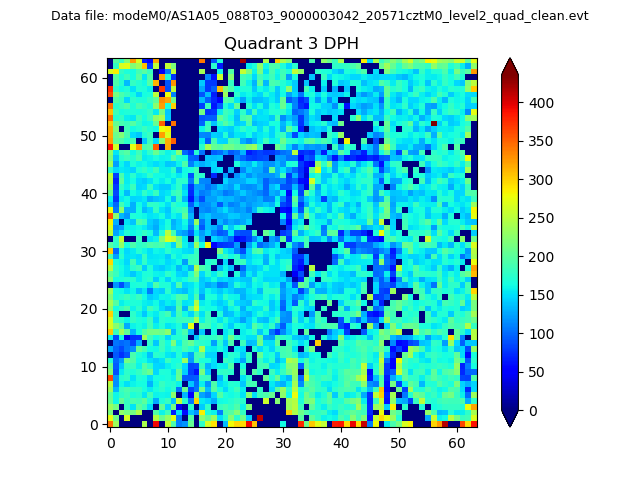 |
 |
Quadrant C |
| Plot type | Count rate plots | Images |
|---|---|---|
| Comparison with Poisson distribution Blue bars denote a histogram of data divided into 1 sec bins. Red curve is a Poisson curve with rate = median count rate of data. |
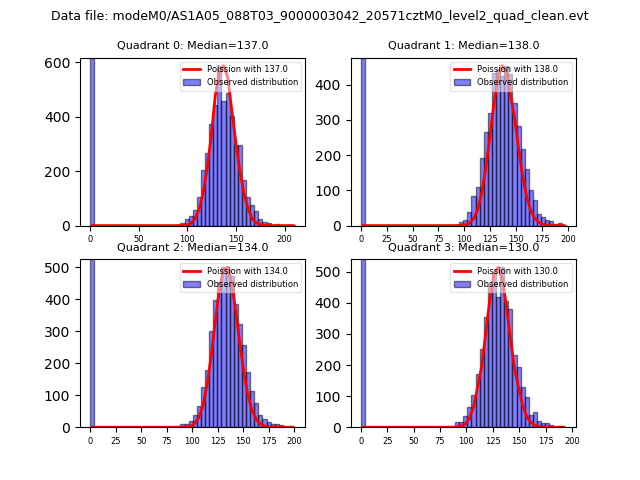 |
 |
| Quadrant-wise count rates Data is divided into 100 sec bins |
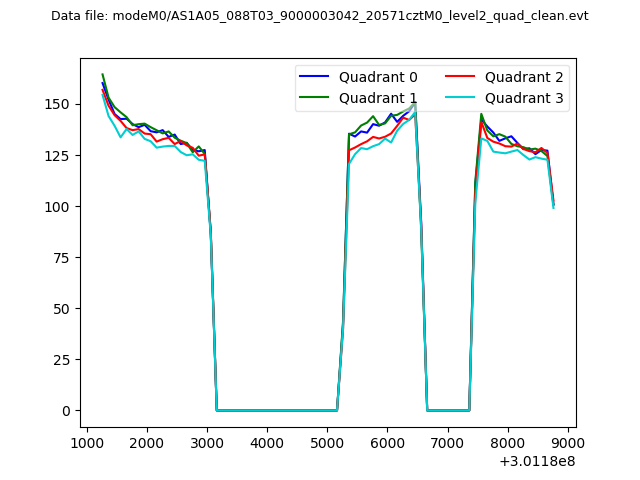 |
|
| Module-wise count rates for Quadrant A Data is divided into 100 sec bins |
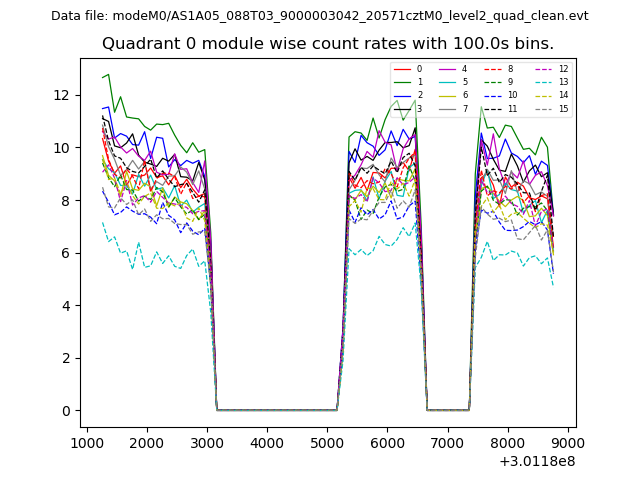 |
 |
| Module-wise count rates for Quadrant B Data is divided into 100 sec bins |
 |
 |
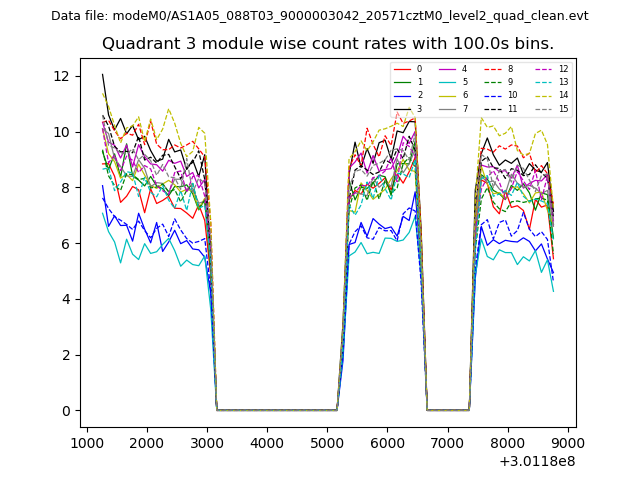
| Module-wise count rates for Quadrant C Data is divided into 100 sec bins |
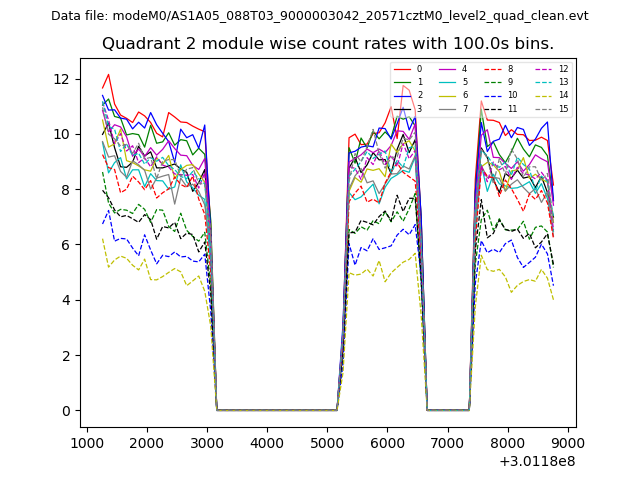 |
 |
| Module-wise count rates for Quadrant D Data is divided into 100 sec bins |
 |
 |
| Parameter | Plot |
|---|---|
| CZT HV Monitor |  |
| D_VDD | 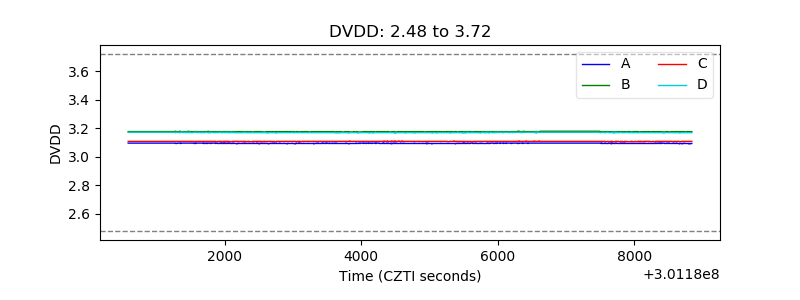 |
| Temperature 1 | 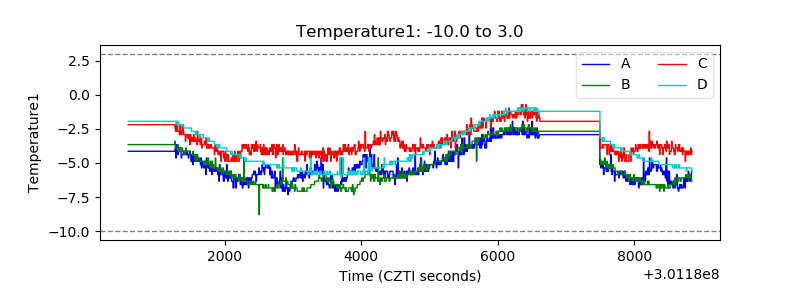 |
| Veto HV Monitor | 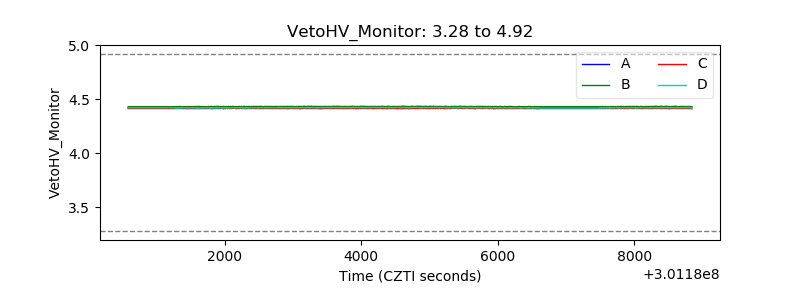 |
| Veto LLD | 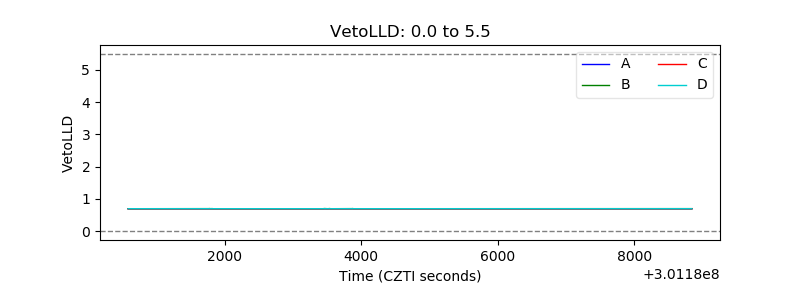 |
| Alpha Counter | 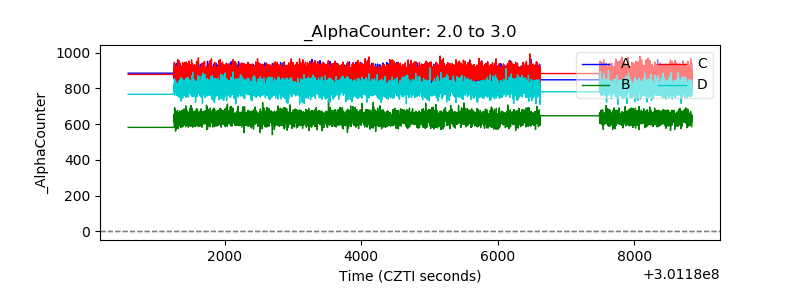 |
| _CPM_Rate | 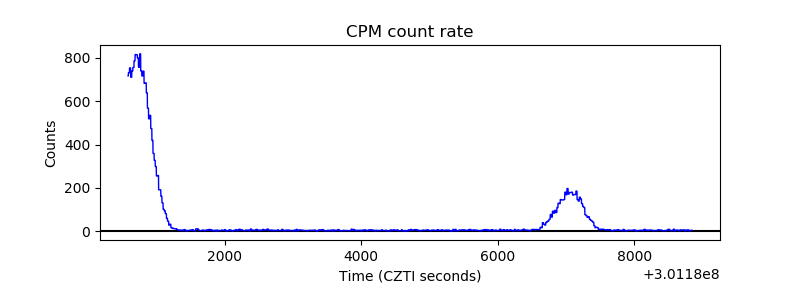 |
| CZT Counter | 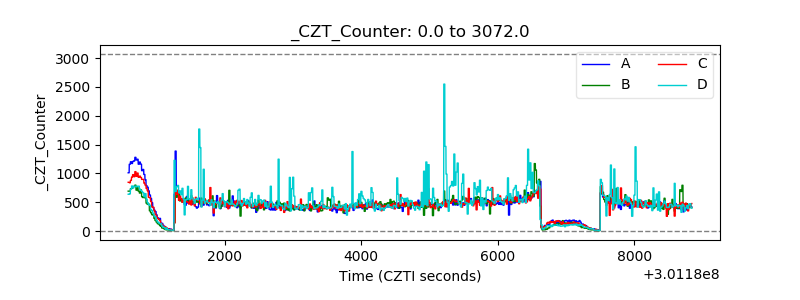 |
| +2.5 Volts monitor |  |
| +5 Volts monitor |  |
| _ROLL_ROT |  |
| _Roll_DEC | 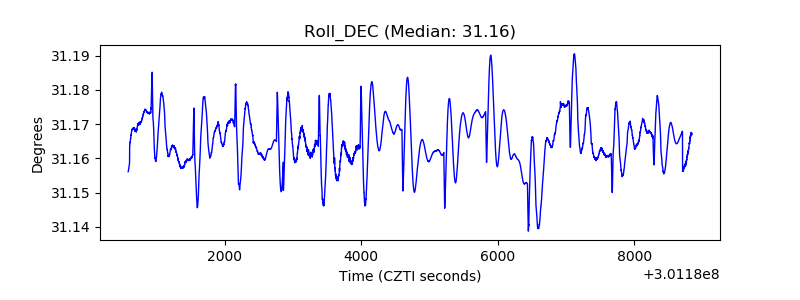 |
| _Roll_RA | 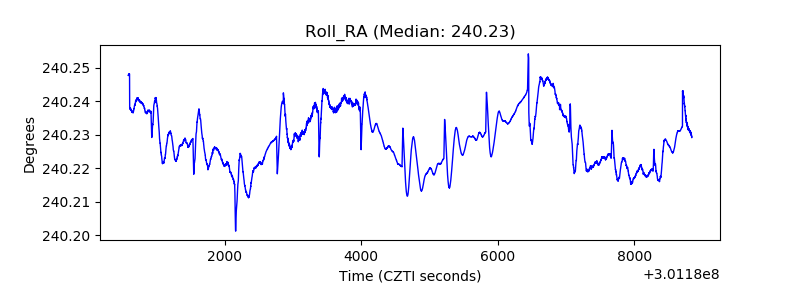 |
| Veto Counter |  |